Modelling Exchange Rate Volatility in the Run-up to EMU using a Markov Switching GARCH Model
Modelling Exchange Rate Volatility in the Run-up to EMU using a Markov Switching GARCH Model Michael Frömmel, Universität Hannover Discussion paper No...
Modelling Exchange Rate Volatility in the Run-up to EMU using a Markov Switching GARCH Model Michael Frömmel, Universität Hannover Discussion paper No. 306 October 2004 ISSN 0949-9962
Abstract: The volatility of exchange rates is of high importance, because it affects decisions of market participants. The choice of the exchange rate arrangement affects the volatility of the exchange rate: higher flexibility goes ahead with increasing volatility and vice versa. We investigate the exchange rate volatility of possible initial members prior to the launch of European Monetary Union (EMU). The analysis merges two approaches, the GARCH-model (Bollerslev, 1986) and the Markov Switching Model (Hamilton, 1989). We discover a switch towards a low-volatility level in the run-up to the meeting of the EU council in Brussels in May 1998. The exact date of the switch differs depending on the particular currency, but has always been taken place between the end of 1997 and March 1998, when the convergence report was released. In contrast, and after the convergence report was published there was hardly any uncertainty left in the market. JEL-Classification: E42, F31, F36 Keywords: Exchange rate volatility, European Monetary Union, Regime Switching GARCH I would like to thank the following people for helpful suggestions: Olaf Hübler, Hans-Helmut Kotz and Lukas Menkhoff. The author is responsible for all opinions expressed in this paper and for all remaining errors. Financial support by the Deutsche Forschungsgemeinschaft is gratefully acknowledged. Geld und Internationale Finanzwirtschaft, Universität Hannover, Königsworther Platz 1, 30167 Hannover, [email protected]
2
Modelling Exchange Rate Volatility in the Run-up to EMU using a Markov Switching GARCH Model 1
Introduction
The volatility of exchange rates determines decisions of market participants. Its special importance follows from serving as a risk measure as well as a determinant of derivatives. Therefore, estimating and forecasting the volatility of asset prices has received increasing attention in economic research during the last two decades. The well-known and popular GARCH model, based on the seminal works by Engle (1982) and Bollerslev (1986), has turned out to become the workhorse in this field of research: It is widely used (for surveys see, inter alia, Bollerslev, Chou and Kroner, 1992; Bollerslev, Engle and Nelson, 1994; Franses and van Dijk, 2000; Poon and Granger, 2003) and provides accurate forecasts (Andersen and Bollerslev, 1998). However, problems may arise if the underlying volatility process is subject to structural breaks, especially shifts in the overall level of volatility. In this case the persistence of volatility shocks is systematically overestimated (Lamoureux and Lastrapes, 1990; Timmermann, 2000; Klaassen, 2002). A common way to deal with this problem is to introduce dummy variables for subperiods reflecting the change in volatility level. In most cases, however, it is not possible to determine the date of the shift sufficiently accurately, or the date itself is subject to the analysis and cannot be determined exogenously. Especially in the latter situation it may be more convenient to model the structural break endogenously by merging the classical GARCH model with a regime switching model, for instance the Markov witching model (Hamilton, 1989), to a regime switching GARCH model. In this paper we apply a regime switching GARCH model for analysing the transition from exchange rate mechanism (ERM) of the late European Monetary System (EMS) to the European Monetary Union (EMU), which has been established in January 1998. This transition forms a special case of the transition from a flexible to a fix exchange rate arrangement. The structure of the paper is as follows: Section 1 has motivated the use of regime switching models for the analysis of volatility. Section 2 introduces the Markov Switching GARCH model, whereas Section 3 highlights the economic background of the transition from EMS to EMU. Section 4 presents the data and estimation results, and Section 5 summarises the main results.
3
2
The Markov Switching GARCH Model
The Markov Switching GARCH (MS-GARCH) model has been independently introduced by Cai (1994) and Hamilton and Susmel (1994). It is completely characterised by the four elements mean process, state process, variance process and the distribution of the error term. For the mean process we rely on a simple random walk, since the analysis focuses solely on the variance dynamics of the exchange rate. That is for the log of the exchange rate pt the exchange rate return rt = pt - pt-1 is given by (conditional on the state variable st which may take the values 1 or 2)
(1)
µ1 + ε t , s t = 1 rt = µ 2 + ε t , s t = 2
with conditional means µi , i∈{1,2} and an error term εt which will be discussed in more detail later. The state process st follows a time-discrete, ergodic Markov process with two possible states.1. The dynamics of this process is given by the transition matrix P and the probability distribution in t = 1:
(2)
p 21 p P = 11 , p12 p 22 with pij=P(st=j| st-1=i), π1={P(s1=1|Φ0),P(s1=2|Φ0)} Φt is the set of available information at time t, consisting of the past prices and
inference on the state process up to time t. π1 commonly uses the steady state probabilities of the Markov process (Hamilton, 1994): P(s1 = 1| Φ 0 ) = P(s1 = 1 ) =
(3)
1 − p 22 , 2 − p11 − p 22
and P(s1 = 2 | Φ 0 ) = P(s1 = 2 ) = 1 − P(s1 = 2 ) If there is no a-priori preference for one of the possible states, one could also
consider P(s1=1|Φ0) = P(s1=2|Φ0) = 0.5. Starting with the initial probabilities several series of probabilities can be calculated recursively:
1
The model can be easily generalised to k states, as well as the mean process can be modified. This will, however, not lead to substantial changes in the model, so we rely on the simple model as described in the main text.
4
The filter probabilities P(st=i|Φt) are the probabilities of being in state i, taking into account all the information up to time t, that is based on the information set Φt:
f1(rt ) ⋅ P(s t = 1 | Φ t −1 ) f1(rt ) ⋅ P(s t = 1 | Φ t −1 ) + f2 (rt ) ⋅ P(s t = 2 | Φ t −1 ) and P(s t = 2 | Φ t ) = 1 − P(s t = 1 | Φ t )
P(s t = 1 | Φ t ) = (4)
where fi(rt)=f(rt|st=i), i∈{1,2} are the densities of the return distribution, conditional on the state variable st. The ex-ante probabilities P(st+1=i|Φt), are the probabilities of being in regime i in the next period, based on today’s information Φt: 2
P(s t +1 = 1 | Φ t ) = ∑ P(s t = i | Φ t ) ⋅ pi1 i =1
(5)
and
P(s t +1 = 2 | Φ t ) = 1 − P(s t +1 = 1 | Φ t )
Both series of probabilities are estimated recursively when calculating the likelihood function of the model. In contrast, the smoothed probabilities P(st=i | ΦT), based upon all information on its entire dataset, require an additional filter procedure. Alternative filters have been provided by Hamilton (1989), Diebold, Lee and Weinbach (1994), Kim (1994) and Gray (1996). For our calculations we shall use the filter by Kim (1994).2 Major differences between different regime switching GARCH models follow the specification of the variance process, i.e. the conditional variance σt2=Var(εt|st). It is a good starting point to consider the conditional variance along the lines of Bollerslev’s (1986) original GARCH model: (6)
σ t, = ωst + α st ε t −1 + β st σ t −1 2
2
2
The coefficients ωs t , α s t and β s t correspond to respective coefficients in the
one-regime GARCH model, but may differ depending on the present state. In equation (6) the term εt-12 can be easily calculated as: 2
A detailed description of the filter can also be found in Kim and Nelson (1999), chapter 4.3.1.
where Φt is again the set of available information at time t. In contrast to εt-12 the term σt-12 in equation (6) requires additional observances. When calculating σt-12 problems arise due to its path-dependence (Cai, 1994; Hamilton and Susmel, 1994; Gray, 1996; Klaassen, 2002): The present conditional variance σt2 depends not only on εt-12 and σt-12, but also through σt-12 on εt-22 and σt-22 and so forth. As σ12 to σt2 are also influenced by the respective value of st, today’s conditional variance σt2 depends on the whole path of the state process s1,..,st and the number of possible paths grow exponentially in t. Even on shorter series it is not convenient to integrate all the paths. This problem will not occur if the term β st σ t −1 is abandoned, so in case the 2
model reflects a pure ARCH model, or if there will be just the last few days taken into consideration (Cai, 1994; Hamilton and Susmel, 1994). Another, more appealing approach proposed by Gray (1996) is to follow the Markov switching model as a mixture of distributions and use in equation (6) the expected volatility, based upon the ex-ante probabilities P(st-2| Φt-2), rather than the actual volatility. This leads to:
= P(s t −1 = 1 | Φ t − 2 ) ⋅ (µ1 + σ1,t −1 ) + P(s t −1 = 2 | Φ t − 2 ) ⋅ (µ 2 + σ2,t −1 ) 2
(8)
2
2
2
− {P(s t −1 = 1 | Φ t − 2 ) ⋅ µ1 + P(st −1 = 2 | Φ t − 2 ) ⋅ µ 2 }
2
Furthermore, Klaassen (2002) suggests to replace the ex-ante probability in equation (8) by the filter probability to use as much information as possible for estimation. In this case equation 8 emerges to: σt −1 = P(st −1 = 1 | Φ t −1) ⋅ (µ1 + σ1,t −1 ) + P(st −1 = 2 | Φ t −1) ⋅ (µ 2 + σ2,t −1 ) 2
We model the conditional distribution of the error term as t-distribution, which is quite popular in the traditional single-regime GARCH literature (see, for instance, Bollerslev, Chou and Kroner, 1992), but has been less widely used in the regime switching GARCH context so far (Klaassen, 2002). The fatter tails of the t-distribution (in comparison to the normal distribution) significantly improves the ability of the model to distinguish the different regimes (Klaassen, 2002): E.g. in the low volatility regime a single large innovation does not cause the model to switch to the high volatility regime and the estimated regimes become much more stable. Hence, the distribution of the returns take the following form: f1(rt ) = t ν ,µ ,σ 2 (rt ), if st = 1 1 1 1,t f (rt ) = f2 (rt ) = t ν 2 ,µ 2 ,σ2,t 2 (rt ), if s t = 2
(10)
P(st = j | st-1 = i) = pij , für i,j ∈ {1,2} where t
ν i ,µ
1 , σ 1, t
2
( r t ) is the probability density function of the decentralised t-
distribution with degrees of freedom νi, mean µi and variance σi,t2 for the regimes i∈{1,2}. Calculating and maximising the log likelihood function is performed using GAUSS (Vers. 3.5). To ensure ergodicity of the Markov process the transition probabilities p11 and p22 are constrained to the interval [0,001; 0,999]. This is necessary as during the comparatively short sample the process might not return after a regime switch. Indeed, in section 4 some of the estimated transition probabilities are close to 0.999.
3
The Transition from EMS to EMU
On January 1, 1999 the EMS ceased to work. The former members of the European Monetary System (EMS) have either formed the at that time established European Monetary Union (EMU), or have become member of the EMS II. 3 Whilst the launch of EMU was already under preparation, there still had been no decision regarding the future members. At the informal ECOFIN meeting in Mondorf-Le-Bains (Luxembourg) on September 13 and 14, 1997 it was only agreed to appoint the members of the EMU and to fix the parities for the entry in May 1998. 3
All member countries except Denmark and Greece have joined the EMU. Greece has joined the EMU in 2000. So Denmark and the Euro system have been the only members of the EMS II until Estonia, Lithuania and Slovenia joined on June 28, 2004.
7
Whereas the degree of uncertainty about the parities was low4, there was no consensus about the member countries. Austria, Belgium, France, Germany, Luxembourg and the Netherlands were assumed to be the most likely members of the EMU. It was also known that Denmark, Greece, Sweden and the United Kingdom would not (initially) join the EMU. The remaining countries (Finland, Ireland, Italy, Portugal and Spain) have continually given rise to speculations about their entry. The final decision about the members has been taken at the council of the EU on May, 2 and 3, 1998 in Brussels and followed the advice given by the European Monetary Institute (EMI) in their convergence report dated from March 25, 1998. The EMI recommended Austria, Belgium, Germany, Finland, France, Ireland, Italy, Luxembourg, the Netherlands, Portugal and Spain. Hence, ten currencies ceased to exist and were transformed to the Euro5. At the same time the parity between these currencies and the Euro was determined. As mentioned above expectations of market participants regarding the member countries were heterogeneous. Therefore one should expect this heterogeneity to be reflected in the volatility of the exchange rate. As the Deutsche mark was assumed to be surely a member of the future EMU, it is straightforward to use it as a reference currency. Additionally this approach takes into account that on May 2/3, 1998, only bilateral conversion rates between the participating currencies have been layed down, because the value of the Euro should not differ from the Ecu’s value on December 31, 1998 (European Union, 1998). One should now assume that the volatility of a currency against the Deutsche mark will decline, as soon as it is commonly accepted as a future member of the EMU. And the less surprising the membership is, that is the faster market participants are convinced about the currency joining EMU, the faster volatility will decline. It is therefore straightforward to use the ex-ante probability P(st=i | Φt-1) as a proxy for market expectation, because it incorporates all the available information from the past, and looks forward at the same time. This leads to the conclusion that the estimation results from the MS-GARCH model should exhibit the following pattern: The probability P(st=1 | Φt-1) of being in the high volatility regime (for the sake of simplicity we will refer to this regime as regime 1) should be close to one at the beginning of the sample. This reflects the initial uncertainty about joining EMU. As soon as the uncertainty declines, the probability of being in regime 1 will, too. If the currency is accepted as a future member of EMU the probability should be close to 4 5
It was commonly assumed that they would equal the central rates of the currencies against the ECU on December 31, 1998 (Deutsche Bundesbank, 1997, pp 10). The governments of Belgium and Luxembourg had fixed exchange parity (1:1) between the Luxembourg franc and the Belgian franc since 1922 with some interceptions in a monetary association.
8
zero. According to this consideration the following cases are possible (see for theoretical considerations De Grauwe, 1996; Wilfling, 1999; De Grauwe, Dewachter and Veestraeten, 1999; an empirical analysis can also be found in Wilfling, 2001, 2002; Wilfling and Männig, 2001): •
Uncertainty is high in the beginning and disappears when the members of EMU are officially announced at the Brussels meeting of the council, 1998: P(st=1 | Φt-1) initially equals 1 and declines to zero immediately after May, 2/3, 1998.
•
Uncertainty is high in the beginning, after the Brussels meeting market participants are still not certain about membership: P(st=1 | Φt-1) initially equals 1, after May 2/3, 1998, it still does not steadily decline to zero, but may fluctuate between zero and one, depending on the state of the discussion. It should then finally decline to zero little time before EMU is launched.
•
Uncertainty is high in the beginning, but market participants are convinced that the currency will take part in the EMU even prior to the official announcement: P(st=1 | Φt-1) initially equals 1, but declines closer to zero prior to the Brussels meeting.
Therefore the following tasks remain: First, it should be possible to assign the currencies to one of the cases described above. Second, the question arises whether it is possible to determine the (more or less) exact date, from which market participants have accepted the countries as future members of EMU. In particular it is interesting to see, whether one of the above mentioned events (the meetings in Mondorf-Le-Bains and Brussels, and the publication of the convergence report by the EMI) was regarded as decisive by the market.
4
Data and Estimation Results
We will rely on those countries which have been regarded as possible certain members of EMU, but neglect those who were treated as the core of the future EMU (Austria, Belgium/Luxembourg, France, Germany and the Netherlands). There was little doubt on their participation in EMU6 (Dale, 1998, S. 11). Additionally we do not 6
Only Belgium might have been regarded as problematic, as public debt was about 120 per cent of GDP, which stood in contradiction to the convergence criteria. However, Belgium has never been subject to a public discussion (Melloan, 1997, p 17). There was fast progress in consolidation, Belgium has always been a precursor for European integration (Belgium is one of the founder members of the European Communities) and has been participating in the EMS since its start back in 1979. Furthermore its geographical position, surrounded by the definite members of EMU France, Germany, Luxembourg and the Netherlands could have created a difficult situation for Belgium. Finally, Belgium formed a monetary association with Luxembourg.
9
consider the currencies which would definitely not initially join EMU (Denmark, Greece, Sweden and the United Kingdom)7. The remaining countries are Finland (Finnish markka: FIM), Ireland (Irish pound: IEP), Italy (Italian lira: ITL), Portugal (Portuguese escudo: PTE) and Spain (Spanish peseta: ESP). The sample of daily exchange rates covers the period from January 1, 1996 and December 31, 1998, the last day before EMU has started. The data was received from the Federal Reserve Bank’s H10 database and the exchange rates against the Deutsche mark have been calculated as cross rates. The results for a single regime GARCH model and a MS-GARCH model are given in Table 1. The persistence of a volatility shock is given by the sum of the coefficients α and β. The higher α+β is, the more time it takes until a shock has died out. It will die out in finite time, if α+β is smaller than 1, as soon as it exceeds 1 a volatility shock has permanent impact and unconditional volatility is infinity. Table 1 shows that for three out of five currencies (the Finnish markka, the Irish punt and the Italian lira) α+β exceeds one, implying that volatility is explosive. Any shock in volatility is then permanent and will not die out. This implausible result may be due to a structural break in the variance process (Klaassen, 2002) as explained in section 1. Even for the Portuguese escudo and the Spanish peseta α+β is very close to one. The results are clearly in favour of a non-considered structural break, and it is most likely that this is the announcement effect of EMU membership. In contrast, for the MS-GARCH model the sum α+β is always between 0.292 (Portuguese escudo, regime 2) und 0.999 (Spanish peseta, regime 1). It never exceeds 1. Generally volatility persistence is higher in the high volatility regime 1 than in the low volatility regime 2, that is the higher volatility in regime 1 is partly driven by a high degree of volatility persistence. This observation is in line with recent empirical studies (Chaudhuri and Klaassen, 2002; Klaassen, 2002; Wilfling, 2002), which allow – in contrast to older studies (Cai, 1994; Hamilton and Susmel, 1994) – independent GARCH coefficients in both regimes. The results support the view by Klaassen (2002), who argues that the high persistence of volatility shocks in single-regime GARCH models is due to neglecting of regime changes, that is the model is misspecified.
7
In accordance with Protocol No. 12 of the Treaty establishing the European Community Denmark and the United Kingdom had decided not to participate in EMU, whereas Greece and Sweden had not been participating in the ERM of the EMS (Greece joined in March 1998) and therefore obviously would not qualify for EMU.
10
TAB. 1:
Results of GARCH and MS-GARCH estimations for EMU accession countries (1/1/1996 to 31/12/1998)
ESP Single regime GARCH -0.001 µ
FIM
IEP
ITL
PTE
-0.001
-0.003
-0.001
-0.001
ω α β
4.30E-06 0.036*** 0.958***
1.5E-05 0.158*** 0.869***
1.4E-05 0.125*** 0.894***
5.9E-06 0.159*** 0.865***
7.0E-06 0.068*** 0.929***
α+β
0.994
1.027
1.019
1.024
0.997
ν
3.979***
3.869***
3.867***
4.284***
9.829***
-0.002
0.029***
-0.002
0.005
MS GARCH
Regime 1 (high volatility) 0.003 µ1 ω1 α1 β1
0.002 0.241*** 0.758***
0.041*** 0.243*** 0.699***
0.070 0.138 0.619**
0.034 0.269*** 0.664***
0.002* 0.119** 0.809***
α1+β1 volatility
0.999 2.032
0.942 0.283
0.757 0.291
0.933 0.516
0.928 0.027
ν1
3.024***
3.040***
3.169***
3.038***
3.964***
-0.001
-0.006***
-0.003
-0.002
Regime 2 (low volatility) -0.002 µ2 ω2 α2 β2
0.001 0.413 0.322*
0.001 0.295*** 0.264***
0.001 0.184*** 0.546
0.001 0.470 0.377
0.001 0.092 0.200*
α2+β2 volatility
0.735 0.004
0.559 0.002
0.730 0.005
0.847 0.007
0.292 0.001
ν2
2.304***
2.908***
3.044***
2.880***
3.334***
p11
0.998***
0.998***
0.997***
0.999***
0.998***
p22
0.999***
0.999***
0.999***
0.999***
0.999***
Asterisks refer to the level of significance, ***: 1 per cent, **: 5 per cent, *: 10 percent; Single regime GARCH model: rt
= µ + εt;εt ~ t
ν,µ,σ t 2
(rt ); σ t 2 = ω + α ⋅ ε t −12 + β ⋅ σ t −12
MS-GARCH-Model according to the description in the main text.. Volatility: ω/(1-α-β) [for the MS-GARCH-model separate calculation for each of the regimes]
11
Moreover the choice of the t-distribution for the error terms is justified by the fact that all estimated degrees of freedom, for the single-regime GARCH (except for the Italian lira with ν=9.829) as well as for the MS-GARCH model, are comparatively small. For the MS-GARCH model they are between ν2=2.304 for the Spanish peseta and ν1= 3.964 for the Portuguese escudo. These values imply a distribution with finite variance (as all degrees of freedom exceed 2) but much higher kurtosis compared with the normal distribution8. Another important feature of the estimation is the high persistence of the regimes: the transition probabilities p11 and p22 are close to 1 and never smaller than 0.997. This high regime persistence, which is also visible in Figure 1 showing the smoothed probabilities P(st | ΦT), is due to the choice of the t-distribution as conditional distribution for the error term (Klaassen, 2002).9 The reduction of volatility is also shown in Figure 2, which shows the exchange rate return and the expected volatility conditional on the time t. It is clearly visible that volatility has declined prior to the start of EMU. The time of the regime shift has always taken place between the meetings in Mondorf-Le-Bains (September, 13/14, 1997, the left vertical line) and in Brussels (May, 2/3, 1998, the right vertical line). As the meeting in Brussels announced its members, this result could have been expected surely, as there were no uncertainty left afterwards. It is however interesting that the process switched to the low volatility state several months ago. According to the observances in Section 3 and prior to the official announcement, market participants would have accepted those currencies as future members of EMU but the question remains which date or event has led to the change in market opinion. To consider the regime change in more detail it is convenient to rely on the smoothed probabilities, which is, however, linked to the expected conditional volatility by construction. Accordingly, we refer to a (final) change in regime, when the smoothed probability ultimately falls below 0.5. This change takes place prior to the Brussels meeting for all currencies.10 This regime switch occurs remarkably early for the Italian lira. This is unexpected as there have been provisos against a participation of Italy for a long time: Back in April 1998 a few weeks prior to the EMI's convergence report (NZZ, 1998), the government of the Netherlands has regarded an Italian membership as critical. This public discussion, however, only caused a slight in8 9
10
The t-distribution can be approximated with the normal distribution for much higher degrees of freedom (Greene, 2000, p 68). See Section 2. We have done all estimations for normal distributed error terms, too. This leads to less stable regimes and less pronounced overall results. The estimation output is not given here, but available from the authors on request. In contrast, Wilfling (2002) investigates the French franc, the Finnish markka, the Italian lira and the Portuguese escudo and discovers that the smoothed probabilities exceed 0.5 even after the Brussels meeting. He argues that these up- and downturns „may at least in parts be viewed as a consequence of general doubts about whether Stage III would be implemented at all“ (p 22).
12
crease of no more than 30 per cent in the ex-ante probability of the high volatility regime. The early switch to the low volatility regime seems to have happened due to the insight that Italy would become a member of the EMU for political reasons11. For the other currencies uncertainty seems to have lasted longer: for the Finnish markka and the Portuguese escudo the regime switch took place in January 1998, when the period for fulfilling the Maastricht convergence criteria ended, which were used to assess the ability of each country to join EMU.12 For the Spanish peseta and the Irish punt, the ex-ante probability was very volatile, even after January 1998 , but while uncertainty lasted only slightly longer for Spain (February), volatility declined for the Irish punt not before early May, when the final participants in EMU were announced. This is plausible, as the EMI states in its convergence report that there are “imperfections, which will not jeopardise the overall functioning of the ESCB at the start of Stage three.” (EMI, 1998, p 27). Furthermore the Irish punt was the only currency which had been subject to realignment prior to EMU and appreciated for 3% effective from 16 March 1998. Although an appreciation with the convergence criteria was agreed, the exchange rate was characterized by high volatility against the Deutsche mark (EMI, 1998, p 9). Summarizing, the pure announcement of the monetary union has not reduced uncertainty, approximated by exchange rate volatility. Before the EMI convergence report was published on May 25, 1998, uncertainty was already removed from the foreign exchange market, even though a "circle of members as large as possible" (Schieber, 1998, p 4) was likely.
11
12
Massimo Russo, at that time special advisor to the Managing Director of the International Monetary Fund, stated in April 1997 regarding the case of Italy: "The problem has been studied very well. It is a question of political will." (IMF, 1997). Actually the period ended between January (price stability) and February (exchange rates). The convergence criteria are (see EMI, 1998): • Criterion of price stability: below the reference value (unweighed average of the inflation rates in the three countries with the lowest inflation rates plus 1.5 percentage points). • Government budgetary position criterion: fiscal deficit below the reference value of 3 per cent of GDP and debt-to-GDP ratio below 60 per cent. • Exchange rate criterion: normal trading in the ERM during two years, without devaluation of the central rate. • Long-term interest rate criterion below the reference value (unweighed average of the long-term interest rates in the three countries with the lowest inflation rates plus 2 percentage points).
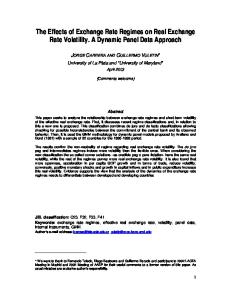
ABB. 1:Ex-ante- und smoothed probabilities for EMU accession countries
ITL/DEM
1
0,8
0,6
0,4
0,2
0
PTE/DEM
The bold lines are the smoothed probabilities P(st=1 | ΦT), the dotted lines reflect the ex-ante probabilities P(st=1 | Φt-1) of being in the high volatility regime 1. The vertical lines represent the ECOFIN meeting in Mondorf-Le-Bains (Luxembourg) on September 13/14, 1997, the publication of the EMI convergence report on March 25, 1998, and the meeting of the EU council in Brussels on May 2/3, 1998.
The bold lines are the smoothed probabilities P(st=1 | ΦT), the dotted lines reflect the ex-ante probabilities P(st=1 | Φt-1) of being in the high volatility regime 1. The vertical lines represent the ECOFIN meeting in Mondorf-Le-Bains (Luxembourg) on September 13/14, 1997, the publication of the EMI convergence report on March 25, 1998, and the meeting of the EU council in Brussels on May 2/3, 1998.
15
Therefore the EMI convergence report, giving the advice to launch EMU with Austria, Belgium, Finland, France, Germany, Ireland, Italy, Luxembourg, the Netherlands, Portugal and Spain was the de facto declaration of the member countries, whereas the Brussels meeting turns out to have only borne the formal, de ju re announcement. However, for most of the future members uncertainty was fairly low even before the convergence report was published. For Italy, Finland and Portugal the switch to the low volatility regime occurred at the year's end 1997/1998, for Spain just marginally later. Furthermore, there seems to have been little uncertainty about the timely start of EMU after the convergence report, as the probability of the high volatility regime remains steadily and close to zero. Finally, it must be stated that exchange rate volatility is only one indicator for uncertainty, which has been affected by other determinants besides the introduction of the Euro. Therefore all results have to be considered precautionary, but seem to be reasonable at the same time.
5
Conclusions
The analysis shows that not only the official announcement, but also market expectations may affect changes in uncertainty and volatility in the environment of a changing exchange rate arrangement. For the future members of EMU which were not regarded as definite starting members such as Finland, Ireland, Italy, Portugal and Spain, the results show an early decline of volatility. An intermediate period of frequent switches between the high and the low volatility regime can be interpreted as changes in market expectations. Reduction of volatility starts with the meeting in Mondorf-Le-Bains in September 1997 (with the exception of Italy that started earlier) and ends clearly prior to the official announcement of the member countries in May 1997. The individual time of volatility switch for all currencies was outlined between January 1998, the date on which the data for the convergence report was created and successively published, and its release date in May 1998. Uncertainty lasted longest for Ireland and (less pronounced) Spain, for which the final regime switch occurred little time prior to and after the Brussels meeting. On the one hand the pure announcement of a new exchange rate arrangement affects volatility, on the other hand this will only occur, if the announcement is credible to market participants.
16
References
Andersen, Torben G. and Tim Bollerslev (1998), Answering the Skeptics: Yes, Standard Volatility Models Do Provide Accurate Forecasts, International Economic Review, 39, 885-905.
Bollerslev, Tim (1986), Generalized Autoregressive Conditional Heteroskedasticity, Journal of Econometrics, 31, 307-327.
Bollerslev, Tim, Ray Y. Chou and Kenneth F. Kroner (1992), ARCH Modeling in Finance: A Review of the Theory and Empirical Evidence, Journal of Econometrics, 52, 5-59.
Bollerslev, Tim, Robert F. Engle and Daniel B. Nelson (1994), ARCH Models, in: Handbook of Econometrics, Vol. 4, edited by Robert F. Engle and Daniel L.
McFadden, Amsterdam: North-Holland. Cai, Jun (1994), A Markov Model of Switching-Regime ARCH, Journal of Business & Economic Statistics, 12, 309-316.
Chaudhuri, Kausik and Franc Klaassen (2002), Have East Asian Stock Markets Calmed Down? Evidence from a Regime-Switching Model, Diskussionspapier,
University of Amsterdam. Dale, Reginald (1998), Europhobia: The Sceptics were Wrong, International Herald Tribune, 21.4.1998, printed in: Deutsche Bundesbank, Auszüge aus Presseartikeln, No. 26, 24.4.1998, S. 11. De Grauwe, Paul (1996), How to Fix Conversion rates at the Start of EMU, Centre for Economic Policy Research Discussion Paper, No. 1530.
De Grauwe, Paul, Hans Dewachter and Dirk Veestraeten (1999), Price Dynamics under Stochastic Process Switching: Some Extensions and an Application to EMU, Journal of International Money and Finance, 18, 195-224. Deutsche Bundesbank (1997), Auszüge aus Presseartikeln, No. 52, 18. September. Diebold, Francis X., J.-H. Lee and Gretchen Weinbach (1994), Regime Switching With Time-Varying Transition Probabilities, in: Nonstationary Time Series Analysis and Cointegration, edited by C. Hargreaves, Oxford: Oxford Univer-
sity Press, 283-302.
17
Engle, Robert F. (1982), Autoregressive Conditional Heteroscedasticity with Estimates on the Variance of UK Inflation, Econometrica, 50, 987-1007. European Monetary Institute (1998), Convergence Report: Report required by Article 109j of the Treaty establishing the European Community , Frankfurt/Main.
European Union (1998), Joint Communiqué on the Determination of the Irrevocable Conversion rates for the Euro, Printed in: Deutsche Bundesbank, Auszüge
aus Presseartikeln, No. 28, 6.3.1998, 4-5. Franses, Philip Hans and Dick van Dijk (2000), Non-Linear Time Series Models in Empirical Finance, Cambridge et al.: Cambridge University Press.
Gray, Stephen F. (1996), Modelling the Conditional Distribution of Interest Rates as a Regime-Switching Process, Journal of Financial Economics, 42, 27-62. Greene, William H. (2000), Econometric Analysis, 4. Auflage, New Jersey: Prentice Hall. Hamilton, James D. (1989), A New Approach to the Economic Analysis of Nonstationary Time-Series and the Business Cycle, Econometrica, 57, 357-384. Hamilton, James D. and Raul Susmel (1994), Autoregressive Conditional Heteroskedasticity and Changes in Regime, Journal of Econometrics, 64, 307333. IMF [International Monetary Fund] (1997), Press Briefing on the European Monetary Union April 26, 11:00 a.m. Kim, Chang-Jin (1994), Dynamic Linear Models with Markov-Switching, Journal of Econometrics, 60, 1-22.
Kim, Chang-Jin and Charles R. Nelson (1999), State Space Models with Regime Switching, Classical and Gibbs-Sampling Approaches with Applications, Cam-
bridge, Massachusetts: MIT Press. Klaassen, Frank (2002), Improving GARCH Volatility Forecasts with Regimeswitching GARCH, Empirical Economics, 27, 363-394. Lamoureux CG and WD Lastrapes (1990), Persistence in Variance, Structural Change and the GARCH Model, Journal of Business and Economics Statistics, 8, 225-234.
18
Melloan, George (1997), How Do You Qualify for the Euro Club? By Cheating, The Wall Street Journal Europe vom 28.1.1997, printed in: Deutsche Bundesbank, Auszüge aus Presseartikeln, Nr. 6, 29.1.1997, S. 16-17. NZZ [Neue Züricher Zeitung] (1998), Haager Vorbehalt gegen Italiens EuroTeilnahme, 17.4.1998, printed in: Deutsche Bundesbank, Auszüge aus Pres-
seartikeln, Nr. 25, 21.4.1998, S. 18. Poon, Ser-Huang and Clive Granger (2003), Forecasting Volatility in Financial Markets – A Review, Journal of Economic Literature, 41, 478-539. Schieber, Helmut (1998), Die weiteren Vorarbeiten und der Stand der Vorbereitungen zur EWU, talk at the 9th European Workshop of the Börsenzeitung, Frankfurt/Main, January 29, 1998, printed in: Deutsche Bundesbank, Auszüge aus Presseartikeln, Nr. 7, 2.2.1998, S. 2-6. Timmermann, Allan (2000), Moments of Markov Switching Models, Journal of Econometrics, 96, 75-111.
Wilfling, Bernd (1999), Wechselkursdynamik im Vorfeld einer Währungsunion, Jahrbücher für Nationalökonomie und Statistik, 218, 23-44
Wilfling, Bernd (2001), Wechselkursdynamik und Zinsentwicklung vor Regimewechseln des Währungssystems, Baden Baden: Nomos.
Wilfling, Bernd (2002), Foreign exchange markets' perceptions of EMU participation by Finland, France, Italy, and Portugal. SSRN Presentations Journal of the 29th Annual Meeting (2002) of the European Finance Association (EFA) in Berlin.
Wilfling, Bernd and Wolfgang Männig (2001), Exchange Rate Dynamics in Anticipation of Time Contingent Regime Switching: Modelling the Effects of a Possible Delay, Journal of International Money and Finance, 20, 91-113.