INNOVATIONS FOR FINANCING WILDLIFE CONSERVATION IN KENYA Paper prepared for Financial Innovations for Biodiversity Workshop 10th Global Biodiversity Forum, Bratislava, 1-3 May 1998 Lucy Emerton, Biodiversity Economist, IUCN EARO, PO Box 68200, Nairobi, Kenya
INTRODUCTION Economic pressures threaten Kenya’s wildlife resources. Over recent years both the number and diversity of wildlife have declined, largely as a result of the conversion of natural habitat to agriculture and poaching of commercially valuable species. Since 1970 Kenya has lost nearly half of its mammal fauna (Norton-Griffiths 1998), including a decline in elephant and rhino populations of 85% and 97% respectively (Mugabe and Wandera 1995). There has been little money available to fund government operations in the wildlife sector. Landholders in wildlife areas have been unable to legitimately benefit from the wildlife on their lands. Wildlife has failed to generate sufficient financial gains to offset the costs that its conservation incurs, either for the public sector or for private and community landholders. For wildlife to be conserved in Kenya there is a clear need both to increase overall sector revenues and to raise the degree to which wildlife benefits accrue to the groups who are responsible for its conservation − primarily the government Kenya Wildlife Service (KWS) who manage the national wildlife estate and the individuals and groups who manage the private and communal lands on which wildlife is also found. This paper describes a range of financial innovations which are being developed in Kenya with the aim of raising and allocating public revenues and private profits in order to ensure that wildlife is better conserved.
THE ECONOMIC VALUE OF KENYA’S WILDLIFE Wildlife benefits Wildlife has a high value to both the Kenyan national economy and the global community, as reflected in the benefits generated by wildlife tourism. Economic benefits of wildlife tourism In 1996 over 1 million visitor days were spent in Kenya’s National Parks and wildlife-based tourism GLOBAL WILDLIFE TOURISM VALUES US$ 250 million generated gross returns of about US$ 350 million, comprising a net economic gain of US$ 27 million and KENYA’S ELEPHANTS contributing 5% of Kenya’s GDP, a tenth of formal US$ 75-100 million employment opportunities and over a third of total AMBOSELI LIONS foreign exchange earnings (Emerton 1997). Overall US$ 0.5 million each Kenya’s wildlife protected areas have been estimated LAKE NAKURU NATIONAL PARK US$ 7-15 million to have a global value of some US$ 250 million a year MAASAI MARA NATIONAL RESERVE (Moran 1994). ‘Charismatic’ species and areas US$ 85 million comprise a high proportion of this value. For example two of the most popular of Kenya’s protected areas, the Maasai Mara National Reserve and Lake Nakuru NATIONAL WILDLIFE TOURISM VALUES National Park, have a value to international tourists of US$ 27 million net gain some US$ 85 million (Norton-Griffiths 1995) and US$ 5% of GDP 7-15 million (Navrud and Mungatana 1994) 10% of employment >1/3 of foreign exchange respectively. In Amboseli National Park each lion may
L. Emerton, IUCN Eastern Africa Regional Office: Innovations for Financing Wildlife Conservation in Kenya Paper prepared for Financial Innovations for Biodiversity Workshop, 10th Global Biodiversity Forum, Bratislava, 1-3 May 1998
have an annual tourist viewing value worth some US$ 0.5 million at current prices (Thresher 1981), and Kenya’s elephants are estimated to generate an international consumer surplus of US$ 75-100 million a year (Brown and Henry 1989).
Wildlife costs Wildlife does not generate a flow of pure economic benefits to Kenya. It also gives rise to significant public and private costs. The costs of Economic costs of wildlife to Kenya wildlife conservation to the Kenyan government are considerable − direct expenditures required to manage the national wildlife estate are in excess of US$ 25 million. The economic costs imposed by MANAGEMENT COSTS TO COSTS TO OPPORTUNITY COSTS LIVESTOCK CROPS COSTS wildlife on landholders are even higher and more wide-ranging. Wildlife-related losses to agricultural enterprises encompasses wild animal damage to > US$ 25 million US$ 104/km 35-45% of US$ 200 million crops − which can rise to 35-45% of total production farm costs costs in wildlife areas (Norton-Griffiths 1997), and transmission of disease, competition over pasture and kills of domestic livestock herds − estimated to lead to costs of some US$ 104/km2 (Mwangi 1995). In total, the opportunity costs of wildlife conservation to the Kenyan national economy − the alternative land and resource use opportunities precluded by maintaining wildlife populations − are substantial at over US$ 200 million a year (Norton-Griffiths and Southey 1995). 2
Financial implications of wildlife
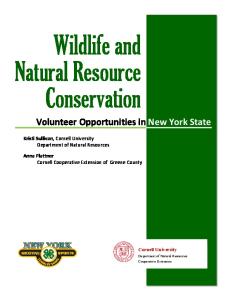
Financing needs Despite its high national and international economic value, Kenya’s wildlife has to date failed to generate sufficient financial returns to cover its costs. This has resulted in a situation where government faces an increasing funding gap and rural landholders are being made progressively worse off by the presence of wildlife (Emerton 1997). For example KWS’s operating deficit has been increasing in real terms over the 1990s, landholders bear a continuing cost from wildliferelated damage to agricutlural activities, and studies carried out around Kenya’s two most popular National Parks in the late 1980s showed that less than 1% of all tourist revenues accrued to local landholders in the late 1980s (Emerton 1998). This unequal distribution of benefits and costs lies at the root of the wildlife loss which has occurred in Kenya over recent decades. Whereas the costs of wildlife accrue as real financial expenditures and losses within Kenya, the economic benefits of wildlife are far less tangible and mainly accrue at
KWS Internal Funding Gap
1989 1991 1992 1993 1994 1995 1996 0
100
200 300 400 1997 KSh million
500
(From: Deloitte Touche 1995, KWS data) Landholders