IJMT
August 2013
Volume 3, Issue 8
ISSN: 2249-1058
__________________________________________________________ BUSINESS PROCESSES OPTIMIZATION POSSIBILITIES Elizabeta Mitreva, Ph.D Nako Tashkov, Ph.D* Oliver Filiposki, MA* Tatjana Dzaleva, MA* Abstract In this paper we propose a model and opportunities for better performance, greater efficiency and effectiveness of companies, through optimization of the business processes, change of corporate culture and manners of taking full advantage of the business potential. The benefits of implementation of this model not only increase business results of companies and will continue to serve as the driving force for a continuous improvement, but also increasing the commitment of the top management and the employees to improve the processes, customer satisfaction, employees, shareholders, providers and the community. The application of the TQM (Total Quality Management) strategy within the implementation of the model for quality care comes from the production and extends to all aspects of the organization of the company. Thus, the quality gets a new dimension, not only quality products, but also quality operation and organization of the work.
Keywords: model, optimize business processes, TQM strategy, costs, quality care.
Faculty of Tourism and Business Logistics, Goce Delcev University, Shtip, Macedonia
A Monthly Double-Blind Peer Reviewed Refereed Open Access International e-Journal - Included in the International Serial Directories Indexed & Listed at: Ulrich's Periodicals Directory ©, U.S.A., Open J-Gage, India as well as in Cabell’s Directories of Publishing Opportunities, U.S.A.
International Journal of Marketing and Technology http://www.ijmra.us 89
August 2013
IJMT
Volume 3, Issue 8
ISSN: 2249-1058
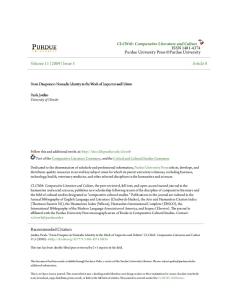
__________________________________________________________ Introduction The application of the TQM (Total Quality Management) strategy means improved quality by examination of the organizational processes, not only in terms of defining the process, improving the process and its design, but also improving the productivity and optimization the costs. Reports on the quality of products / services that are submitted to the management, refer to the discarded and defective materials and products. Very often, these essential data are rarely analyzed as costs. As a result, they rarely provide opportunities for cost savings. The cost of quality arises due to the existence or possible existence of poor quality. Analysis of quality costs can help managers increase their activities and to enhance the quality, but the analysis should be simple and practical, yet not too chaotic and administrative (Chepujnoska, Mitreva, 2008). The analysis of the cost of quality leads to numerous findings of poor quality, it creates an opportunity to act preventively and decrease the number of failures / delays / errors / cancellations. The costs of quality cannot be found in the traditional calculations of costs, but they are a gold mine and are of great value to a company (Crosby, 1989). The concept of quality costs is more than 30 years and is an essential part of the TQM strategy and managing them largely affect the profitability and growth of the company. They show that the quality is free, that teamwork maximizes the success and that it produces rapid improvements in quality. Measuring the cost of quality and their presentation has only one purpose, to take action to improve the quality. Traditional model of development of a given process The traditional management of processes is conducted without the possibility to optimize. The traditional management of a process involves monitoring of the parameters that determine the process using statistical process control (SPC). If the process parameters are outside the upper and the lower limits of deviation, corrective measures are taken to prevent further failures, and drawback claims. This cycle is known in the theory of the TQM as SDCA (Standard, Do, Control, Action). The executioner of the process usually can directly affect the cost of non-compliance and may suggest changes so that the final result can affect the cost of compliance. In Fig. 1 traditional model of development of a given process is displayed.
A Monthly Double-Blind Peer Reviewed Refereed Open Access International e-Journal - Included in the International Serial Directories Indexed & Listed at: Ulrich's Periodicals Directory ©, U.S.A., Open J-Gage, India as well as in Cabell’s Directories of Publishing Opportunities, U.S.A.
International Journal of Marketing and Technology http://www.ijmra.us 90
August 2013
IJMT
Volume 3, Issue 8
ISSN: 2249-1058
__________________________________________________________
Fig. 1: Traditional model of the business process The holder of the process by observing and monitoring makes changes in the process which will affect both segments of the treatment costs. Some processes are only due to conflicts elsewhere and such processes need to stop when the inconsistencies are removed. This method uses a standard operative procedure (SOP) for review, whether the product meets the defined specification or not. If there are discrepancies, intervene and return the ongoing process to the standard, while proactive management of business processes requires greater participation of the employees in identifying and resolving problems within the setting of standards and the efforts made to optimize the business processes and continuous improvement. Daily practice of each employee should not only be in control operations, but employees must be trained to act proactively, rather than to be occupied with detection, in order to get the power and responsibility to correct the mistakes and take out every problem with quality that is discovered. Design and implementation of a process model of cost management In the TQM culture, all business activities are related to processes. The process can be recognized at any level of the organization, for example, the process can be a particular stage of the operation, or it may be the entire process of running a business. In both cases, the process uses materials and resources, so that the cost model should present total cost of quality in every process. The design of the cost model process is essential to identify the inputs, outputs, process control, as well as the resources. The whole process starts with an analysis of the business organization, then continues through the analysis of the requirements of the internal and external customers and ends with a detailed definition of the process. Elements of procedural costs A Monthly Double-Blind Peer Reviewed Refereed Open Access International e-Journal - Included in the International Serial Directories Indexed & Listed at: Ulrich's Periodicals Directory ©, U.S.A., Open J-Gage, India as well as in Cabell’s Directories of Publishing Opportunities, U.S.A.
International Journal of Marketing and Technology http://www.ijmra.us 91
August 2013
IJMT
Volume 3, Issue 8
ISSN: 2249-1058
__________________________________________________________ Elements of the cost associated with the process can be classified into one of the following categories: people, equipment, materials, information and environment. Every single element of cost is needed to be identified as costs of compliance and / or non-compliance as well as a source of the information recorded.
1. Cost of Compliance (COC). Cost of execution of the process as provided in full effectiveness. This does not mean that the process is effective, nor necessary to us, but the process, is realized through the defined procedures that cannot be implemented at a lower cost. This is the minimum cost of the process; 2. Second cost of non-compliance (CONC). Cost of inefficiency in a given process, i.e. overhead costs, materials and equipment incurred after unsatisfactory inputs had made errors, outputs and discarded other waste. These costs are considered as non-essential procedural costs.
Both areas offer opportunities for cost improvement
The cost of compliance indicate only the meeting of established standards. They do not show whether the process is effective or necessary, so they should be viewed as an opportunity to improve the overall cost. The successful operation of a company requires financial planning and control. It is recommended for the mistakes in the quality companies to be financially set. First it is necessary to take into account two important factors:
errors for any reason that shrink profits;
the quality control enforcement of preventive activities and evaluation cost money. Investing in prevention can significantly reduce the cost of internal and external errors, but it should be controlled. Further reduction of external complaints is important not only for cost savings, but also the image and morale of the company. Ideas for reducing the cost of quality can arise from any department in the company. The maximum employee participation in this activity can be achieved by promoting, initiating, consideration, respect and implementation of new ideas, quality workshops and more. Studies worldwide show that after introducing total quality management (TQM) the percent of the cost of quality in relation to the total sales revenue is drastically reduced. The proposal of corrective measures and implementation of quality circle keeps spinning. A Monthly Double-Blind Peer Reviewed Refereed Open Access International e-Journal - Included in the International Serial Directories Indexed & Listed at: Ulrich's Periodicals Directory ©, U.S.A., Open J-Gage, India as well as in Cabell’s Directories of Publishing Opportunities, U.S.A.
International Journal of Marketing and Technology http://www.ijmra.us 92
August 2013
IJMT
Volume 3, Issue 8
ISSN: 2249-1058
__________________________________________________________ The development of the process of design and implementation of the quality costs subsystem is represented through several steps: Step 1: Preparation of process cost model (planning). The cost model can be generated for any given process in the organization. It can be used for identification and monitoring of process costs within the individual areas of the organization, such as system recovery, the system of issuing work orders or process of adoption of new employees. Alternatively, it can be used to monitor the total cost, as part of an organization. The cost model is done by identifying all key activities that are monitored and distributed to the group costs of compliance (TU) or costs of noncompliance (TNU). The source of information should also be identified and associated with the finance function. Step 2: Selection of team members to analyze the cost of quality. It is recommended to establishing teams to improve the quality by reviewing specific processes and areas of the organization. These teams need help for preparation of the process cost model and the early work on stage, collecting and analyzing data, identifying which processes or stages to explore, and later in the monitoring phase, submitting report on the results. Step 3: Identify the process to be optimized. The process needs to be identified and isolated as discrete activities set to be named and to name or identify the owner of the process. Each of the output is to be determined for which user it is intended. In a general case the user will be the owner of some other processes too. It is necessary to identify entries in the process such information and materials, controls, people, equipment. Step 4: Identify the costs. Each process consists of a series of activities. These activities should be identified, recognized and established elements of the cost of compliance and non-compliance for each activity. Step 5: Report on costs. The company should adopt a single form to report costs. The report should contain a comprehensive list of costs of compliance and non-compliance and thereby cover the following:
identification of all inputs, outputs, controls and resources to the process under consideration;
whether to use real or synthetic costs;
what methods and techniques of calculation will be used;
what sources of data costs will be provided.
A Monthly Double-Blind Peer Reviewed Refereed Open Access International e-Journal - Included in the International Serial Directories Indexed & Listed at: Ulrich's Periodicals Directory ©, U.S.A., Open J-Gage, India as well as in Cabell’s Directories of Publishing Opportunities, U.S.A.
International Journal of Marketing and Technology http://www.ijmra.us 93
August 2013
IJMT
Volume 3, Issue 8
ISSN: 2249-1058
__________________________________________________________ Costs related data collection makes of collection and systematic accounting, processing and analyzing the Quality Manager, the Quality Assurance department or team set up to analyze the total cost, depending on the size and complexity of the company. The collected data can be provided by primary or derived data of measurement. Checking the reliability of the data collected should be as close as possible to their source. Recommendation is to talk to the service responsible for accounting for reviewing the list of elements and data sources. A good part of the desired data is made available in some form, although initially it did not seem so. There are no set rules for data sources, but it can be recommended the following:
analysis of payrolls;
reports on production costs;
reports on the disadvantage;
reports / permits for retreading or conclusion;
requirements for compensation of travel expenses;
data on the cost of products;
repairs onsite with customers, reports of replaced products and repair costs during the warranty;
entries for controlling and testing;
direct costs for late delivery;
reports of noncompliance. Data extracted from source documents is necessary to be moved in tables and encrypted for easier processing. Each department should report their expenses. After collecting all the data needed to display tabular prior arrangement - tabular report on the cost of quality. Step 6: Analysis of results is done by looking at the initial terms of the costs of compliance and non-compliance of the business process. The analysis of cost types and their ranking can be applied to various methods. By applying the Pareto method separated several key factors of a number, less important, affecting the cost of quality. Determining the possible causes for the cost of quality is being performed by using the Ishikava diagram (analysis of errors, analyzing the causes of errors). Activities within this practice are: A Monthly Double-Blind Peer Reviewed Refereed Open Access International e-Journal - Included in the International Serial Directories Indexed & Listed at: Ulrich's Periodicals Directory ©, U.S.A., Open J-Gage, India as well as in Cabell’s Directories of Publishing Opportunities, U.S.A.
International Journal of Marketing and Technology http://www.ijmra.us 94
August 2013
IJMT
Volume 3, Issue 8
ISSN: 2249-1058
__________________________________________________________
initial analysis;
interpreting the results and making preliminary conclusions;
additional measurements and analyzes if necessary;
preparation of results for presentation. Step 7: The process of proposing corrective measures. The program of activities to improve the quality should be planned on the basis of information and set priorities. The owner of the process is necessary to consider the proposed improvement measures, using teams or individuals and track the results in cost analysis. Reviewing the initial terms of the costs of compliance and non-compliance can be decided as a priority - changing the design process, or elimination of disadvantages. After achieving improvement, the ratio of TU and TNU can change. This change may take as long as other areas of expenditure do not offer major opportunities for improvement. In case you discover discrepancies, they are going to be considered as non-essential procedural costs and the interpretive process can directly affect the cost of noncompliance, as well as to suggest the owner of the process of change in the plan process, which can influence the costs of compliance. The function of the results of further research, we can take measures to improve the conduct of business processes, implementing changes based on experience or simply raising the eligibility process, if applicable measures are economically attractive. The way this is achieved grants positive impact on results. Conclusion The effects of procedural models cost is given by the business processes optimization model in the phase where planning to optimize the business process, thereby increasing efficiency, Fig. 2.
A Monthly Double-Blind Peer Reviewed Refereed Open Access International e-Journal - Included in the International Serial Directories Indexed & Listed at: Ulrich's Periodicals Directory ©, U.S.A., Open J-Gage, India as well as in Cabell’s Directories of Publishing Opportunities, U.S.A.
International Journal of Marketing and Technology http://www.ijmra.us 95
August 2013
IJMT
Volume 3, Issue 8
ISSN: 2249-1058
__________________________________________________________
Fig. 2: Business process optimization model There may be a need for linking traditional and process cost model quality, especially where costs are reported in the traditional way. In this case, it could be considered that the costs of compliance cover the costs of prevention and assessment increased by costs for basic processes, while the costs of noncompliance consist of suit errors. Efficient management processes can significantly increase profits, practice shows that additional resources are used to identify, reduce and control the cost of errors, defects, omissions, leading to improved quality of processes, products / services, increase profitability and market competitiveness, fig. 3.
Fig. 3. Quality costs improvement cycle A Monthly Double-Blind Peer Reviewed Refereed Open Access International e-Journal - Included in the International Serial Directories Indexed & Listed at: Ulrich's Periodicals Directory ©, U.S.A., Open J-Gage, India as well as in Cabell’s Directories of Publishing Opportunities, U.S.A.
International Journal of Marketing and Technology http://www.ijmra.us 96
IJMT
August 2013
Volume 3, Issue 8
ISSN: 2249-1058
__________________________________________________________ However, it cannot be expected unlimited resources such activities to be available, so it is necessary to return financial information, which will show whether the measures for improving the quality are justified and economically feasible. The suggested methodology is tested through the practice within some companies in Macedonia, all from different sectors, and have presented results that lead to the fact that the suggested methodology is certainly applicable. It should be emphasized that the assets from the introduction on this model cannot be visible immediately, but during a longer time period. Nevertheless, it should not be one of the reasons to resign from the starting initiative because quality comes as a long-term process. Literature
1.
Chepujnoska, V., Mitreva, E. (2008). Methodology for optimization of the quality costs, Економски развој, год. 10, бр.1 стр. 213, Скопје, стр. 45-57.
2.
Crosby, P. (1989). Kvaliteta je besplatna, Privredni vjesnik, Zagreb, str. 9.
3.
Carr, L., Tyson, T. (1992). Planning quality/cost expenditures, Management Accounting, October, 52-56.
4.
Chepujnoska,V., Chepujnoski, G. (1993). Fundamentals of quality management, Faculty of Economics, Skopje, p. 5-100.
5.
Dahlgaard, J., Kristensen, K. (1992). Quality costs and total quality management, Vol. 3, No. 3, 211–222.
6.
Juran, M. J. (1974). Quality control handbook, London: McGraw-Hill.
7.
Feigenbaum, A. (2002). The Power behind Consumer Buying and Productivity, Quality Progress, Vol. 35, No. 4, 49-50.
8.
Rao, A., Carr, L., Dambolena, I., Kopp, R., Martin, J., Rafii, F., Schlesinger, Ph. (1996). Total Quality Management: A cross-functional perspective, John Wiley and Sons.
9.
Oakland, S. J., Porter, L. (1994). Cases in Total Quality Management, Butterworth Heinemann, Oxford, pp.181.
A Monthly Double-Blind Peer Reviewed Refereed Open Access International e-Journal - Included in the International Serial Directories Indexed & Listed at: Ulrich's Periodicals Directory ©, U.S.A., Open J-Gage, India as well as in Cabell’s Directories of Publishing Opportunities, U.S.A.
International Journal of Marketing and Technology http://www.ijmra.us 97