How much do tariffs matter? Evidence from the customs union of Belarus, Kazakhstan and Russia Asel Isakova, Zsoka Koczan and Alexander Plekhanov
Summary This paper provides an empirical analysis of the early impact of the formation of the customs union of Belarus, Kazakhstan and Russia and associated changes in import schedules on the structure of imports of the three member countries. Trade creation effects appear to have been insignificant, except in trade between Russia and third countries where Russian tariffs decreased. At the same time the change in tariffs appears to have created some trade diversion, with a significantly negative impact on imports from China to Kazakhstan in particular and a significantly positive impact on imports from within the customs union to Kazakhstan. The magnitude of this effect is relatively small, however. The results suggest that the benefits of the new tariff policy per se to member countries are limited at best. Larger benefits could come from a gradual removal of non-tariff barriers. Keywords: customs union, imports, exports, tariffs, regional integration JEL Classification Number: F14, F15 Contact details: Alexander Plekhanov, European Bank for Reconstruction and Development, One Exchange Square, London, EC2A 2JN, UK. Email:
[email protected]. Zsoka Koczan is at the University of Cambridge; Asel Isakova and Alexander Plekhanov are at the European Bank for Reconstruction and Development.
The authors are grateful to Amat Adarov, Erik Berglöf, Marek Dabrowski, Ralph de Haas, Asset Irgaliyev, Oleg Karachun, Yevgeniya Korniyenko, Andrey Lipin, Mykhailo Oliinyk, Nienke Oomes, Alexander Pivovarsky, Helena Schweiger and Veronika Zavacka for valuable comments and suggestions. The working paper series has been produced to stimulate debate on the economic transformation of central and eastern Europe and the CIS. Views presented are those of the authors and not necessarily of the EBRD. Working Paper No. 154
Prepared in January 2013
1
1. Introduction In November 2009 Belarus, Kazakhstan and Russia agreed to establish a customs union with harmonised import tariffs. The new common tariff became effective on 1 January 2010, and internal border controls have been subsequently removed. The common external customs tariff (CET) is mainly based on the Russian duties prevailing at the time. However, its introduction resulted in changes to the import tariff structure in each country, predominantly upwards, although a large number of tariffs were also adjusted downwards, in particular in Russia. Kazakhstan’s schedule underwent the most significant changes, which affected more than half of the tariff lines. Since Russia’s earlier tariffs were the highest among the three countries there have been significant duty hikes on a number of sensitive products in Belarus and Kazakhstan.1 Further integration within the framework of the Common Economic Space is foreseen, with the ultimate goal of achieving free movement of goods, capital and labour. New members, notably the Kyrgyz Republic, have been invited to join. At the same time, as the common tariff was worked out in the crisis environment of 2009, it was also used in part to promote import substitution in certain areas through increases in tariffs. For example, industrial policy motivation for changes in tariffs was pronounced in the automotive sector. Since the launch of the customs union, trade between the three countries has been growing rapidly. Since 2009 overall trade among the three countries increased by over a quarter by the end of 2010, and by two-thirds by the end of 2011. Trade turnover with the partners in the customs union has increased for each country as well. For instance, Kazakhstan’s turnover (export plus import) with Russia and Belarus has grown by almost 80 per cent between 2009 and 2011. Most of this increase, however, reflected post-crisis recovery trends (trade turnover was only 12 per cent higher in 2011 than in 2008). Did tariff policy nonetheless play a role? In general, tariffs are imposed to constrain the volume of imports by increasing their cost to domestic consumers. Therefore, all other things equal, the higher the tariff barriers, the more trade should fall. We aim to examine the extent to which tariffs have this effect in practice by relying on an (almost) natural experiment of changes in the tariffs of a large number of goods as the results of the formation of the customs union. We believe that the setting of the recently formed customs union is particularly suitable to assess the impacts of such changes as (at least for Kazakhstan and to a lesser extent for Belarus) it circumvents the identification problem due to the endogeneity of tariffs. Importantly, the customs union was agreed on 27 November 2009 and the new tariff applied on 1 January 2010, minimising the possibility that pre-customs-union trade flows have been already materially affected by the anticipation of future tariff changes. Furthermore, the analysis relies on statutory tariff rates, which, unlike effective tariffs, are not affected directly by volumes traded. Using data disaggregated at the six-digit level of the Harmonized System (HS), we are able to contrast product lines with tariff increases with those where tariffs fell or remained unchanged, while controlling for a number of other variables. The paper extends the work of Isakova and Plekhanov (2012). A similar question was recently addressed by Debaere and Mostashari (2010): they examine whether tariffs matter for the extensive margin of international trade by relying on 1
Import tariff revenues accrue to national budgets in predetermined proportions subject to regular reviews (Russia is entitled to between 88 per cent and 91 per cent of all revenues; Belarus to 5 per cent and Kazakhstan to 7 per cent).
2
disaggregated trade and tariff data for US bilateral imports between 1989 and 1999. They find that changing tariffs influence the extensive margin of countries’ exports to the United States in a statistically significant way such that US tariff reductions give way to new goods being traded. However, such effects are moderate at most and country- and industry-specific factors are far more important than US tariffs in explaining why countries start trading new goods and stop trading others. In a similar vein, Thompson and Reuveny (1998) examine whether protectionism matters as much as is commonly believed, highlighting in particular the difficulties in identification due to the likely endogeneity of tariffs with respect to trade. They conclude that it is by no means clear that in the long run protectionism matters as much as is commonly assumed. Earlier, McAleese (1977) compared the industrial sectors of Northern Ireland and the Republic of Ireland, similar in practically every respect except that the Republic of Ireland’s manufacturing sector has been highly protected, asking the question what difference protection makes to the protected economy’s industrial structure. The author concludes that tariffs do matter for inter-industry specialisation and hence factor mobility and income distribution, but highlights that these effects appear only in the long run. This paper looks at the effects of the changes in tariffs due to the formation of the customs union on all three countries, examining the structure as well as the volume of imports. In particular, the short-term impact of the change in tariffs is estimated by comparing imports from various trading partners in the sectors where tariffs changed and in those where they did not. The paper finds that trade creation effects have been insignificant, except in trade between Russia and third countries where Russian tariffs decreased. At the same time the change in tariffs appears to have created some trade diversion, with a significantly negative impact on imports from China to Kazakhstan in particular and a significantly positive impact on imports from within the customs union to Kazakhstan. The magnitude of this effect is relatively small, however. The results tentatively suggest that the benefits of the new tariff policy per se to member countries are limited at best. Larger benefits could come from gradual removal of nontariff barriers. The estimated impacts increase over time, but only slightly.2 The paper is structured as follows. Section 2 discusses the expected effects of changes in tariffs in the customs union based on the trade patterns of its member states. Section 3 presents the empirical results for the impact of tariff changes on the imports of all three countries. Section 4 briefly outlines other potential effects of regional trade integration, not directly related to tariff policy. Section 5 concludes.
2
Although the change in the tariff schedule can be seen as largely exogenous for Kazakhstan and thus provides a unique opportunity to study trade diversion effects across a broad range of merchandise groups, unfortunately the change is not as clearly exogenous to Russia, and to a lesser extent Belarus. In particular, Belarus negotiated a number of tariff hikes on products produced domestically.
3
2. Potential effects of tariff changes 2.1. Trade creation and trade diversion Belarus, Kazakhstan and Russia introduced a common external tariff from 1 January 2010. The effects of changes in tariff policy are generally twofold. On the one hand, the removal of internal tariffs and reduction in external tariffs could lead to trade creation – a term coined by Viner (1950) and referring to a generally welfare enhancing effect as consumers are given the opportunity to buy from more efficient foreign producers. In the context of the customs union this effect could be expected due to reduction in certain tariffs for third countries (tariffs on internal trade were already largely absent under various bilateral treaties). On the other hand, regional customs unions can also result in “too much” trade between the countries involved and not enough trade between the bloc and the outside world (trade diversion). This leads to direct welfare losses because consumers have to either pay more for high-quality products from outside the union or put up with inferior or costlier products supplied by less efficient local producers. In the context of the customs union this may occur in response to increases in external tariffs. Indeed, the common tariff of the customs union was negotiated in 2009 at the height of the global economic crisis and was viewed by many as an instrument to lock in some protectionist measures imposing higher tariffs on imports from non-CIS countries such as China, Germany or Turkey (see, for instance, Kommersant, 2010). However, while certain tariff increases (for example, on cars) made the headlines the overall picture is less clear-cut. In terms of tariff changes, the potential for trade diversion is highest in Kazakhstan. Of the three member countries it had the lowest effective tariffs prior to joining the union and around half of its tariffs were increased while only 10 per cent were reduced (World Bank, 2011). In Russia, relatively few tariff lines changed. Where they did increase there is a scope for trade diversion (or “trade destruction” if no substitute from within the union is available) but where they declined there is also scope for trade creation. 2.2. Trade orientation in Belarus, Kazakhstan and Russia The scope for trade diversion and trade creation would also depend on the trade structures and structures of comparative advantages of individual countries. After briefly introducing the data, this section thus starts with an examination of the three countries’ import shares by trading partner. Furthermore, to gain a deeper understanding of the potential for trade creation and diversion effects we also examine the extent of “overlaps”, that is, the volume and number of lines of goods that are imported from several major trading partners as opposed to being imported from just a single partner. The structure of trade flows of individual countries can be analysed using annual bilateral trade data from the Trade Map database of the International Trade Center of UNCTAD/WTO (ITC) at the six-digit level of disaggregation of the Harmonized System (HS) classification. This level (the highest available for customs union countries) divides goods into over 5,000 separate lines. The trade volumes are reported in nominal US dollars and were converted to constant base year prices using import deflators for the three countries as reported in the official statistics. Focus in the following analysis is on the import of goods to customs union countries. To minimise the “noise effect” from idiosyncratic import operations reflected in numerous lines with very low 4
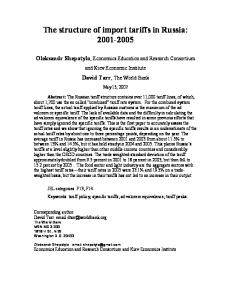
and volaatile importt values, thee analysis iss restricted to t industry-ccountry pairrs for which h annual import vvolumes exceed US$ 1 million (byy volume th his eliminatees at most 2 per cent off world imports in the case of Belarus,, less for Kaazakhstan an nd Russia). Chart 1 shows the structure s off Kazakhstann’s imports in the year preceding tthe formatio on of the m the unionn, almost 30 0 per cent customss union (20009): the majjority (overr 34 per centt) come from from thee EU-27 countries. Oth her major trrade partners are CIS co ountries outtside the cusstoms union annd China, accounting a for f around 110 per cent of o imports each. e The reest of the world accountts for aroundd 13 per cen nt of importts. Chart 1:: Kazakhstan: Import sh hares by tra ade partner, 2009
Sources: Internationa al Trade Cen ntre and auth hors’ calculattions.
Chart 2 shows import shares for fo Belarus: a much larg ger share off imports (nnearly 60 per cent) come frrom the custtoms union (this includdes fuel imp ports from Russia R at priices below the t internattional level)). The Europ pean Union accounts fo or around a quarter of iimports whiile China, CIS couuntries outsiide the custo oms union aand the restt of the worlld are relativvely less im mportant in termss of import shares.
5
Chart 2:: Belarus: Im mport shares by trade p partner, 2009 9
Sources: Internationa al Trade Cen ntre and auth hors’ calculattions.
Chart 3 shows the split s for Russia, reflectting a much h greater shaare of the Euuropean Un nion (over 40 per ccent) and the rest of thee world (oveer 35 per ceent) as well as China (1 3 per cent).. The customss union and the rest of the CIS acccount for aro ound 6 and 3 per cent oof imports, respectiively. This suggests s thaat the scope for trade diiversion maay be greateer for Belaru us and Kazakhhstan than foor Russia, ass Belarusiann and Kazak kh exporters’ presence in the Russsian market iis relativelyy more limitted (in line w with the rellative sizes of the econoomies). Chart 3:: Russia: Im mport shares s by trade pa artner, 2009 9
Sources: Internationa al Trade Cen ntre and auth hors’ calculattions.
6
To gauge the potential for trade diversion effects further one can look at the overlap between different trading partners exporting same goods to the customs union countries. Chart 4 shows that this overlap is substantial for the key trading partners – the European Union, China and customs union members. In the case of Kazakhstan, 17 per cent of all good lines (by number) have recorded imports from China, European Union and customs union countries. A further 16 per cent of goods are imported from both the customs union and the European Union (but not China). By contrast, only 22 per cent of lines are imported exclusively from the European Union and only 10 per cent exclusively from China. The overlaps are somewhat lower in the case of Belarus but they still provide for potential trade diversion effects. As expected, overlaps are smallest in the case of Russia, where among the items imported from the European Union, China or the customs union over three-quarters come from China or the European Union but not from within the customs union. The European Union is a more important sole trading partner than China for all three countries, with the difference being particularly marked for Belarus. This tentatively suggests a greater scope for trade diversion with respect to China as imports from the European Union may be harder to replace with imports from other trading partners, at least in the short run, based on existing trade relationships. The picture is similar if one looks at the volumes traded rather than the number of line items. The only exception is a larger share of imports solely from within the customs union in the case of Belarus. These increase to 31 per cent, driven by fuel from Russia.
7
Chart 4: Overlap between imports from key trading partners by number of goods (top row) and by volume (bottom row), 2009
Customs Union
Customs Union
24.3%
24.9%
Kazakhstan
Customs Union 4.0%
Belarus 4.1%
Russia 0.8%
16.4%
6.5%
EU
China
21.6%
5.1%
4.2%
Customs Union
Customs Union
18.6%
51.2%
EU
China
35.0%
10.7%
2.3% 4.6%
2.5%
2.1%
1.5%
1.9%
15.4%
0.1%
9.2%
0.1%
8.2% 21.7%
China
36.6%
Russia
10.1% 14.4%
EU 28.6%
Customs Union
Belarus
Kazakhstan
6.6% 12.7%
5.1%
17.3%
China 9.9%
0.9%
24.9%
3.6%
0.1% 0.2%
11.4%
1.4% 4.2%
EU
China
5.3%
0.8%
1.0%
1.1%
2.7% 4.1%
5.3%
7.1% 23.7%
EU
China
9.6%
1.4%
EU
12.8% 22.4%
17.8%
Sources: International Trade Centre and authors’ calculations.
Overall, these patterns suggest that the potential for trade diversion is likely to be greatest for Kazakhstan, followed by Belarus and less so for Russia, where most imports come from the European Union and are less likely to be substituted by imports from Belarus or Kazakhstan. In terms of trading partners, Chinese imports are likely to be more affected, in particular in the case of Kazakhstan where the overlap between imports from China and customs union members is larger. 2.3 Empirical approach to measuring the impact of tariff changes The empirical analysis below takes advantage of two features of the tariff reform that accompanied the formation of the customs union. First, it was largely unexpected and came into force almost immediately (the agreement was reached on 27 November 2009 and tariffs applied from 1 January 2010). This reduced the scope for bringing imports forward for goods where tariffs were increased or postponing imports where tariffs were reduced. Second, the structure of the common external tariff mimicked Russia’s tariff schedule closely. This meant that tariff changes were largely “exogenous” in the case of Kazakhstan and they simultaneously affected over half of all tariff lines. In the case of Belarus and Russia changes in tariffs affected fewer lines and were less exogenous – some of the changes were explicitly negotiated by Belarus, for example, to create preferences for its truck industry, or introduced as part of the anti-crisis package in Russia. Below, the short-term impact of the change in tariffs is estimated by comparing imports from various trading partners in the sectors where tariffs changed and in those where they did not. This is done at the six-digit level of disaggregation of the HS classification, for line items with an import value above US$ 1 million per year. 8
The folllowing speccification is estimated ffor all three countries, and a separate tely for majo or trade partnerss (the custom ms union, EU E countriess, China, CIIS countriess outside thee customs union u and the rest of the worlld):
m of importts between 22009 (beforre the The deppendent variiable is the change in thhe logarithm customss union) andd 2010 (afteer the introdduction of th he common external tarriff) for six--digit line . We hhave also exxamined thee change beetween 2009 9 and 2011 where w data were availaable to check hhow the effeects of tarifff changes evvolve over time. t mports in is the loggarithm of im 2009, is the chhange in thee tariff and includes changes in imports froom the samee trading partner over previoous years (2006-08 andd 2008-09), the t change in imports ffrom all cou untries of origin oover the sam me periods and a dummy variables fo or groups off goods at thhe three-dig git level of HS. R Regressionss were estim mated using OLS.
9
3. Results 3.1. Data The tariffs are taken from official publications of respective countries, such as Kazakhstanskaya Pravda and Rossiyskaya Gazeta. Statutory tariffs are generally defined at the 10-digit level of HS disaggregation. In the majority of cases all 10-digit tariffs within the same 6-digit group coincide, but certain six-digit lines contain multiple rates for 10-digit tariffs. The analysis below first focuses on the restricted sample of goods with unambiguous tariffs at the 6digit level, that is, containing a uniform tariff at the 10-digit level both before and after the change in the tariff schedule. While this has the advantage that it does not involve subjective judgements on which of the multiple tariffs to use, these 6-digit lines may not be a random subset of goods – thus this assumption will subsequently be relaxed. Tariff lines where transitory arrangements applied are also excluded from the core sample. The list of temporary exclusions is taken from the resolution of the Intergovernmental Council of the Eurasian Economic Community. Assigning transitionary tariffs would be problematic as concessionary tariffs were often made conditional on unobserved characteristics, such as items being imported for personal use (in case of passenger cars) or having a value below a certain threshold. As very few lines were affected, we would however not expect this to bias our results. Table 1 summarises descriptive statistics for selected variables, for all three countries. On average tariffs increased in Kazakhstan (the in-sample average for the world is 1.7 per cent). While in Russia and Belarus a number of tariffs also increased, on average the tariffs actually declined, by 1 and 1.2 percentage points, respectively.
10
Table 1: Descriptive statistics for selected variables
change in tariffs increase in tariffs decrease in tariffs diff in log imports EU 2009-2010 diff in log imports EU 2006-2008 diff in log imports EU 2008-2009 log imports EU 2009 diff in log imports CIS2 2009-2010 diff in log imports CIS2 2006-2008 diff in log imports CIS2 2008-2009 log imports CIS2 2009 diff in log imports CU 2009-2010 diff in log imports CU 2006-2008 diff in log imports CU 2008-2009 log imports CU 2009 diff in log imports RoW 2009-2010 diff in log imports RoW 2006-2008 diff in log imports RoW 2008-2009 log imports RoW 2009 diff in log imports China 2009-2010 diff in log imports China 2006-2008 diff in log imports China 2008-2009 log imports China 2009 diff in log imports World 2009-2010 diff in log imports World 2006-2008 diff in log imports World 2008-2009 log imports World 2009
Kazakhstan Obs Mean SD Min 1323 1.71 6.45 -22.50 1323 2.82 5.35 0.00 1323 -1.11 2.60 -22.50 566 -0.14 0.67 -2.73 743 0.42 0.99 -4.07 616 -0.35 0.62 -2.63 666 8.27 1.03 6.91 179 0.01 0.75 -3.37 253 0.79 1.29 -2.03 181 -0.44 0.69 -2.77 220 8.15 1.01 6.92 495 -0.63 0.47 -4.41 747 0.35 0.87 -3.32 641 -0.43 0.54 -3.28 671 8.41 1.11 6.91 421 -0.06 0.69 -3.39 556 0.68 1.21 -3.02 443 -0.44 0.67 -4.07 527 8.16 1.02 6.91 350 0.14 0.57 -2.37 441 1.03 1.37 -2.74 336 -0.37 0.57 -2.23 413 7.99 0.93 6.92 1323 -0.17 0.55 -4.64 1323 0.35 0.77 -4.06 1323 -0.38 0.51 -3.42 1323 8.78 1.21 6.91
Max 42.50 42.50 0.00 2.92 5.41 2.55 12.97 1.97 8.73 1.47 13.78 1.16 6.78 1.87 14.23 3.59 7.15 2.81 12.67 2.04 9.79 1.16 13.44 2.68 8.03 2.71 14.25
Obs 1578 1578 1578 786 915 790 848 199 302 206 231 659 872 669 699 259 337 255 305 164 215 153 181 1578 1578 1578 1578
Belarus Mean SD Min -1.00 4.09 -25.00 0.38 2.61 0.00 -1.39 2.98 -25.00 0.07 0.53 -2.85 0.56 0.80 -2.13 -0.05 0.48 -2.91 8.16 0.92 6.91 0.14 0.43 -1.58 0.81 1.08 -1.69 -0.28 0.52 -2.09 8.01 0.85 6.91 0.13 0.50 -4.52 0.54 0.87 -1.66 -0.27 0.54 -2.71 8.21 1.07 6.91 0.05 0.46 -1.60 0.79 0.97 -2.16 -0.03 0.50 -2.17 7.86 0.86 6.92 0.28 0.38 -1.41 1.38 1.23 -1.63 -0.08 0.48 -1.63 7.66 0.68 6.91 0.12 0.43 -2.87 0.48 0.67 -2.40 -0.15 0.44 -2.56 8.44 1.09 6.91
Max 30.00 30.00 0.00 3.53 7.29 2.53 12.27 1.29 6.75 1.03 10.94 3.38 8.47 2.75 15.77 1.52 5.32 1.58 11.62 1.35 7.18 1.34 10.59 3.26 8.47 1.81 15.77
Obs Mean 2917 -1.22 2917 0.25 2917 -1.47 2117 0.24 2329 0.51 2136 -0.33 2174 9.10 521 0.30 643 0.58 519 -0.36 579 8.54 536 0.17 670 0.60 539 -0.33 580 8.54 1660 0.30 1880 0.70 1644 -0.29 1727 8.72 1313 0.46 1507 1.12 1286 -0.25 1364 8.55 2917 0.29 2917 0.56 2917 -0.31 2917 9.46
Russia SD 3.56 1.64 3.04 0.49 0.73 0.53 1.41 0.57 1.00 0.68 1.28 0.50 1.09 0.49 1.26 0.50 0.95 0.62 1.36 0.50 1.05 0.60 1.19 0.46 0.65 0.51 1.51
Min -20.00 0.00 -20.00 -3.46 -3.41 -3.18 6.91 -1.66 -2.83 -3.61 6.92 -3.52 -2.55 -2.22 6.91 -2.07 -2.77 -4.02 6.91 -3.24 -2.21 -4.05 6.91 -3.33 -2.59 -3.06 6.91
Max 35.00 35.00 0.00 3.31 7.53 3.28 14.29 4.03 6.18 2.40 12.86 1.83 7.66 1.38 12.92 3.26 8.21 4.60 14.83 2.95 7.45 2.56 14.23 2.64 5.48 3.89 15.31
Source: Authors’ calculations. Note: Obs is the number of observations – product lines at the six-digit level of disaggregation.
Table 2 summarises the effects of tariff changes for Kazakhstan, looking first at the restricted sample where six-digit statutory tariffs could be determined unambiguously. The first column presents the results for changes in the overall volume of imports. The coefficient on the change in tariffs is positive but statistically and economically insignificant (taken at face value, it implies that a 10 per cent increase in the tariff led to a 2.6 per cent increase in import volume). The remaining five columns present the results for key trade partners. The coefficient on tariffs is positive and significant for the customs union: a two per cent increase in the tariff (the average for the sample) is estimated to have led on average to a 1.6 per cent increase in imports from Russia and Belarus. For all other trading groups, including the rest of the CIS, the effect is negative and insignificant at conventional levels. Among these, the negative effect is largest for China. In terms of controls, most exhibit saturation properties: the higher the existing imports of a given group from a given partner, the slower the growth of trade. The results also point to a post-crisis recovery in trade with all partners: the bigger the drop in trade in 2008-09, the higher the growth rate in 2009-10. These coefficients are sizable and statistically significant for all partners, and largest for the rest of the world (primarily the United States and Japan), where a 1 per cent deeper drop in trade during the crisis translates into a 0.4 per cent faster growth in imports in 2010.
11
Table 2: Kazakhstan ─ effects of tariff changes World 0.0026 (0.0031)
Δ tariffs Δ bilateral imports (2006-08) Δ bilateral imports (2008-09) log of bilateral imports (2009) Δ world imports (2006-08) Δ world imports (2008-09) log of world imports (2009) Observations R-squared Number of fixed effects
-0.0978*** (0.0211) -0.2888*** (0.032) -0.1067*** (0.0145) 1186 0.1426 132
CU EU China CIS RoW 0.0076** -0.0064 -0.0092 -0.0068 -0.0065 (0.0037) (0.0054) (0.0081) (0.0175) (0.007) 0.0048 -0.079 -0.0523 0.0868 -0.1371*** (0.0333) (0.0538) (0.0555) (0.0766) (0.0479) -0.2329*** -0.3095*** -0.2951** -0.3758* -0.4166*** (0.0475) (0.089) (0.1135) (0.1975) (0.0732) -0.0721*** -0.1364*** -0.1115** -0.2568*** -0.1521*** (0.0209) (0.0335) (0.051) (0.094) (0.0425) 0.0459 0.0971 -0.1404 -0.2850** -0.0422 (0.048) (0.0777) (0.0972) (0.1157) (0.0941) 0.2177*** -0.2054* 0.102 -0.1391 0.1281 (0.0629) (0.1121) (0.1502) (0.2504) (0.116)
424 0.1431 98
459 0.2305 87
243 0.1235 74
126 0.26 53
296 0.2706 82
Source: Authors’ calculations. Note: Dependent variables is a change in trade flows (in logarithms). Robust standard errors in parentheses. Values significant at the 1 per cent level are marked with ***; at the 5 per cent level, with **, at the 10 per cent level, with *.
The tariff lines where tariffs differ within the six-digit groups, excluded in the above analysis, may in fact be more sensitive to tariff changes as presumably there may be a reason why the tariff schedule is quite complex for these items in the first place. When these lines are also included3 (see results reported in Table A.1 in the Appendix), the coefficient on tariffs is still positive, significant and of similar magnitude for the customs union, while the negative coefficient for imports from China is larger and becomes statistically significant. Taken together, the results tentatively point towards trade diversion in response to an increase in tariffs for non-CIS countries. However, the negative coefficient on change in tariffs may potentially combine two different effects: a decrease in imports in response to an increase in tariffs and an increase in imports in response to tariff reductions (the latter effect will in fact amount to trade creation with respect to partners outside the customs union). To allow for asymmetric responses in these two cases, the changes in tariffs are interacted with dummy variables for positive and negative changes, and the corresponding results are reported in Table 3. They suggest that for Kazakhstan only increases in tariffs in fact had a significant impact on trade volumes, with a positive coefficient for the customs union and negative coefficients for China and the rest of the world.
3
Approximation and judgement were used to compute average statutory tariffs for these lines. The reported tradeweighted tariffs have the disadvantage of being endogenous to the composition of trade within 6-digit groups. For example, take a 10-digit line with a high tariff. If that tariff is further increased, imports of that good may fall, resulting in a lower trade-weighted tariff for that 6-digit group, while the average statutory tariff in fact increased.
12
Table 3: Asymmetric effects of tariff changes Kazakhstan Δtariffs (reduction) Δtariffs (increase) Observations R-squared Number of fixed effects
Δtariffs (reduction) Δtariffs (increase) Observations R-squared Number of fixed effects
Δtariffs (reduction) Δtariffs (increase) Observations R-squared Number of fixed effects
World 0.0038 (0.0061) 0.0019 (0.0035) 1,323 0.1760 133
CU 0.0025 (0.0118) 0.0087* (0.0046) 486 0.1826 99
World -0.0019 (0.0041) -0.0353*** (0.0059) 1,578 0.1718 147
CU 0.006 (0.0079) 0.011 (0.0119) 640 0.1797 109
World -0.0131*** (0.0039) -0.0076 (0.0058) 2,917 0.1092 162
CU 0.0091 (0.0111) -0.008 (0.0144) 508 0.0746 109
EU China 0.0011 0.0003 (0.0111) (0.0167) -0.0081 -0.0190** (0.0061) (0.0088) 542 295 0.3002 0.2254 93 77 Belarus EU China -0.0049 -0.0062 (0.0066) (0.0134) -0.0506*** -0.0696 (0.0082) (0.0904) 747 143 0.2763 0.119 119 55 Russia EU China -0.0114** -0.0110** (0.0048) (0.0055) -0.0066 -0.0235* (0.0071) (0.0136) 2,084 1,250 0.1295 0.1067 151 136
CIS -0.0664 (0.0413) 0.0168 (0.0164) 156 0.3595 55
RoW 0.0111 (0.0165) -0.0133* (0.0076) 363 0.3427 83
CIS RoW -0.009 -0.0101 (0.023) (0.0146) 0.0029 -0.0612*** (0.0172) (0.012) 187 233 0.1386 0.2691 66 81 CIS -0.0172 (0.0141) 0.0252 (0.0242) 460 0.1504 106
RoW -0.0095* (0.0053) -0.0170* (0.0103) 1,590 0.1113 148
Source: Authors’ calculations. Note: Dependent variables is a change in trade flows (in logarithms). Robust standard errors in parentheses. Values significant at the 1 per cent level are marked with ***; at the 5 per cent level, with **, at the 10 per cent level, with *.
Table 4 reports the effects of tariff changes for Belarus. The coefficient on tariffs, though positive, is not significant for the customs union – possibly explained by the fact that changes in tariffs were much less drastic for Belarus, which already had a tariff schedule similar to the Russian one. The negative coefficient for imports from the European Union is significant for both the restricted and the full sample. When looking at the full sample (Table A.2 in the Appendix), the coefficients for the world as a whole and the rest of the world are also significant and negative (the average tariff changes are -1.0 and -0.8 respectively). The coefficients on controls are similar to those in the case of Kazakhstan.
13
Table 4: Belarus ─ effects of tariff changes
Δ tariffs
World -0.0051 (0.0039)
Δ bilateral imports (2006-08) Δ bilateral imports (2008-09) log of bilateral imports (2009) Δ world imports (2006-08) Δ world imports (2008-09) log of world imports (2009) Observations R-squared Number of fixed effects
-0.0018 (0.017) -0.3282*** (0.0291) -0.0470*** (0.0113) 1394 0.1182 147
CU 0.0016 (0.0085) 0.0908* (0.0463) -0.3646*** (0.0693) -0.0457** (0.0211) -0.0935 (0.0587) 0.0055 (0.0888)
555 0.1471 107
EU China CIS -0.0145** -0.0282 0.0094 (0.0063) (0.0175) (0.0173) -0.0494 0.0636 0.0334 (0.0405) (0.0571) (0.0605) -0.2173*** -0.0334 -0.4267*** (0.0758) (0.1957) (0.0961) -0.0772*** -0.1506** -0.0605 (0.0233) (0.0728) (0.0531) -0.0444 0.0044 -0.1329 (0.0533) (0.1091) (0.1216) -0.3108*** -0.0822 0.188 (0.0922) (0.245) (0.1553)
638 0.2307 118
120 0.1434 52
167 0.2109 64
RoW 0.0056 (0.0118) 0.0551 (0.0559) -0.128 (0.0839) -0.0273 (0.0435) -0.1108 (0.0974) -0.0259 (0.1432)
191 0.0762 79
Source: Authors’ calculations. Note: Dependent variables is a change in trade flows (in logarithms). Robust standard errors in parentheses. Values significant at the 1 per cent level are marked with ***; at the 5 per cent level, with **, at the 10 per cent level, with *.
Unlike Kazakhstan, where on average tariffs increased, in Belarus the average tariff declined by 0.9 of a percentage point, and the baseline interpretation could be that this led to a 1 per cent increase in imports from the European Union. However, the analysis allowing for asymmetric responses suggests that the results are driven by those lines where tariffs increased (all coefficients for reductions in tariffs are small and statistically insignificant). By contrast, tariff increases had a significant negative impact on imports from the European Union and the world as a whole and these effects are larger in Belarus than in Kazakhstan (average tariff increases in these cases are 0.3 and 0.5 percentage points, which led to reductions in imports of 1 to 3 per cent). Table 5 looks at the effects of tariff changes for Russia: again, tariff changes had a positive but very small and statistically insignificant coefficient for the customs union, while the effects were significant and negative for the world as a whole, the European Union, China and the rest of the world for both the restricted and the full samples (for extended sample results, see Table A.3 in the Appendix).
14
Table 5: Russia ─ effects of tariff changes
Δ tariffs
World -0.0141*** (0.0035)
Δ bilateral imports (2006-08) Δ bilateral imports (2008-09) log of bilateral imports (2009) Δ world imports (2006-08) Δ world imports (2008-09) log of world imports (2009) Observations R-squared Number of fixed effects
-0.0663*** (0.0135) -0.2580*** (0.0184) -0.0481*** (0.0066) 2610 0.1123 162
CU EU China CIS RoW 0.0006 -0.0137*** -0.0148*** -0.0158 -0.0123** (0.0107) (0.0043) (0.0056) (0.0134) (0.0052) 0.0299 -0.0493* -0.0417** 0.0369 -0.0244 (0.0264) (0.0279) (0.0202) (0.0467) (0.0201) -0.0934 -0.3216*** -0.3393*** -0.2164*** -0.2922*** (0.0693) (0.0359) (0.0363) (0.0608) (0.0322) -0.0725*** -0.0684*** -0.0524*** -0.0722*** -0.0571*** (0.0243) (0.0091) (0.0129) (0.0254) (0.0109) 0.0653 -0.0209 0.0523 0.0054 -0.0135 (0.0568) (0.0343) (0.0378) (0.0623) (0.0314) -0.1315** 0.056 0.2043*** -0.0356 0.1419*** (0.066) (0.0395) (0.0501) (0.0793) (0.0432)
412 0.0687 107
1810 0.1467 151
1077 0.1254 135
401 0.1108 102
1341 0.1112 147
Source: Authors’ calculations. Note: Dependent variables is a change in trade flows (in logarithms). Robust standard errors in parentheses. Values significant at the 1 per cent level are marked with ***; at the 5 per cent level, with **, at the 10 per cent level, with *.
As in Belarus, on average, tariffs declined in Russia. The analysis of asymmetric responses (Table 3) suggests that unlike in Belarus and Kazakhstan where only tariff increases had a significant impact on trade, both tariff increases and tariff reductions impacted trade flows in Russia. Tariff reductions were associated with statistically significant increases in imports from the world as a whole, the European Union, China and the rest of the world, while tariff increases were associated with statistically significant reductions in imports from China and the rest of the world. For these trading partners tariff increases appear to have had larger effects than tariff reductions, in trade with the European Union tariff reductions appeared to have mattered more. Additional specifications also controlled for concurrent exports of the other two customs union countries to the rest of the world (countries outside the customs union) and concurrent exports of other CIS countries to account for changes in the export capabilities in these countries, if any. The coefficients on these additional controls were very small and statistically insignificant, though positive; all other coefficients remained very similar, both in terms of magnitude and in terms of significance. In Russia, where detailed trade data for 2011 were available, it is also possible to explore how the trade effects of changes in tariffs evolve over time.4 Establishing new trade partnerships may take a long time and effects in the long term can be expected to be larger than the immediate effects. The results in Table 6 suggest that coefficients are indeed slightly larger 4
Data for Kazakhstan are not available. Belarus experienced a major balance of payments crisis in 2011 with a brief period of dual exchange rates and various other restrictions on trade, which makes meaningful analysis of trade flows difficult.
15
when one looks at changes in trade over the period 2009-11, although they are broadly comparable to coefficients in Table 5. Table 6: Russia ─ effects of tariff changes, 2009-11 World EU -0.0142*** -0.0115** (0.004) (0.0045) Δ bilateral imports (2006-08) -0.1374*** (0.0313) Δ bilateral imports (2008-09) -0.4303*** (0.0385) log of bilateral imports (2009) -0.0616*** (0.0096) Δ world imports (2006-08) -0.0629*** 0.0714* (0.0163) (0.0381) Δ world imports (2008-09) -0.3466*** 0.0528 (0.0221) (0.043) log of world imports (2009) -0.0539*** (0.0076) Observations 2,904 2,085 R-squared 0.1114 0.164 Number of fixed effects 162 151
Δ tariffs
China CIS -0.0143** 0.0139 (0.006) (0.0112) -0.0207 -0.0093 (0.0213) (0.0385) -0.4133*** -0.2888*** (0.0373) (0.0564) -0.0881*** -0.1048*** (0.0142) (0.0221) 0.0643 -0.0283 (0.0403) (0.0599) 0.2390*** 0.0013 (0.0539) (0.0742)
1,247 0.156 134
673 0.1251 118
Source: Authors’ calculations. Note: Dependent variables is a change in trade flows (in logarithms). Robust standard errors in parentheses. Values significant at the 1 per cent level are marked with ***; at the 5 per cent level, with **, at the 10 per cent level, with *.
The analysis above is subject to many caveats. Importantly, it only looks at short-term effects of changes in tariffs while trade flows may take longer to respond. Moreover, trade creation may also occur at the extensive margin, whereby new products are first traded in small quantities and only later extended as trading networks are built up. These effects may not be captured in this analysis. Nonetheless, the analysis suggests that changes in tariffs did have some impact on import volumes, largely in line with our priors: the declines in import volumes were more pronounced for Kazakhstan, especially for imports from China, and least pronounced in the case of Russia (where there is some evidence of trade creation with respect to third countries in response to lower tariffs). All of the effects are relatively small in magnitude, however: an average increase in tariffs (of 1 to 2 percentage points) is estimated to lead to a 1 to 3 per cent reduction in tariffs.
16
4. Other effects of regional trade integration 4.1. Benefits While the effects of tariff policy appear to be limited, regional economic integration can over time bring multiple benefits. The removal of non-tariff barriers could lead to trade creation, for example as customs checks are removed from internal borders. Asian Development Bank provides evidence that crossing the Kazakh-Russian border has indeed become substantially easier since the introduction of the customs union. A number of non-trade barriers are yet to be fully removed. In particular, technical and sanitary regulations are yet to be harmonised, and in many cases firms are still subjected to national-level inspection and certification of their produce. Moreover, the legal regime governing imports into the customs union, underpinned by both national and supranational acts, is fairly complicated and may entail increased compliance costs, in particular for smaller businesses. In the longer term, coordinated improvements in cross-border infrastructure could also increase trade. Producers within a regionally integrated area could also benefit from increased market size (due to greater export opportunities). This in turn can spur innovation and, with time, help to promote exports to markets outside the customs union. The effect of increased market size may be most important for Kazakhstan and Belarus, gaining access to the large Russian market. Regional trade integration may also attract foreign direct investment (FDI) both from within and outside the regional bloc as countries can leverage each other’s competitive advantages by building regional production chains, as in the case of ASEAN (Association of South East Asian Nations). Under these arrangements intermediate goods may be actively traded within the bloc while final goods may be sold to local customers as well as exported elsewhere. Gains from regional integration arrangements may go beyond trade benefits. Deeper regional economic integration can help member countries to strengthen their economic and political institutions. As some competencies are delegated to the newly created supranational bodies, and other areas of economic policy undergo synchronisation across countries, an opportunity arises to review and revise laws and regulations and strengthen their implementation. Indeed, regional integration may act as an instrument for joint commitment to a reform agenda. It may further help to signal such commitment to outside investors, in particular in the case of countries where policies are perceived to lack credibility or consistency. Deeper regional economic integration can also help to make the first steps towards liberalisation of services markets. These tend to be subject to greater regulation and protection compared with goods markets; even within the European Union many markets in the services sectors remain fragmented. Yet there is a great potential for efficiency gains in these markets that can be achieved by lowering entry barriers for firms and investors from other countries within the common economic space. 4.2. Risks and “side-effects” The regional nature of the union may, however, lead to negative effects for some countries that may partly, or perhaps even fully, offset the benefits. As with tariff barriers, the use of nontariff barriers with respect to third countries may underpin trade diversion. For example, ADB estimates that while crossing the border between Kazakhstan and Russia became substantially easier, clearance times on the Kazakh border for trucks entering from non-customs-union CIS 17
countries (like the Kyrgyz Republic) not only have not decreased but in fact have lengthened significantly, by up to 47 per cent.5 Eurasian integration faces a number of additional challenges (see EBRD, 2012, for a detailed discussion). One is to ensure that supranational decision-making mechanisms work effectively given the unprecedented degree of asymmetry between union members (Kazakhstan’s population and GDP are around one-tenth of Russia’s; Belarus’s is even smaller). Some other regional unions have been facing a similar challenge, even if to a lesser extent: the Gulf Cooperation Council is dominated by Saudi Arabia, while Mercosur is dominated by Brazil. Their experience highlights the importance of ensuring that the decisions of supranational bodies of the union are implemented by all member countries and that dispute resolution mechanisms at the supranational level work well. Furthermore, unlike a union among relatively rich countries, a union among countries with lower income per capita may lead to a divergence rather than convergence of income levels. This is the case because regional integration tends to benefit countries closest to the world average in terms of comparative advantages (see Venables, 2003). In a rich-country club, the “winners” would be poorer countries with labour-intensive industries that get preferential access to rich countries’ markets. In a lower-income-country club, the “winners” are instead the richer countries. Despite holding middle ground in terms of per capita income, Kazakhstan has the highest degree of dependency on oil and gas extraction and thus a production structure furthest away from the world average. Convergence forces may thus prove to be weaker than expected in the Eurasian Union. A related challenge is that, much like the Gulf Cooperation Council (GCC), the Eurasian union is dominated by commodity exporters, which somewhat limits the immediate scope for integration. Owing to this, the countries within the common economic space are actually less economically integrated than commonly perceived: Belarus and Kazakhstan account for under 7 per cent of Russia’s exports and imports, FDI linkages are even weaker. The only exception is Belarus, a net energy importer, where over half of total imports comes from Russia and Kazakhstan. Given this setting, regional integration needs to put greater emphasis on the development of cross-border infrastructure, cross-border investment and liberalisation of mutual access to services markets. The experience of the GCC shows that these can be important building blocks of regional integration of commodity-rich economies. Finally, deeper economic integration may increase macroeconomic vulnerabilities of member states. As production chains become more integrated, shocks to world trade, such as the one that followed the collapse of Lehman Brothers in September 2008, propagate quickly through regional economic blocks. Suppliers of intermediary goods may be particularly strongly affected as suppliers of final goods cut orders and run down existing stocks of inputs.6 As a result, both output contractions and the strength of the subsequent recovery can be amplified through close trade linkages.
5
Based on the Corridor Performance Management and Monitoring data of the Central Asia Regional Economic Cooperation Programme. 6 See Zavacka (2012) for a discussion of this so-called “bullwhip effect”.
18
5. Conclusions Overall, the estimated effects are consistent with some trade diversion effects in Kazakhstan (a decrease in imports from China and an increase in imports from other customs union countries); for Belarus and Russia the evidence does not point to significant trade diversion. In the case of Belarus, trade with certain partners declined in response to higher tariffs while changes in trade from within the customs union were not statistically significantly associated with changes in tariffs. Similar “trade destruction” was observed in Russia but it was complemented by trade creation with respect to the European Union, China and the rest of the world in response to lower tariffs. On balance, Chinese imports appeared to be most sensitive to tariff changes. While these changes were statistically significant, they were moderate in terms of magnitude. In fact tariff changes explain only around 1 per cent of the variation in imports in these regressions, suggesting that tariff barriers may be less important than commonly believed (a finding in line with earlier work). About a third of the variation can be explained by crisis recovery trends – a temporary effect that will subside over time. The remaining, significant, increase in intra-union trade appears to be attributable to the lowering of non-tariff barriers within the customs union, as well as other unobserved factors. Further reducing non-tariff barriers and liberalising access to both goods and services markets can bring tangible and sustained benefits to customs union members. These are likely to be much more important – but they are also even harder to measure. While this paper focused on the import side of the effects of tariff changes, further work will complement this by looking at effects on exports, as well as contrasting changes at the extensive and the intensive margins.
19
References ADB (2012), “Implications for CAREC of the Customs Union between Russia, Belarus and Kazakhstan”, Asian Development Bank Study. P. Debaere and S. Mostashari (2010), “Do Tariffs Matter for the Extensive Margin of International Trade? An Empirical Analysis”, Journal of International Economics, Vol. 81, No. 2, pp. 163-69. EBRD (2012), Transition Report 2012, Chapter 4, pp.62-79. A. Isakova and A. Plekhanov (2012), “Customs Union and Kazakhstan’s Imports”, CASE Network Studies and Analyses 442/2012. Kommersant (2010), “Common Protectionism (Obyknovenny Protectionism)”, 09.04.2010. D. McAleese (1977), A profile of grant-aided industry in Ireland, Dublin: Institute for Public Administration. W. Thompson and R. Reuveny (1998), “Tariffs and Trade Fluctuations: Does Protectionism Matter as Much as We Think?”, International Organization, Vol. 52, No 2, pp. 421-40. J. Viner (1950), The Customs Union Issue, New York: Carnegie Endowment. World Bank (2011), “Assessment of Costs and Benefits of the Customs Union for Kazakhstan”, Report 65977-KZ. V. Zavacka (2012), “The bullwhip effect and the great trade collapse”, EBRD Working Paper 148.
20
Appendix Table A.1: Kazakhstan ─ effects of tariff changes (full sample)
Δ tariffs
World 0.0024 (0.0028)
Δ bilateral imports (2006-08) Δ bilateral imports (2008-09) log of bilateral imports (2009) Δ world imports (2006-08) Δ world imports (2008-09) log of world imports (2009) Observations R-squared Number of fixed effects
-0.1020*** (0.0198) -0.3218*** (0.0294) -0.1111*** (0.0129) 1,323 0.1760 133
CU EU China CIS RoW 0.0076* -0.0056 -0.0141** 0.0009 -0.0078 (0.0039) (0.0049) (0.0071) (0.0136) (0.0062) 0.0068 -0.0556 -0.1514*** 0.0101 -0.1148*** (0.0372) (0.0459) (0.0447) (0.0579) (0.0427) -0.2622*** -0.3146*** -0.4621*** -0.3133** -0.4551*** (0.0507) (0.0675) (0.0877) (0.1275) (0.0606) -0.1267*** -0.1495*** -0.1569*** -0.3110*** -0.1986*** (0.0217) (0.0284) (0.0429) (0.0753) (0.0343) -0.0330 0.0479 -0.0153 -0.2297** -0.1050 (0.0509) (0.0662) (0.0752) (0.1010) (0.0804) 0.0690 -0.2468*** 0.1664 -0.1135 0.1888** (0.0620) (0.0907) (0.1116) (0.1837) (0.0929)
486 0.1821 99
542 0.2995 93
295 0.2221 77
156 0.3393 55
363 0.3390 83
Source: Authors’ calculations. Note: Dependent variable is a change in trade flows (in logarithms). Robust standard errors in parentheses. Values significant at the 1 per cent level are marked with ***; at the 5 per cent level, with **, at the 10 per cent level, with *.
21
Table A.2: Belarus ─ effects of tariff changes (full sample)
Δ tariffs
World -0.0133*** (0.0032)
Δ bilateral imports (2006-08) Δ bilateral imports (2008-09) log of bilateral imports (2009) Δ world imports (2006-08) Δ world imports (2008-09) log of world imports (2009) Observations R-squared Number of fixed effects
-0.0195 (0.0163) -0.3655*** (0.0263) -0.0500*** (0.0104) 1,578 0.1605 147
CU 0.0077 (0.006) 0.1102*** (0.0423) -0.3940*** (0.0594) -0.0452** (0.0191) -0.1110** (0.0536) 0.0394 (0.0759)
EU China CIS RoW -0.0233*** -0.0078 -0.0015 -0.0401*** (0.0049) (0.0132) (0.013) (0.0089) -0.0033 0.0771 -0.0028 0.065 (0.036) (0.0491) (0.0548) (0.0551) -0.3118*** -0.0424 -0.3606*** -0.1817** (0.0688) (0.148) (0.0916) (0.0848) -0.1012*** -0.1469** -0.033 -0.0799** (0.0208) (0.0599) (0.0477) (0.0404) -0.0931* -0.0581 -0.0145 -0.0748 (0.0483) (0.0964) (0.1061) (0.0836) -0.1654** -0.1143 0.1658 0.071 (0.0819) (0.1974) (0.1411) (0.136)
640 0.1795 109
747 0.257 119
143 0.1138 55
187 0.1374 66
233 0.2359 81
Source: Authors’ calculations. Note: Dependent variable is a change in trade flows (in logarithms). Robust standard errors in parentheses. Values significant at the 1 per cent level are marked with ***; at the 5 per cent level, with **, at the 10 per cent level, with *. Table A.3: Russia – effects of tariff changes (full sample)
Δ tariffs
World -0.0114*** (0.0032)
Δ bilateral imports (2006-08) Δ bilateral imports (2008-09) log of bilateral imports (2009) Δ world imports (2006-08) Δ world imports (2008-09) log of world imports (2009) Observations R-squared Number of fixed effects
-0.0651*** (0.0128) -0.2625*** (0.0174) -0.0446*** (0.006) 2917 0.109 162
CU 0.0026 (0.0084) 0.0243 (0.023) -0.1474*** (0.053) -0.0567*** (0.0196) 0.0143 (0.0479) -0.1473*** (0.0542)
EU -0.0099** (0.0039) -0.0721*** (0.0258) -0.3024*** -0.0338 -0.0606*** -0.0082 0.0112 -0.0319 0.0462 -0.0376
508 0.0726 109
2084 0.1293 151
China CIS RoW -0.0128** -0.0061 -0.0111** -0.0051 -0.012 -0.0047 -0.0495*** 0.0553 -0.0396** -0.0183 -0.036 -0.0187 -0.2980*** -0.2346*** -0.3032*** -0.032 -0.0531 -0.03 -0.0499*** -0.0807*** -0.0513*** -0.012 -0.0217 -0.0099 0.0562 -0.0166 -0.0058 -0.0342 -0.053 -0.0296 0.1983*** -0.0564 0.1350*** -0.0453 -0.0713 -0.04
1250 0.1061 136
460 0.145 106
1590 0.111 148
Source: Authors’ calculations. Note: Dependent variable is a change in trade flows (in logarithms). Robust standard errors in parentheses. Values significant at the 1 per cent level are marked with ***; at the 5 per cent level, with **, at the 10 per cent level, with *.
22