OECD Journal: Financial Market Trends Volume 2012/1 © OECD 2012
Global imbalances and the development of capital flows among Asian countries by Naoyuki Yoshino*
During the curr ent global crisis , capital inflows into Asian countries ha ve incr eased, leading to excess liquidity and the risk of potential asset bubbles . A sudden reversal of these inflows would have negative effects on the economies in question.Given the impact of global capital mov ements on domestic financial systems and thereby on domestic economies, in sev eral Asian countries certain macr o-prudential regulations have been put in place, and capital controls and micro-prudential regulations have re-emerged as important tools to handle the issues related to capital inflows from outside of the region. It is important to ensur e that global imbalances do not become a sour ce of instability. The issue , thor oughly discussed after the Asian crisis a decade ago , is “using Asian savings for Asian investments” through the dev elopment of bond mar kets and SME’s financial inclusion. Against the backdrop of huge potential demands for infrastructure investment in the Asian r egion, this note pr oposes the issuance of “infrastructure revenue bonds” to help develop bond markets in Asia. To facilitate financial inclusion of SMEs, which outnumber other types of business inAsia, this note also proposes creating an SME database and developing regional trust funds. JEL Classification: F21, F30, F32, H54 Keywords: Global imbalances , capital flows, Asian economies, SME finance, financial inclusion, infrastructure revenue bonds, local trust fund
* Naoyuki Yoshino is Pr ofessor of Economics at Keio U niversity, Tokyo, J apan (y
[email protected]. ac.jp). A pr evious v ersion of the paper w as pr esented at the 12th Roundta ble on Capital Market Reform in Asia (“Tokyo Roundtable”) on 7-8 February 2012 in Tokyo, Japan (www.oecd.org/daf/fin/tokyo). The author is grateful for comments from Roundtable participants as well as OECD staff members and colleagues. Editorial assistance was provided by Gert Wehinger. The author is solely responsible for any remaining errors. This work is pub lished on the r esponsibility of the Secr etary-General of the OECD . The opinions e xpressed and ar guments emplo yed her ein ar e the author’ s and do not necessarily reflect the official views of the Organisation or the governments of its member countries. This document and an y map included her ein are without pr ejudice to the status of or so vereignty over any territory, to the delimitation of international frontiers and boundaries and to the name of any territory, city or area.
81
Global Imbalances and the Development of Capital Flows among Asian Cou ntries
I. Summary and overview The subprime loan crisis br ought v arious issues to the attention of financial policymakers, and caused a r e-think about the measur es introduced to addr ess it. Some analysts ha ve ar gued that among the factors contributing to the build-up of e xcess exposures was a narrow focus on inflation by major central banks, with too little attention paid to asset price de velopments. Others contend that pr oblems w ere mor e the r esult of w eak mana gement of risks on the part of financial institutions with inadequate supervision, rather than a r esult of e xcess liquidity per se . Financial innovation has also received considerable attention, as ne w securitised instruments featur ed prominently in the problems, raising questions regarding the role of credit rating agencies. On many of these points, the jury is still out and final conclusions have yet to be drawn. But some other aspects of the evolving financial landscape are mor e straightforward, though perhaps still some what contr oversial. It is clear , for e xample, that as the global economy has become more interconnected and integrated the size and volatility of capital flows has increased significantly. In Asian countries, during the current global crisis, capital inflows have increased, leading to excess liquidity and the risk of potential asset bubbles. A sudden reversal of these inflows would have negative effects on the economies in question. Given the impact of global capital mo vements on domestic financial systems and thereby on domestic economies, in several Asian countries certain macro-prudential regulations have been put in place , and capital contr ols and micr o-prudential r egulations ha ve r eemerged as important tools to handle the issues related to capital inflows from outside of the region. In as m uch as capital flows ar e an inte gral component of international finance, which allows for savings to be channelled from surplus countries to deficit countries, it is important to ensure that global imbalances do not become a source of instability. For Asia, the issue – whic h was thoroughly discussed after the Asian crisis a decade a go – is once again emerging as a hot topic. The issue is “using Asian savings for Asian investments” through the de velopment of bond markets and SME’ s financial inclusion. Against the backdrop of hug e potential demands for infr astructure in vestment in the Asian r egion, this note will pr opose the issuance of “infrastructure r evenue bonds” to help de velop bond markets in Asia. Then, to facilitate financial inclusion of SMEs, whic h outn umber other types of business in Asia, this note will also propose creating an SME database and developing regional trust funds. In the subsequent sections, this article will touc h on the follo wing issues: II. Characteristics of Asian economies; III. Global imbalances and capital inflows to Asia; IV. Proposals for Asian financial markets; and V. Remaining Challenges.
82
OECD JOURNAL: FINANCIAL MARKET TRENDS – VOLUME 2012/1 © OECD 2012
Global Imbalances and the Development of Capital Flows among Asian Cou ntries
II. Characteristics of Asian economies 1. High potential growth Asian economies ha ve had r elatively high economic gr owth r ates in r ecent y ears and further strong growth in Asia is expected in the next several years due to the growth of middle income classes. Populations are young in most of Asia. If Asian economies continue to expand, the rate of return in the Asian region will be higher than other regions. There is a huge potential for Asian growth and there are huge opportunities for financial investment in the Asian region.
2. High savings rate and low capital flows among Asian region Asia has shown a very high savings rate. Yet, most of these savings are invested in the U SA and Europe. They are not directly invested in the Asian region due to a lack of financial products and a lack of transparency. But at the same time , it is clear that additional longterm investment in the Asian region will be required.
3. Where do Asian savings go? Emerging economies in Asia ha ve v ery high sa vings r ates, as sho wn in Table 1. It should be possib le to dir ect some portion of these accum ulated high sa vings to ward infrastructure in vestments in the r egion. Ho wever, high sa vings in East Asian countries are not well distributed among Asian countries. Rather, the accumulated high savings are invested typically in domestic deposits, domestic stocks, and overseas government bonds such as U S treasury securities.
Table 1. Savings and investment ratios in Asia Country
Savings/GDP Ratio (%) 2007
2010
Investment/GDP ratio (%) 2011
2007
2010
2011
China Mainland
51.9
53.4
53.8
41.7
48.2
48.7
Hong Kong, China
33.3
29.9
29.2
20.9
23.7
23.8
Indonesia
27.3
33.3
31.1
24.9
32.5
32.9
Japan
28.5
23.8
23.9
23.7
20.2
21.4
Malaysia
37.5
32.9
33.1
21.6
21.4
21.8
Philippines
22.1
24.8
22.3
16.9
20.5
20.5
Singapore
48.4
46.0
45.8
21.1
23.8
26.0
South Korea
31.5
31.9
29.6
29.4
29.2
28.2
Thailand
32.8
30.6
30.4
26.4
25.9
25.6
Note: Savings rate = gross national saving/GDP; Investment rate = Gross capital formation/GDP. Source: IMF, World Economic Outlook Database.
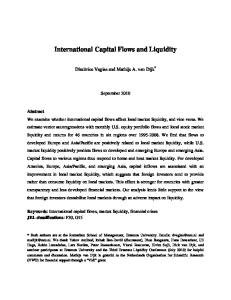
Figure 1 shows three pie charts. The left pie c hart shows where Asians are investing. 42.8% ar e invested in U S securities and stoc ks. Another 37.2% ar e invested in Eur opean financial instruments, while only 8.2% are invested in the Asian region. These investments tend to be longer term such as long-term government securities. The middle pie c hart of Figure 1 sho ws that 37% of the mone y flowing into Asia is coming from the U SA and 30% comes from Europe. These funds are short-term oriented. Only 18% of funds come fr om within Asia. Thus, Asia’s high sa vings ar e dir ected to the U nited States and Europe for long-term investments. By contrast, the portfolio investment that comes fr om o verseas is short term in natur e and is unsta ble. This lac k of sta bility OECD JOURNAL: FINANCIAL MARKET TRENDS – VOLUME 2012/1 © OECD 2012
83
Global Imbalances and the Development of Capital Flows among Asian Cou ntries
was one of the causes of the 1977 Asian financial crisis. U nfortunately, the situation has not improved. The right hand pie chart in Figure 1 shows the case of Europe. There, 65% of funds invested externally are invested within the region.
Figure 1. Portfolio investment from the Asian region to the world and vice versa Direction of Portfolio investment To Asia
From Asia
From Europe
Others;
Others; 11.8% Asia; 8.2%
Asia; 7.7%
USA; USA; 42.8%
USA; 15.7%
Others; 11.1%
13.3%
37.1%
Asia; 18.9%
Europe; 37.2%
Europe; 68.6%
Europe; 30.7%
Source: IMF, Coordinated Portfolio Investment Survey (CIPS).
4. Bank dominated financial system and large share of SMEs Asian economies are often characterised as having bank-dominated financial systems and the bond market has de veloped only slowly (Figure 2). Even though the soundness of the banking system has impr oved significantly since the Asian crisis, the banking sector has been cautious to lend to SMEs, even though such enterprises account for a large share in many dimensions of economic acti vity. Start-up companies, in particular, are finding it increasingly difficult to borrow money from banks due to strict Basel capital requirements. Riskier SMEs will also face difficulty in borrowing money from banks.
Figure 2. Size of financial markets in Asia Equity, bonds and bank loans, as shares of total Equity
%
Bonds
Bank Loans
100 90 80 70 60 50 40 30 20 10 0 China
India
Malaysia
Japan
Korea
Source: Shigesuke K ashiwagi, Nomura Holdings Inc., FSA Financial Research Center International Conference, Japan, Tokyo, February 2011.
84
OECD JOURNAL: FINANCIAL MARKET TRENDS – VOLUME 2012/1 © OECD 2012
Global Imbalances and the Development of Capital Flows among Asian Cou ntries
Figure 3, Table 2 and Figure 4 sho w the shar es of SMEs in the economies of J apan, Thailand and China. In all three countries, in terms of the n umber of firms and the share of employment, SMEs dominate the econom y. Thus, it is quite important to find ways to provide stable finance to SME sectors. In Figure 5, two lines show how difficult or how easy it is to raise money from the markets. One line shows the difficulty faced by large companies and the other sho ws the same for SME companies. Data points belo w zero indicate that companies are finding it difficult to raise money from banks or the capital markets. SMEs appear to face difficulties most of the time in observation period covered.
Figure 3. Share of SMEs in Japan Large enterprises
SMEs
Sales (in JPY bn)
Number of employees (in thousand)
Number of companies (in thousand) 13 0.3%
13 710 31.4% 131 600 48.8%
37 800 51.2% 29 960 68.6%
4 690 99.7% Source: White paper on SMEs, Japanese government, METI, 2011.
Table 2. Share of SMEs in Thailand Type of enterprise SMEs Large enterprises and others Total
No. of enterprises (% of total)
No. of employees (% of total)
GDP contr. in mill. Baht (% of total)
2 366 227
8 900 567
3 244 974
(99.6%)
(76.0%)
(38.2%)
9 141
2 810 767
5 239 226
(0.4%)
(24.0%)
(61.8%)
2 375 368
11 711 334
8 484 200
(100.0%)
(100.0%)
(100.0%)
Source: Yoshino, Suzuki, Maehara and Abe (2009), Development of Corporate Credit Information Database and Credit Guarantee System, ASEAN Secretariat, Feb. 2009.
OECD JOURNAL: FINANCIAL MARKET TRENDS – VOLUME 2012/1 © OECD 2012
85
Global Imbalances and the Development of Capital Flows among Asian Cou ntries
Figure 4. Share of SMEs in China Large enterprises Number of enterprises
SMEs
Urban employment
GDP
1%
25%
44% 56%
75% 99%
Export
Tax
38%
43%
62%
57%
Source: Department of SMEs, China National Development and Reform Commission, June 2004.
Figure 5. Financial position Financing conditions of large versus small enterprises, in percentage points (ppt) Large enterprises
ppt
Small enterprises
30 20
tighening A. Titre
10 0 -10 -20
easing
19 90 19 91 19 92 19 93 19 94 19 95 19 96 19 97 19 98 19 99 20 00 20 01 20 02 20 03 20 04 20 05 20 06 20 07 20 08 20 09 20 10 20 11 20 12
-30
Source: Bank of Japan, Short-term Economic Survey of Enterprises in Japan (TANK AN).
5. Asian bond markets and Asian capital markets The 1997 financial crisis in Asia substantially emphasised the need for de bt markets in Asia to c hannel r egional savings into r egional investments. Therefore, to support the development of the market infr astructure of the bond market, the suppl y side of the
86
OECD JOURNAL: FINANCIAL MARKET TRENDS – VOLUME 2012/1 © OECD 2012
Global Imbalances and the Development of Capital Flows among Asian Cou ntries
market, the Asian Bond Markets Initiative (ABMI) promotes the development of an Asian regional bond market to circulate inter-regionally the highly accumulated savings in Asia. The Executives’ Meeting of EastAsia Pacific Central Banks (EMEAP) is a forum of central banks and monetary authorities in the East Asia and Pacific region set up for strengthening cooperation among its members. From the demand side , EMEAP alr eady established the Asian Bond Funds (ABF1 & 2) to purchase government bonds issued in the region in order to promote the de velopment of r egional bond markets and to cir culate the accum ulated funds within the r egion. However, the capital tr ansactions in the r egion are not so acti ve while the size of the tr ade of goods is v ery large and GDP gr owth is also brisk compar ed with that of the U S and the EU. At the initial stage of ABMI, the governments in the region have been endeavoring to nurture and develop the domestic market in order to create benchmark yield curves. Thus, it has been supply-driven growth by the governments. However, Asian countries ar e confr onting difficulties such as differing sta ges of development of the r egion’s financial markets and heterogeneous legal and institutional systems. Additionally, the needs of continually issuing government bonds are very limited, owing in part to v ery large holdings of for eign exchange reserves by virtue of the curr ent account surplus and the fiscal surplus of the governments in some countries. The current situation in Asia is that Asian countries accumulated foreign exchange reserves to guard against the recurrence of a future financial crisis and they invested their savings in the U S in the form of U S government bonds and in Europe rather than in Asia. Therefore, for the ne xt stage of ABMI, the growth of the bond market should be dri ven by the investment demands and financing needs of market participants.1
6. Foreign exchange holdings in Asia since the crisis In 2006, China held U SD 877.6 billion and J apan held U SD 837.7 billion in for eign exchange r eserves, and ASEAN+3 countries held U SD 2.25 trillion in for eign e xchange reserves ( Table 3). The shar e of for eign e xchange holdings b y Asian countries has been rapidly increasing especially since the crisis. This excessive dependence on the U S dollar exposes them to risks of a sudden r eversal of for eign capital flows and the r ecurrence of a currency crisis. It also r aises the possibility that Asian countries ma y face losses fr om any w eakening of the dollar , because most Asian countries hold their for eign e xchange reserves in the form of U S dollars. Central banks in the r egion have endeavored to sterilise the potential e xpansionary effects of incr easing foreign reserves on their domestic mone y supply and cr edit mainly through open market operations or reserve requirements in order to stabilise the exchange rates as well as to retain control over monetary policy. China, Malaysia and Thailand have depended hea vily on this sterilisation polic y (W orld Bank, 2008). The e xcessive curr ent account surplus has r esulted in a marked incr ease in liquidity , which has consequentl y spurred an o verheating of the econom y and an in vestment boom. But the sterilisation policy tends to make domestic interest rates higher than otherwise, which serves to attract more capital inflows. It also causes the central banks to pay the opportunity cost by holding the reserves as well as the loss from paying interest on the liabilities issued to sterilise the capital inflows.
OECD JOURNAL: FINANCIAL MARKET TRENDS – VOLUME 2012/1 © OECD 2012
87
Global Imbalances and the Development of Capital Flows among Asian Cou ntries
Table 3. Foreign exchange reserves of ASEAN+3 countries As of March 2006 Country
US dollar (in thousand)
China
877 637 000
Japan
837 712 000
South Korea
217 271 000
Singapore
121 412 000
Malaysia
73 097 100
Thailand
53 709 300
Indonesia
38 172 300
Philippines
17 848 000
Vietnam
10 742 000
Cambodia
1 007 340
Myanmar
890 021
Brunei
480 349
Lao PDR Total
249 478 2 250 227 888
Source: IMF, International Financial Statistics.
7. Biased securities investment in Asia In r ecent y ears, a high per centage of the U S curr ent account deficit has been supplemented b y in vestments into U S go vernment bonds and for eign e xchange holdings of Asian countries. The funds accum ulated in Asia flow into the U S and European countries and a large proportion of these funds return to Asia in the form of U S investment or by hedge funds. It is w orth noting that this intermediation of funds is largely handled b y financial institutions and settlement systems outside the Asian region. This situation might lead to a hollowing-out of financial intermediary functions in Asia. Most Asian countries invest their high sa vings mainly in Europe (41%), the U S and Canada (32%) and onl y 4% of de bt securities in vestment is made in Asia ( Figure 6). Looking at the investment pattern of debt securities in Asian countries, 56% of total debt securities investment in Asia is made by the EU, the U S & Canada. And Asian countries’ investment in Asia amounts to onl y 17% of total de bt securities in vestment (Figure 7). These statistics sho w the bias and slugg ishness of Asian countries’ in vestments into the Asian r egion compar ed with those into the E U and the U S, e ven though ther e is relatively less financial information and there are fewer financial products in Asia than in the EU or the U S. One of the lessons dr awn fr om the financial crisis of 1997 was that alternati ve intermediary mec hanisms to lo wer the e xcessive de pendence on bank financing and to provide long-term local currency funding need to be established. To this end, the development of efficient and systematic cross-border intermediation of regional surplus savings and foreign exchange holdings through regional bond markets is important.
88
OECD JOURNAL: FINANCIAL MARKET TRENDS – VOLUME 2012/1 © OECD 2012
Global Imbalances and the Development of Capital Flows among Asian Cou ntries
Figure 6. Debt securities investment from Asia In millions of U S dollar and as share of total, 2004
Others 451 826 23%
Asia 75 531 4%
EU 834 866 41%
USA & Canada 635 444 32% Source: IMF, Portfolio Investment: Coordinated Portfolio Investment Survey (CPIS).
Figure 7. Debt securities investment in Asia In millions of U S dollar and as share of total, 2004
Others 115 328 27%
USA & Canada 66 051 15%
Asia 73 512 17%
EU 178 501 41%
Source: IMF, Portfolio Investment: Coordinated Portfolio Investment Survey (CPIS).
OECD JOURNAL: FINANCIAL MARKET TRENDS – VOLUME 2012/1 © OECD 2012
89
Global Imbalances and the Development of Capital Flows among Asian Cou ntries
III. Global imbalances and capital inflows to Asia 1. Global imbalance and excess supply of US dollars When a curr ency is used e xtensively in international tr ansactions, suc h as British pounds in the early 1900s and the U S dollar in recent decades, the country can in effect “print money” to cope with curr ent account deficits. British pounds had been printed to cope with current account deficits in the 1950s, but the value of British pounds kept falling and eventually it lost its status as an international means of transaction and as a store of value. British pounds were replaced by U S dollars. If the curr ency is used as a means of tr ansaction, a go vernment can print mone y even if it is faced with curr ent account deficits. However, the v alue of the ke y currency gradually depreciates due to excess supply. Other currencies start to appreciate against the key currency. Investors in the ke y currency country will e xperience massive liquidity infusion due to an excessive creation of the key currency to cope with current account deficits. This huge volume of liquidity starts to look for investment opportunities (Figure 8). Some Asian counties have become the tar get of portfolio in vestment by investors in the ke y currency country. Short-term capital flows to some Asian economies have increased. Countries that have current account surpluses, such as China, Korea, and Japan, have tended to accum ulate U S dollars as foreign r eserves at their centr al bank. The centr al banks of surplus countries buy U S Treasury securities as the best in vestment since the accumulated foreign reserves are U S dollars and their in vestments are also denominated in the U S dollar ( i.e. U S Treasury securities; see Figures 9 and 10). This will continue until the value of the U S dollar is expected to depreciate substantially. As a matter of fact, China seems to have started to diversify its central bank’s foreign reserves from U S dollar to euro, Japanese yen and other currencies. Yet, Asian investors are inclined to look for safer assets abroad and the y have tended to in vest in U S tr easury securities. Tables 4 and 5 pr ovide details on cross-border portfolio investment by and in Asian countries.
Figure 8. Excess liquidity created by huge money supply Interest Rate
Outflow To Overseas
Increase in Money Supply
Money Demand
Money Demand and Money Supply Source: Author.
90
OECD JOURNAL: FINANCIAL MARKET TRENDS – VOLUME 2012/1 © OECD 2012
Global Imbalances and the Development of Capital Flows among Asian Cou ntries
Figure 9. US Treasury bond holdings by type of investor Pension funds 8%
Others 2%
Government/local government 6% Central bank 8% Insurance companies 2% Banks 2%
Overseas investors 54%
Mutual funds 13% Individuals 5%
Source: U S Treasury.
Figure 10. US Treasury bond holdings by country India 1.2% Singapore 1.2% Ireland 1.7% Germany 1.7% Switzerland 2.1% ChineseTaipeh 2.3% Hong Kong, China 2.4%
China 23.5%
Luxembourg 3.2% Brazil 3.9% United Kingdom 3.9% Russia 4.2%
Oil producing countries 5.9% Caribbean countries 6.5%
Japan 21.0%
Source: U S Treasury.
OECD JOURNAL: FINANCIAL MARKET TRENDS – VOLUME 2012/1 © OECD 2012
91
Global Imbalances and the Development of Capital Flows among Asian Cou ntries
Table 4. Where are Asian countries investing? In billions of U S dollar, 2005
Country
Target country
Totals
Thailand
No1 EU
110.85
Total=402.83
No2 USA
105.98
No3 Singapore
44.76
No4 Hong Kong, China
22.19
No5 Japan No1 EU
Total=496.67
No2 Singapore
81.74
No3 USA
52.25
No4 Hong Kong, China
22.75
145.28
No1 USA
363.61
Total=812.3
No2 EU
235.98
No3 Hong Kong, China
70.97
No4 Japan
44.51
No1 EU
538.10
Total=1 374.93
No2 USA
462.25
No3 Singapore
137.46 46.52
Indonesia
No1 USA
90.25
Total=291.53
No2 EU
79.27
No3 Singapore
63.32
No4 Mauritius
38.23
No1 EU
Total=2390.96
No2 Hong Kong, China
95.53
No3 USA
82.43
No4 Japan
53.91
744.6
3.84
66.95
73.23
5.11
107.21
119.91
8.85
289.94
225.19
22.97
30.66
45.66
2.95
346.56
364.03
33.87
33.60
61.66
6.19
1 959.36
2 751.79
575.90
45.62
Philippines
No1 EU
Total=219.85
No2 USA
71.79
No3 Japan
13.82
No4 Hong Kong, China
11.19
No5 Singapore
67.57
5.73
South Korea
No5 Singapore
39.44
82.94
No5 Bermuda
No5 Japan
Other Europe
9.32
Hong Kong, China
No4 Japan
Euro area
5.64
Singapore
No5 Switzerland
UK
7.46
Malaysia
No5 Switzerland
EU
101.45
9.48
Japan
No1 EU
5 287.05
Total=15 424.21
No2 USA
5 200.84
No3 Canada
339.04
No4 Norway
211.47
No5 Switzerland
185.58
Source: IMF, Portfolio Investment: Coordinated Portfolio Investment Survey (CPIS).
92
OECD JOURNAL: FINANCIAL MARKET TRENDS – VOLUME 2012/1 © OECD 2012
Global Imbalances and the Development of Capital Flows among Asian Cou ntries
Table 5. Where are investors into Asian countries based? In billions of U S dollar, 2005 Country
Country
Billion US dollars
Thailand
No1 EU
10.33
Total=3 108
No2 US
8.88
No3 Singapore
1.80
No4 Indonesia
1.57
No5 Hong Kong, China
EU countries UK
Euro area
Other Europe
4.57
5.67
0.09
5.57
7.54
0.07
356.82
260.54
11.91
695.14
552.09
0.00
2.19
1.68
0.00
24.04
113.64
1.54
10.30
7.44
0.30
1 139.91
6 012.74
396.99
1.55
Malaysia
No1 EU
Total=3 781
No2 Singapore
7.51
No3 USA
5.67
No4 Hong Kong, China
1.96
13.18
No5 Australia
1.43
Singapore
No1 EU
629.28
Total=2 016.86
No2 USA
290.31
No3 Australia
169.66
No4 Malaysia
167.83
No5 South Korea
90.30
Hong Kong, China
No1 EU
Total=4 365.57
No2 USA
581.56
No3 Cayman Islands
548.15
No4 Bermuda
450.65
No5 China P.R.
412.99
1 291.81
Indonesia
No1 EU
3.87
Total=11.66
No2 Singapore
2.17
No3 Australia
2.03
No4 USA
1.12
No5 China P.R.
1.02
South Korea
No1 USA
196.68
Total=436.65
No2 EU
139.19
No3 Cayman Islands
36.84
No4 Japan
14.63
No5 Hong Kong, China
10.18
Philippines
No1 USA
21.15
Total=48.51
No2 EU
18.04
No3 Singapore
1.63
No4 Australia
1.10
No5 Russia
0.98
Japan
No1 EU
7 549.64
Total=21 148.88
No2 USA
7 477.47
No3 Cayman Islands
2 976.69
No4 Australia
449.53
No5 Canada
415.53
Source: IMF, Portfolio Investment: Coordinated Portfolio Investment Survey (CPIS).
2. Capital Inflows to Asia U nder the structur e mentioned a bove, the r elatively high gr owth r ates of Asian economies, along with their relatively high inter est r ates, ha ve been attr acting for eign investors. This has r esulted in hug e capital inflows, leading to e xcess liquidity and increasing the risk of asset bubb les building up ( Figures 11 and 12). A sudden r eversal of these inflows would render the impact of any bubble-bursting more severe.
OECD JOURNAL: FINANCIAL MARKET TRENDS – VOLUME 2012/1 © OECD 2012
93
Global Imbalances and the Development of Capital Flows among Asian Cou ntries
Figure 11. Net capital inflows, quarterly Philippines
Hong Kong, China
Singapore
Indonesia
Malaysia
Million USD 250 A. Titre
200 150 100 50 0 -50
,2 00 6 Se pt ,2 00 6 De c, 20 06 M ar ch ,2 00 7 Ju ne ,2 00 7 Se pt ,2 00 7 De c, 20 07 M ar ch ,2 00 8 Ju ne ,2 00 8 Se pt ,2 00 8 De c, 20 08 M ar ch ,2 00 9 Ju ne ,2 00 9 Se pt ,2 00 9 De c, 20 09 M ar ch ,2 01 0
ne Ju
M
ar ch
,2
00 6
-100
Source: CEIC; Shimada and Yang (2010).
Figure 12. External short-term debt, annual Indonesia
Malaysia
Philippines
Thailand
Vietnam
Billion USD 50 45 40 35 30 25 20 15 10 5
20 09
20 08
20 07
20 06
20 05
20 04
20 03
20 02
20 01
20 00
19 99
19 98
19 97
19 96
19 95
19 94
19 93
19 92
19 91
19 90
0
Sources: World Bank, BSP, SINGSTAT, BNM, JEDH; Shimada and Yang (2010).
The earl y sta ges of r ecovery fr om the curr ent crisis ha ve seen global imbalances widening once again, with an increase in underlying deficits and surpluses. This tendency might continue for the time being. At the same time, economic growth of most developed countries has been slowing, despite their loose monetary policies. This contrasts with the higher economic growth of emerging economies and their tighter monetary policy stances. This is fostering capital flows from developed to emerging economies. These investments are not only coming from the so-called ‘carry traders’. Even institutional in vestors fr om de veloped countries ar e sear ching for yield in emer ging countries. These inflows cr eate upw ard pr essure on the pr operty and stoc k markets, as well as on the curr encies of emer ging economies, or, where the latter is r esisted, lead to expanding official reserve positions.
94
OECD JOURNAL: FINANCIAL MARKET TRENDS – VOLUME 2012/1 © OECD 2012
Global Imbalances and the Development of Capital Flows among Asian Cou ntries
To r educe market turbulences caused b y suc h capital mo vements, se veral Asian economies have also adopted specific macro-prudential or capital-contr ol measures (see Box 1, which discusses the case of real estate market turbulence).
Box 1. Slow adjustment of property markets and bubble indicators 1. (Subprime) mortgage loan crises and other bubbles are often initiated by easy monetary policy. When the econom y is facing a do wnturn, the centr al bank tries to help boost its economy. It introduces an easy monetary policy by lowering interest rates and increasing the money supply. The stock market often r eacts to this easy monetar y policy and stoc k prices are gradually going up. 2. Rising stoc k prices lead to an incr ease of consumption thr ough the w ealth effect. Higher stock prices lead corporations to take optimistic views of the economy. Companies are faced with rising demand for their products. Sales will be increasing and the business conditions look v ery good. Corpor ations start to e xpand their pr oduction and r eal economic growth starts to rise. Corporate investments will increase and consumers enjoy rising incomes. Ev erybody seems to w elcome the loose monetar y polic y (F ed Chairman Greenspan was highly appraised for his “excellent” monetary policy). 3. Housing markets are booming and banks started to lend their money to lower income individuals since the value of their collateral, i.e. house prices, is increasing. This could be observed in Japan’s asset price bubble as well as the recent U S subprime loan crisis. 4. The real estate market is v ery slow in its adjustment in the sense that housing starts are increasing only after se veral quarters. When one bank incr eases its housing loans to low-income individuals, given the rising housing prices, i.e. collateral values, its behaviour is rational: the overall housing prices are scarcely affected by a few (small) banks’ aggressive property lending. 5. However, if many banks follow the same behaviour increasing their (subprime) housing loans assuming that the collater al value of the housing price will kee p on going up , the market price of housing will start to decline as the a ggregate supply curve of housing starts shifting to the right, lowering the market clearing price of housing. 6. Furthermore, an increase of the housing loan suppl y can be accelerated by securitisation of mortg age loans, enhanced b y high cr edit r atings b y internationall y r enowned cr edit rating agencies. 7. Ratings given for securitised subprime housing loans tend to be too high given the assumption and believe that house prices will kee p on going up . It w as exactly the same phenomenon that was observed in the Japanese asset price bubbles. 8. The go vernor of the concerned centr al bank w ould like to stop the o verheating of the economy in advance of a r eal estate market collapse . However, people appreciate the “excellent” monetar y polic y as long as housing prices kee p on rising and the economic conditions are good. 9. The real estate market is v ery slow to adjust to market conditions. There is al ways a delay to adjust to the changes in house prices. As long as they are increasing, many banks would like to lend money for housing construction. This creates excess supply of housing since there are always time la gs in the r eal estate market. When the market r ealises the excess supply of housing construction reflected in a falling housing price, it is too late. 10. Borrowers cannot repay their loans since the economic do wnturn leads to a dr op in their income and the collateral value of real estate starts to go down. Sluggish adjustment of the pr operty market leads to housing starts not r esponding quickly to the c hanges in housing markets.
OECD JOURNAL: FINANCIAL MARKET TRENDS – VOLUME 2012/1 © OECD 2012
95
Global Imbalances and the Development of Capital Flows among Asian Cou ntries
●● Bank Indonesia (BI) intr
oduced polic y pac kages in J une 2010 to mana ge liquidity , as well as to encourage banks to conduct more transactions in the secondary market. This includes the implementation of a one-month minim um holding period for buyers of Bank Indonesia certificates in the primary and secondar y markets. BI incr eased the primar y reserve requirements on both foreign and local currency deposits to 8%, from previous levels of 1% and 5%, respectively. BI also r e-imposed a limit on banks’ e xternal shortterm borrowing to 30% of capital in January 2011, limiting their capacity to intermediate short-term inflows.
●● Since the 1990s,
Hong Kong, China, has adopted a 70% loan-to-v alue r atio cap for residential mortgages as part of its banking industr y oversight. Hong Kong, China, has also had a 60% loan-to-value ratio cap for luxury properties since 2009.
●● Singapore also has a loan-to-v
alue limit for r esidential loans; in F ebruary 2010, it strengthened this measur e b y lo wering the cap fr om 80% to 70% and b y pr ohibiting “interest-only” mortgages.
●● In October 2010, Thailand introduced a 15% withholding tax on inter
est payments and
capital gains on bonds held by foreign investors. Yet, the effects of these types of measur es might not last for an e xtended period of time, because of potential loopholes. Considering such possibilities, it might be better to consider these measur es as tempor ary. Treating suc h measur es as tempor ary might help a void distorting the efficiency and effecti veness of financial markets too much.2 Coordinated m ultilateral actions ar e needed for a lasting solution. The ne xt section will consider how to corr ect the global imbalances or mitig ate their deleterious effects with focus on the practical way forward for Asian countries.
IV. The way ahead Structural reforms can contribute to correct the global imbalances or mitigate their deleterious effects. These structural reforms might include the following elements:
●● encouraging saving in deficit countries, by removing distortive features such as of
the
mortgage systems in several developing countries;
●● enhancing channels of
Asian saving into Asian investments. If suc h measures help to reorient capital flows toward the longer-term, they would have further beneficial effects.
This section will focus on the latter issues. The follo wing discussion will take particular note of infrastructure project financing and funding for SMEs. These policies will accelerate portfolio investment into the Asian region. Furthermore, Asian investors such as pension funds and insurance companies will be growing. They will be looking for longterm portfolio investments.3 Infrastructure revenue bonds will be good financial products in which they can invest.
1. Infrastructure project financing Asian countries require huge infrastructure investment in the next decade. Expanding infrastructure project financing will contribute to enhance the channelling of Asian savings into Asian investments. This discussion will be gin with a r eview of the c urrent state of infrastructure project financing, followed by an anal ysis of the options for infr astructure finance and finally by a proposal which could develop Asian bond markets.
96
OECD JOURNAL: FINANCIAL MARKET TRENDS – VOLUME 2012/1 © OECD 2012
Global Imbalances and the Development of Capital Flows among Asian Cou ntries
2. Current state of infrastructure project financing in Asia Private investment in infrastructure project since the crisis Optimistic vie ws ar e pr evalent for the high gr owth potential in Asia. In particular , rapid growth of China and Southeast Asia and the de velopment of social and economic infrastructure attr acted local and international in vestments thr ough incr easing pri vate sector participation until the midst of the 1990s.And local debt markets in several countries such as Malaysia, Indonesia and Thailand were emerging with financing for infrastructure projects. But these nascent de bt markets suffer ed fr om a narr ow in vestor base , limited ratings capacity, primitive and restrictive legal and regulatory frameworks, and the lack of a benchmark yield curve, especially for long-term maturities. The financial crisis of 1997 led to a deterioration of Asian financial markets and financing conditions for private in vestments. As a consequence , pri vate in vestment in infr astructure pr ojects sharpl y declined, whic h had a ne gative impact on lar ge-scale infrastructure project financing (Figure 13). A large share of private investments take the form of medium and long-term loans that ar e funded with the short-term de posits of banks. As suc h, g iven the maturity mismatc h, it is not a sustaina ble financing vehicle, especially when banks are exposed to the systemic risk by the economic or financial crisis.
Figure 13. Trends of total private investment in infrastructure projects in Asia China
Indonesia
Malaysia
Philippines
Thailand
Vietnam
Millions of USD 14 000 12 000 10 000 8 000 6 000 4 000 2 000
05 20
04 20
03 20
02 20
01 20
00 20
99 19
98 19
97 19
96 19
95 19
94 19
93 19
92 19
91 19
19
90
0
Source: World Bank, http://ppi.worldbank.org/book.
Financing needs and gaps With the r ecovery of Asian countries fr om the crisis market participants e xpect the infrastructure sector will be pr omising and pr ofitable and, accordingly, pri vate investments should also rise . Ho wever, the Asian r egion faces the sim ultaneous c hallenges of hug e infrastructure investment needs and vast financing gaps. A joint study of the World Bank, ADB and JBIC shows that the financing needs for infrastructure amounted toUSD 228 billion per year during the 2006-2010 period, but only USD 48 billion could be r aised to finance infrastructure projects (Table 6). A UN ESCAP study also shows financing needs in the Asia and Pacific region on the order of USD 608 billion per year, but a financing gap of USD 220 billion still exists. OECD JOURNAL: FINANCIAL MARKET TRENDS – VOLUME 2012/1 © OECD 2012
97
Global Imbalances and the Development of Capital Flows among Asian Cou ntries
Table 6. Estimates of annual infrastructure financing needs Infrastructure Needs Estimate (billion USD)
Financing Gap (billion USD)
ADB, JBIC and World Bank
228
180
Asia-Pacific Infrastructure Forum
300
UN ESCAP
608
Source
220
Source: U N ESCAP (2006).
Double Mismatch Problem in Project Finance Table 7 shows the financing composition of the infrastructure projects: bond finance (7.9%), bank finance (80.4%), and equity finance (11.8%). Seen from that table, there are two mismatches in the project financing. One is the maturity mismatch because most long-term projects are financed by transforming mostly short-term deposits into bank loans (80.4%). And the other is the curr ency mismatch because pr oject r evenues ar e generated in local curr ency but the pr ojects are financed in foreign currency (72.9%). Furthermore, exchange rate fluctuations and limited convertibility and transferability of curr encies impose an additional risk bur den on for eign in vestors and financiers. Therefore, efficient long-term debt markets in the r egion should be de veloped to bridge the financing gap and to provide more stable finance for infrastructure projects. Given the vast financing needs and the sizable funding gap, and taking into account the merits of bond financing especially in the case of infrastructure projects, a regional infrastructure bond market can pr omote the de velopment of Asian bond markets in the context of the ABMI.
Table 7. Project financing by market and instruments In millions of U S dollar (and per cent of total) Bond (F)
Bond (D)
Loan (F)
Loan (D)
Equity (F)
Equity (D)
Total
0
0
0.75 (100)
0
0
0
0.75
China (Mainland)
1 812.20 (5.0)
603.90 (1.7)
24 493.99 (67.3)
5 336.55 (14.7)
4 172 00 (11.5)
0
36 418.64
Hong Kong, China
91.72 (0.3)
38.80 (0.1)
14 885.00 (55.1)
8 758.23 (32.4)
2 790.00 (10.3)
457.89 (1.7)
27 021.64
Indonesia
1 280.00 (4.5)
0
20 985.33 (74.5)
2 523.93 (9.0)
3 314.43 (11.8)
69.49 (0.2)
28 173.18
Malaysia
528.95 (2.5)
4 783.59 (22.6)
3 229.13 (15.3)
10 396.26 (49.1)
1 147.32 (5.4)
1 077.19 (5.1)
21 162.44
Myanmar
0
0
29.80 (100)
0
0
0
29.80
Philippines
2 027.50 (14.1)
0
10 661.56 (73.9)
34.47 (0.2)
1 697.50 (11.8)
0
14 421.03
Singapore
0
0
2 027.00 (66.7)
924.26 (30.4)
0
87.33 (2.9)
3 038.59
Thailand
180.00 (1.2)
294.55 (2.0)
7 912.49 (54.7)
3 864.72 (26.7)
1 454.36 (10.0)
767.38 (5.3)
14 473.50
Vietnam
0
0
2 347.703.00 (89.9)
18.00 (0.7)
246.00 (9.4)
0
2 611.70
5 920.37 (4.0)
5 720.84 (3.9)
86 572.753.00 (58.8)
31 856.42 (21.6)
14 821.61 (10.1)
2 459.28 (1.7)
147 351.273.00
Cambodia
Total
Note: (D) stands for domestic currency and (F) for foreign currency. Source: Kotecha and Sharon (2004).
98
OECD JOURNAL: FINANCIAL MARKET TRENDS – VOLUME 2012/1 © OECD 2012
Global Imbalances and the Development of Capital Flows among Asian Cou ntries
Bank financing versus bond financing In comparing bank financing with bond financing in project financing, it is w orth noting that bank loans ar e often made via dir ect r elationships betw een a lender and a borrower and can be c haracterised as a ne gotiable financing tool, with suc h featur es as flexible disbursement and r escheduling of repayment. Conditions and terms of loans can be negotiated between the contracting parties through clause amendments and waivers of loan agreements. Banks assess the creditworthiness of prospective borrowers (or projects) and discern safe borrowers from those perceived as less safe. After a loan has been extended, banks often monitor the borrower’s business to guard against moral hazard. Activities such as information g athering and monitoring ar e conducted on a bilater al basis betw een the borrower and the lender. On the other hand, bond issuance could be described as the dir ect financing via financial markets from a broad base of investors. In order to issue bonds, a firm’s financial conditions ar e scrutinised and r ated and the information g athered in the pr ocess is open to the pub lic if necessar y. U nderwriting is important for the dissemination of a debtor’s information to the pub lic as w ell as for the tr eatment of risks r elated to pub lic offers. Bonds ar e standar dised financial vehicles and, most importantl y, financing tools transferable thr ough capital markets. This kind of bond financing is especially suited to the financing needs of infrastructure projects that ha ve long g estation periods and need large amount of funds for construction and maintenance of social infr astructures. Given this inherent nature of infrastructure projects, bond financing is a better alternative since bank financing cannot match the long g estation periods and lar ge funds r equired in an industry that is c haracterised by capital intensity . In this v ein, bank lending is also less suited for infrastructure projects because of single lending limits and lar ge credit control and concentration risks.
3. Source of financing infrastructure investment: pros and cons How to finance infrastructure is crucial for supporting stable economic development in Asia. Infrastructure construction can be financed by the following four financing methods:
i) by using tax payers’ money;
ii) by using national sa vings such as those collected via national sa vings banks (or postal savings);
iii) by issuance of government bonds to construct infrastructures;
iv) by using both public money and private sector money, i.e. Public-Private-Partnerships.
By tax payers’ money One of the w ays to finance infrastructure investment is b y the use of tax r evenues. U se of tax payers’ money may provide stable funding for an infrastructure investment. Yet, if tax revenues are used for infrastructure investments, the allocation of money into hard infrastructure becomes politicall y determined. The distortion of budg et allocation might result in an inefficient allocation of capital in an economy. These risks w ould tend to be greater in an emerging economy. Political powers tend to construct infrastructure to satisfy their own constituencies to benefit their voters rather than meet criteria for economic priorities. In addition, some emerging economies ar e often faced with a lac k of adequate tax collection. Sometimes, loopholes in tax collection ar e seen in emer ging economies.
OECD JOURNAL: FINANCIAL MARKET TRENDS – VOLUME 2012/1 © OECD 2012
99
Global Imbalances and the Development of Capital Flows among Asian Cou ntries
Thus, some emerging economies lack a sufficient amount of tax revenues to finance their infrastructure needs.
Use of national savings such as national savings banks (or postal savings) If domestically collected savings could be c hannelled into infrastructure investment, the amount of sa vings available would be enough to finance infrastructure in the Asian region. Infr astructure in vestments ar e long er term oriented and the economic gr owth expected in many emerging South East Asian economies would produce higher yields for investors in the region. Long-term investments into infrastructure would match the needs of pension funds and life insur ance companies, which are expected to be gr owing in the East Asian region. However, the allocation of national sa vings into infr astructure in vestments often suffers from a lack of transparency. Some infrastructure investments are implemented in certain regions where political power is strong, or unnecessary infrastructure is constructed due to political r easons. The reasons for a distortion of infr astructure investment comes from the non-transparency of decision making for infrastructure investments and a lack of ex-post performance data regarding infrastructure.
Issuance of government bonds to construct infrastructures If a go vernment wants to finance infrastructure by issuing government bonds, the maturity of the bond has to be long term so that it matc hes the infrastructure needs, even if the bond market is not well developed. The priorities of an infrastructure investment often depend entirely on the political process, which lacks transparency. In such circumstances, issuing government bonds might not attract rational investors.
Public-Private-Partnership Having infrastructure investment financed by public-private partnership through the use of r evenue bonds for a specific infrastructure pr oject w ould make the performance of the infr astructure investments more transparent, as judg ed by their r ates of r eturn. If sufficient interest rates cannot be paid to the investors, it could be possible to compensate them with a minim um r ate of r eturn guar anteed b y the go vernment, whic h will be discussed in a later section of this paper. Government loans often obscure the soft budget problem due to a lac k of tr ansparency regarding of the r ates of r eturn on infr astructure investments. In order to avoid these deficiencies, it is required to disclose the reasons why a specific infrastructure is chosen for construction and its expected rate of return and the ex-post rate of return has to be revealed to the public. With infrastructure revenue bonds, it is possible to make ex-post performance data available to the pub lic. Ev en if national sa vings ar e used for infr astructure in vestments through the issuance of infrastructure revenue bonds (IRBs) proposed in this paper, the rate of return on IRBs is determined by the performance of the infrastructure projects they finance. Suppose a toll road constructed and financed by an IRB has a high usage, the rate of return on the IRB will be high. Investors can compare various IRBs and can watch their performance. If some toll highway does not perform well and its rate of return is lower than originally expected, there will be pressure by the IRB investors to explain why the rate of return is low. This may be due to bad management of the project and there will be pressure by investors to impr ove the pr oject’s use in or der to r aise its r ate of r eturn. Transparency
100
OECD JOURNAL: FINANCIAL MARKET TRENDS – VOLUME 2012/1 © OECD 2012
Global Imbalances and the Development of Capital Flows among Asian Cou ntries
of the r ates of r eturn on eac h toll r oad should e ventually lead to an impr ovement in the management of the toll highway corporation in charge. The selection of infrastructure investments is in many countries decided through a political process. For example, it is politically determined whether an urban or an inter city highway is being constructed first. Should roads in rural region be constructed first? Should ports have priority compar ed with r oads? All of these priorities ar e not marketbased but ar e based on political decisions. Ho wever, an IRB will pr ovide an economic basis for deciding on priorities based on its expected future rate of return. As illustrated in Figure 14, the priority for an investment is evident in the case where the rate of return r on an infr astructure investment is expected to be at point B . At this point, the e xpected rate of r eturn is higher than the yield on a go vernment benchmark bond rG, and it is also higher than those of various alternative projects depicted by points A, C and D. The latter two are also below the benchmark yield. Therefore, private investors would not want to invest in project C or D, but rather in project B or, at the limit, in project A, depending on these projects’ risk-return characteristics. Given such expected rates of return there is no need to rely on a political decision to establish investment priorities.
Figure 14. Expected rates of return on project bonds vs. benchmark yield r
B
rG
A C D
Source: Author.
Revenue bonds can help to pr omote the de velopment of bond markets in Asia. At pr esent, within the curr ent financial systems in Asia, infr astructure construction depends hea vily on bank finance and foreign borr owing, as mentioned a bove. Local currency denominated revenue bonds can mitigate the double mismatch problems and moral hazard problem caused by government bonds or guarantees that secure principal and inter est pa yments e ven when pr ojects fail, since the r evenue bonds ar e secur ed only b y futur e cash flows (r evenues) g enerated b y the pr ojects the y finance. Re venue bonds also help di versifying pr oject financing and lowering the o ver-dependence on bank loans. In most Asian countries it is difficult to issue revenue bonds, like m unicipal bonds in the U nited States, because of a lac k of institutional factors suc h as (regional) monoline insurance companies, bankruptc y la w with appr opriate bankruptcy pr ocedures, and credible regional rating agencies. Thus a framework for revenue bonds needs to be carefully designed (see Box 2 for such a proposal).
OECD JOURNAL: FINANCIAL MARKET TRENDS – VOLUME 2012/1 © OECD 2012
101
Global Imbalances and the Development of Capital Flows among Asian Cou ntries
Box 2. Proposal for the development of a revenue bond scheme Revenue Bond Scheme in Asia
Existing Infrastructure
Variable rate revenue bond
Transparency Market discipline
Investors
Step-in rights
Fixed rate revenue bond Securitise 60% of actual revenue
Bank loan
Internal enhancement Direct payment
Market
Tax or public money injection
attractiveness
From the perspecti ve of market attr activeness, Asia does not ha ve r egional monoline insurance companies to provide credit guarantees for revenue bonds as is the case in the U nited States. So a fixed portion of public (or tax) money is injected by governments at the initial stage and dir ect payments which are made under the pr e-determined conditions a will function as internal enhancement which consequently can enhance the credit rating of the project. The amount of this public injection can be adjusted to achieve an appropriate market interest rate of the issued revenue bond for investors. From the perspecti ve of market discipline , the r eturns on v ariable rate revenue bonds (revenue-linked bonds) are linked directly to the future cash flows generated by the projects making the performance of the infr astructure pr ojects mor e tr ansparent. Furthermor e, bonuses or incentives can be given to the operators of the project so that they are managed and oper ated mor e efficiently. Consequentl y, v ariable r ate r evenue infr astructure bonds enable investors to monitor their projects with step-in rights while revealing the generating mechanism of the project revenue. However, as it is v ery difficult to precisely for ecast the futur e cash flows of a pr oject it would be a good and feasib le approach to securitise e xisting infrastructures that ha ve enough historical data (tr ack records) for making sta ble and reliable revenue forecasts in order to issue r evenue bonds in Asia.b It also can secur e investors if a part (for e xample, 60%) of actual revenues would be securitised, as investors will bear the risk only when the revenues fall below 60% of the future cash flows.
102
OECD JOURNAL: FINANCIAL MARKET TRENDS – VOLUME 2012/1 © OECD 2012
Global Imbalances and the Development of Capital Flows among Asian Cou ntries
Box 2. Proposal for the development of a revenue bond scheme (cont.)
- Loans
Infrastructure 1
Asian
Infrastructure 2
Infrastructure
Infrastructure 3
Institutional Investors
.
- Invest in Project Bonds
. .
- Credit Enhancement - Technical Assistance, etc.
Bonds (AIB)
Equity (Public Funds Injection)
Infrastructure : n
Asian governments, ADB, government FIs, MDBs,etc.
The lia bilities side of this infr astructure fund consists of mainl y tw o parts, bond and equity. The bond part consists mainl y of Asian Infrastructure Bonds (AIB) whic h can be purchased by regional institutional investors. The equity part is made up b y injections of public funds b y go vernments, other go vernment financial institutions (FIs), m ultilateral development banks (MDBs) and professional market players in the region. The asset side of this infr astructure fund w ould mainly make lo w-interest rate (below the market r ate) loans for building and maintaining the infr astructures and in vest in infrastructure bonds (project bonds or revenue bonds) in the region. This institutionalised fund is expected to enable regional investors to invest in projects which are inherently risky owing to the long g estation period and uncertainty a bout future cash flows and it w ould fill the existing financing gap by facilitating the de velopment of an Asian infrastructure bond market. Conceptual framework of an Asian Infrastructure Bond Fund This institutionalised fund would be established through the participation and cooperation of go vernments, financial authorities, government financial institutions and professional market pla yers in Asia. This paper attempts to pr opose the basic conce pts and the necessity of an infr astructure bond fund in Asia. There are still many remaining issues to be discussed further with the futur e co-founding members suc h as the set-up of a pr eparatory committee and a pr ofessional in vestment committee whic h could be organised to select the feasible infrastructures and decide on investments in infrastructure bonds and loans for building infrastructures. a) Direct payment might be made by 1) business interruption events, 2) toll adjustment events, and 3) operator services events. The payable direct payments are calculated as the differ ence between the net toll r evenues after the event and the net toll revenues in the same period of the previous year. b) See Hong Kong Link 2004 for more details.
OECD JOURNAL: FINANCIAL MARKET TRENDS – VOLUME 2012/1 © OECD 2012
103
Global Imbalances and the Development of Capital Flows among Asian Cou ntries
At the ASEAN+3 F inance Ministers’ Meeting in Ma y 2009, the Ministers a greed to establish the Cr edit Guarantee and Investment Facility (CGIF), which would provide local currency-denominated bonds with a guar antee in or der to pr omote bond issuance b y addressing the following issues: (i) Even quality companies, such as those rated single A by local credit rating agencies, have difficulties in obtaining financing through bond issuance, especially of longer-term debt; (ii) financing for SMEs and infrastructure development is vulnerable to a credit crunch since it largely depends on indirect funding sources, such as bank loans. To ena ble better market access for SMEs and to enhance it for lar ger-sized firms, debt markets should be de veloped in the r egion. But limited access to de bt markets b y lower-rated issuers, limited liquidity , and limited di versity of the in vestor base r emain as obstacles. To clear these obstacles, steadil y de veloping the CGIF is important for the issuance of local bonds with longer maturities.
4. SME database Considering SMEs’ lar ge shar e in man y dimensions of Asian economic acti vity as discussed above, further efforts should be made in the area of SME finance. SMEs are often believed to be difficult to assess in terms of their financial and non-financial accounts. But the Credit Risk Database (CRD) of Japan is an example of how SMEs can be rated based on financial and non-financial data. The CRD made it possible to collect a huge amount of data from SMEs and rate SMEs based on a statistical analysis.
5. Database provided by the Credit Risk Database (CRD) The CRD Association was established in 2001 at the initiative of the Japanese Ministry of Economy, Trade and Industry (METI) and the Small and Medium Enterprise Agency (SMEA) by 52 credit guarantee corporations as well as financial and non-financial institutions. Its aim was to facilitate fund-r aising for SMEs and impr ove their operational efficiency. With the increasing importance attached to the fund-raising of SMEs, the membership increased from 73 institutions at the end of March 2002 to 200 institutions at the end of 2010. The CRD data base pr ovided b y the Association co vers SMEs e xclusively ( Figure 15). It covered 14.37 million corpor ations and 1.737 million sole pr oprietors as of Mar ch 2010, which w as mor e than 50% of all SMEs in J apan. The data base for default co vered 3 289 000 corporations and sole pr oprietors. It is b y far the lar gest data base for SMEs in Japan. The CRD Association received active support not onl y from the pri vate sector but also from the public sector, which contributed partly to its success. For example, the SMEA nominates the representative of the CRD Association as a member of government councils. Such tr eatment g ives the CRD Association an opportunity to pr omote its acti vity and increase its membership. Credit guarantee corporations and private financial institutions use the CRD database when they create a joint guarantee scheme. Furthermore, before the CRD database was formally established, the government invested JPY 1.3 billion fr om the supplementary budg ets for fiscal years 1999 and 2000 to finance the setting up of CRD’s computer system and other oper ational costs. The CRD Association provides sample data and statistical information as well as scoring services.
104
OECD JOURNAL: FINANCIAL MARKET TRENDS – VOLUME 2012/1 © OECD 2012
Global Imbalances and the Development of Capital Flows among Asian Cou ntries
Figure 15. SME Database (CRD Database) Credit Guarantee Corporations
SMEs
(Collect Data of SMEs) 52
(14.4million data)
Financial Institutions 200
Defaults (1.7million data) 1. Government Support 2. Reliability 3. Security of Information
Regional Banks Credit Associations Credit Cooperatives Government Banks Central Bank
CRD Source: Author.
Member financial institutions use scoring models to enhance the efficiency of cr edit evaluation, check the validity of internal based rating systems, and align loan pricing with credit risk. In addition, the CRD Association provides consulting services to support the management SMEs. These services ha ve been de veloped based on the thinking that the improvement of SME management will contribute to the e r duction of credit risk for member financial institutions and to strengthening the business operation of SMEs. They have also been offered to member financial institutions to help them promote the implementations of Basel II. If such kinds of systems could be established in other parts of Asia to accumulate and analyse cr edit risk data, and measur e eac h SME’s cr edit risk accur ately under the same criteria, SMEs would not only be able to raise funds from the banking sector but also g ain access to the debt market through securitisation of their claims.
6. The SME industry and credit information infrastructure in East Asia Despite the impr ovements in financial markets that occurred after the 1997 Asian financial crisis, the tric kle-down effect to the SME industr y of that pr ogress leaves a lot to be desired. Information asymmetry still exists and the type of infrastructure that could appr opriately addr ess this pr oblem v aries widel y acr oss the ASEAN r egion, in terms of e xistence and state of de velopment. SMEs pla y a pi votal r ole in the industrial structure of ASEAN nations (in terms of contribution to output growth, v alue-creation and employment) and y et, as r esearch has esta blished, their gr owing demand for cr edit is not entir ely matched by the e xisting credit infrastructure and cr edit products of banks and other lending institutions. It appears that cr edit infrastructures in the ASEAN region are not enough de veloped and m ust be ad vanced further in or der to cr eate mor e cr edit channels for SMEs and help these firms realise their full economic potential. Meanwhile, the Asian Bond Market Initiative (ABMI) has been very keen on developing the bond markets of several countries in the region in general. However, the level of activity in the r egional bond market is a function of the le vel of acti vity in the domestic bond markets of indi vidual countries in the r egion which, in turn, de pends on the e xtent to
OECD JOURNAL: FINANCIAL MARKET TRENDS – VOLUME 2012/1 © OECD 2012
105
Global Imbalances and the Development of Capital Flows among Asian Cou ntries
which local firms are able to access credit from their country’s capital markets. Industries that have more financing options are able to respond more actively to increasing demand and other c hallenges and participate in cr eating and sustaining an en vironment mor e conducive to business. To this end, the ABMI has recommended the following measures:
i) the provision of credit guarantees;
ii) the improvement of the credit rating system;
iii) the establishment of a mechanism for disseminating information;
iv) the improvement of settlement systems; and
v) strengthening the legal and institutional infrastructure for bond market development. How these r ecommendations may play out in supporting the Asian SME industries that underpin their respective economies is one of the aims of this r esearch. The findings of the stud y will also be r elated to one of the sub-objecti ves of the ne w comprehensive ABMI r oadmap, whic h is fostering a cr edit cultur e via “the development of a cr edit risk database and the enhancement of credibility and visibility of local credit rating agencies”. Despite its relevance and dynamic growth, the SME sector is not immune to problems. SMEs are hardest hit by economic crises and other unfa vourable market conditions, such as unfair competition. But the most persistent c hallenge to SMEs is inadequate access to financing, not only because the level of financing available in the developing economies in which these SMEs oper ate is r elatively scarce to be gin with, but “many financial support measures for SMEs ha ve limited outr each at dispar ate costs”. It also does not help that capital markets in the region are far from adequate for SME debt and equity financing. The financing problem of SMEs is rooted in the information asymmetry problem that faces both lenders (mostly banks) and borrowers and is compounded by existing market imperfections and the nature of the financing transaction itself. As a demand and supply issue, financing may onl y be successfull y r ealised if the lender finds the risk it faces acceptable subject to a g iven e xpected r eturn to be ac hieved b y the borr ower. This acce ptable le vel of risk depends on the accuracy and timeliness of information that the borrower is able to present or convey to the lending bank. The development of a credit infrastructure such as credit bureaus would serve both the lending banks and the borrowing SMEs by bridging the gap between these two parties. A credit information system is an indispensable infrastructure for credit market development. The provision of credit information helps lenders understand better the risk profile of their borrower-clients and enables them to expand their credit services. Recent availability of new technologies such as cr edit scoring has facilitated the a bility of banks to service SMEs better . The information-captur e platform of a cr edit bur eau makes it possib le to measure SME borrowers in a number of ways. What gets measured gets managed, and the metrics provided by credit bureau information serve the interests of both banks and SMEs. The foundation for impr oving the cr edit quality and risk mana gement is better information – which a credit information system can provide. By disseminating information collected about SMEs and its suppliers, it assists SMEs in building tr ack r ecords. Ev en if these SMEs have no bank relationships, if their credit bureau records indicate a good credit standing among their suppliers, such information may be used to their fa vour to support financing applications when the need arises. SMEs with good tr ack records may also be able to access cr edit on mor e fa vourable terms, and obtain faster decisions a bout their financing applications. The negative and (especially) positive data that a credit bureau has
106
OECD JOURNAL: FINANCIAL MARKET TRENDS – VOLUME 2012/1 © OECD 2012
Global Imbalances and the Development of Capital Flows among Asian Cou ntries
benefit SME loan applicants by pr oviding a mor e balanced vie w of SMEs’ cr edit r atings and expected default rates. By knowing how the credit bureau presents information about them, SMEs (which were rejected by banks) g ain a better understanding of their financial deficiencies through the cr edit bur eau r eports and r atings. As emphasised in the ABMI roadmap, these reports would also serve as “a convenient tool for SMEs to carry out a self-evaluation to identify ar eas that need impr ovement and initiate adequate r emedial actions to incr ease their competiti veness. SMEs ar e thereby empowered to impr ove their own profile, with correspondingly enhanced prospects for the SME sector as a whole.”
7. Creation of trust funds U nder the bank-dominated financial systems in Asia, it w ould be helpful to cr eate regional funds (or a r egional trust fund) to pr omote lending to start-up companies and riskier borrowers such as SMEs, thereby helping to maintain the soundness of the banking sector, as banks would not be exposed to these types of risks. If these regional trust funds were sold thr ough branch offices to regional banks, post offices, credit associations, and large banks, this would enhance opportunities for regional companies to raise funds. However, these r egional trust funds ar e not guar anteed b y the De posit Insur ance Corporation and risks ar e to be borne b y investors. The terms of the trust fund m ust be fully e xplained to in vestors, like wher e it is in vested and the risks associated with the investment, in order to strengthen trust fund investors’ confidence and help the trust fund market to grow. Examples of regional funds in Japan are i) wind power generators, ii) musicians’ funds, and iii) Japanese wine (“Japanese Sake”) br ewery funds. There are about 20 wind power g enerators. In or der to construct these g enerators, pri vate-public partnerships were launched. Local r esidents invested about U SD 1 000 to 5 000 into the pr oject. They receive dividends every year through the sales of electricity by each wind power generator invested. Musician’s funds gather many small investors. Each investment unit is about U SD 150 to 500. If musicians become successful and their DVDs sell well the sales will generate a higher high rate of return for the fund. There are both successful funds and failed funds. Project evaluations are quite important in the creation of regional funds. Some of the regional funds which had invested in risky business ventures did not perform well. Banks globally are becoming much more concerned about their risks with the implementation of Basel III. This would make it even more difficult to raise venture capital and finance riskier projects in the Asian region, since it is dominated b y bank loans and capital markets ar e not well developed. So-called project assessors m ust play a ke y role to e valuate each project. Otherwise, non-performing investments could incr ease and man y investors could lose their mone y. Some of J apan’s r egional funds ar e r egarded as a c harity to in vest into their r egion to support venture businesses. Banks face a critical c hallenge in the lending pr ocess when they are confronted with various pr ojects. Some of the pr ojects will ha ve high e xpected r ates of r eturn, but high risks, that banks will not be a ble to finance. Ho wever, if suc h pr ojects ar e financed by regional funds r ather than b y deposits transformed into bank loans, they will not cr eate non-performing loans for banks. Banks can collect their money through sales of r egional funds by their branch offices. It has to be made clear to investors in these funds that their
OECD JOURNAL: FINANCIAL MARKET TRENDS – VOLUME 2012/1 © OECD 2012
107
Global Imbalances and the Development of Capital Flows among Asian Cou ntries
investment is not guaranteed, but, at the same time, they might receive a high rate of return. This would increase investment into riskier projects. Banks can compete on the basis of successful r egional funds. If some banks sell successful regional funds, they can attract many more investors in the future. On the other hand, if some banks sell bad funds,they will lose investors in future. Competition will work to improve the quality of projects and enhance the risk-adjusted returns for investors. Infrastructure bonds may be financed by institutional investors such as pension funds and insurance companies. But regional funds, as explained above, will also be able to attract retail investors in the region (Figure 16).
Figure 16. Bank-based SME financing and regional financing to riskier borrowers
Banking Account
Safer SMEs
Riskier Borrowers
Regional Funds Mutual Funds
Depositors
Investors
Source: Author.
8. Long-term finance in the Asian region Japan used to have long-term credit banks. Long-term credit banks issued their bank debentures which are longer term than or dinary bank de posits. Their interest rates were higher than those on bank de posits and the y attr acted long-term indi vidual in vestors. Corporations did not issue bonds. However, the long-term credit banks lent money to large corporations b y issuing long-term bank de bentures. Man y Asian countries do not ha ve substantial corporate bond markets. In developed economies, long-term credit is financed by issuance of corpor ate bonds. However, since the corpor ate bond market is limited to larger and esta blished corpor ations, onl y those companies can issue corpor ate bonds; small businesses and start-up businesses cannot. How to pr ovide long-term financing to various industrial sectors is an important polic y issue. Otherwise the newly-created trust funds will be short-lived and will be unable to provide long-term funds. Government banks pr ovide long-term loans to industry, small businesses, the agricultural sector etc. Financing by government banks can be done in several ways. One is absorbing individual deposits such as postal savings or government bank deposits. A second way is issuance of go vernment bonds. A thir d w ay is to use tax r evenues. Go vernment banks ar e often said to lac k corpor ate go vernance. Go vernment bank oper ations ar e sometimes less efficient than private banks. On the other hand, private banks and private bond markets lack liquidity when faced with a financial crisis such as the current subprime loan problem. When private financial markets are in crisis, the role of government banks in providing prompt finance is often being reconsidered. For example, after Japan’s tsunami and earthquake disaster, the role of government banks was also revitalised.
108
OECD JOURNAL: FINANCIAL MARKET TRENDS – VOLUME 2012/1 © OECD 2012
Global Imbalances and the Development of Capital Flows among Asian Cou ntries
Private banks and private financial institutions complain about lending by government banks even during normal economic conditions. It is often claimed that government bank loans are crowding out pri vate bank loans. However, in the face of a financial crisis, the role of government finance has to be re-evaluated. Their loans are important to support small businesses as w ell as the a gricultural sector where private banks become r eluctant to extend loans. The crowding out of pri vate bank loans b y government bank loans can be observ ed when government banks continue extending loans to the private sector even after a crisis is over. Too many loans by government banks would allow little room for private banks to make loans during normal times.A shift from government bank loans to private bank loans is needed when pri vate financial markets regain their normal conditions. Go vernment banks could transfer their loan contracts to private banks.
9. How to develop long-term investors in developing economies Pension funds and insurance companies are institutions to provide long-term finance for infrastructure investment, long-term corpor ate finance etc. As the a geing population increases, developing countries have to esta blish pension funds. Japanese pension funds are pay-as-you-go style and pension contributors cannot control how their funds should be invested. They let the government decide how funds should be allocated to various financial products. On the other hand, most U S pensions ar e 401k-style and pension contributors decide what percentage can be invested into risky assets and into safe assets. The portion of pension funds that is allowed to be invested into riskier assets can obtain a higher r ate of return from riskier investment products.
10. Pension funds and insurance for long term investment4 Pension funds can invest in infrastructure and riskier projects for long-term purposes. Pension funds can in vest in long-term trust funds since the y ar e looking for long-term investment pr oducts. Life Insur ance is another w ay of collecting funds for long-term investment. Many insurance products are long-term oriented. Many Asian countries are in the process of developing insurance and pension funds.Long-term investment is important for pension fund contributors and investment products. Contributors are expecting a longterm rate of return and to receive benefits in the distant future. High national sa vings is one important c haracteristic in Asia, y et long-term funds such as pension funds and life insurance are still not well developed. Development of such finance could produce long-term financial instruments including infrastructure funds and long-term trust funds. This would not only develop long-term financial products but would also create investors in suc h long-term financial products by establishing pension funds and life insurance. These funds could support the ageing populations in those countries. Better skills m ust be de veloped to in vest in long-term pr oducts. So vereign w ealth funds have been created in many Asian countries. Yet their rates of return have not been good. Pri vate-public partnerships, as e xplained a bove, ar e better suited for long-term project finance and could have better e xpected long-run r eturns. If a financial product is not expected to have a stable rate of return, private investors are reluctant to invest in it. At the same time, an injection of government funds could enhance a pr oject’s rate of return, as explained in Box 2 above.
OECD JOURNAL: FINANCIAL MARKET TRENDS – VOLUME 2012/1 © OECD 2012
109
Global Imbalances and the Development of Capital Flows among Asian Cou ntries
V. Remaining challenges This o verview has sugg ested se veral pr actical w ays to corr ect global imbalances or mitigate the deleterious effects of v olatile capital flows. Yet, this note m ust highlight several remaining challenges with regard to these structural issues. To channel Asian savings into Asian investments by developing infrastructure project finance and/or promoting financial inclusion, the r equirements of financial institutional factors suc h as r egional monoline insur ance companies, bankruptcy law and r esolution procedures, and credible regional rating agencies need to be reconsidered, reflecting the latest discussion of the global financial reform. Another remaining challenge is the shortage of regional institutional investors. Without regional institutional in vestors it might be difficult to channel Asian sa vings into Asian investments, because for global institutional investors searching for yield and for the banking sector it is difficult to maintain a proper balance between long-term investment and safety and soundness. Infrastructure revenue bonds are one instrument, yet various instruments are needed for the development of institutional investors such as pension funds. Asian countries lack transparency in their tax rules, regulations etc. U nified disclosure of tax r ates, rules and r egulations for in vestors will enhance cr oss-border portfolio investments among Asian countries. If Asian countries could harmonise their rules and regulations within the region, capital flows among Asian countries could be accelerated. An increase in financial assets in Asia would also enhance capital flows among Asian countries. Lack of financial instruments and lack of liquidity are other reasons why Asians invest their money in the U nited States and Europe. If a variety of new financial instruments were created in Asian countries and if their liquidity were increased, Asian investors could find an appropriate choice of financial products in Asia in which to invest. The measur es and instruments mentioned a bove ar e needed for the de velopment of long-term in vestors suc h as pension funds and life insur ance companies. To cr eate infrastructure in vestment pr oducts, trust funds for SME finance are important for the development of the economy. However, long-term investors need to increase in the Asian region. Creation of both supply of and demand for long-term investment products must be developed in the Asian region in line with the strict Basel capital r equirements for banks and various new regulations for financial industries.
Notes
1. Infrastructure bonds and securitised pr oducts for SME finance, which will be discussed belo w in this paper, are financial instruments to be traded in the Asian Bond Market in order to accelerate financial transactions in Asia.
2. In this respect, “The OECD Code of Liberalisation of Capital Movements” provides a framework for polic y makers in designing and carr ying out sound policies to facilitate the cir culation of capital and in vestment acr oss national fr ontiers. Examples of the Code’ s pr ovisions include: 1) the right to proceed gradually towards liberalisation through a process of lodging and maintaining reservations; 2) the ob ligation not to discriminate; 3) e xceptions for r easons of pub lic or der and security; 4) der ogations in case of tempor ary economic difficulties; 5) provisions to ensur e compatibility with regional arrangements such as the European U nion and its special processes.
3. For further details on the OECD pr oject on long-term in vesting see http://www.oecd.org/finance/lti and references to OECD papers in the bibliography.
4. For further information on pension funds and long-term in references in the bibliography.
110
vestment please see OECD papers
OECD JOURNAL: FINANCIAL MARKET TRENDS – VOLUME 2012/1 © OECD 2012
Global Imbalances and the Development of Capital Flows among Asian Cou ntries
References Alvstam, Clars, Patrik Ström and Naoyuki Yoshino (2009), “On the economic interdependence between China and Japan: Challenges and possibilities”, Asian Pacific Viewpoints, Vol. 50, No. 2. Akerlof, George A. (1970), “The Market for ‘Lemons’: Quality U ncertainty and the Market Mechanism”, The Quarterly Journal of Economics, Vol. 84, No. 3; pp. 488-500. Asian Development Bank (2008), Key Indicators, 2008. Della Cr oce, R. (2011), “Pension Funds In vestment in Infr astructure: P olicy Actions”, OECD Working P apers on F inance, Insur ance and Priv ate P ensions, No . 13, OECD Pub lishing; http://dx.doi. org/10.1787/5kg272f9bnmx-en. Della Cr oce, R., C. K aminker and F . Ste wart (2011), “The Role of P ension Funds in F inancing Gr een Growth Initiatives”, OECD Working Papers on F inance, Insurance and Private Pensions, No . 10, OECD Publishing; http://dx.doi.org/10.1787/5kg58j1lwdjd-en. Della Cr oce, R., F . Ste wart, Yermo, J . (2011), “Promoting Long er-term In vestment b y Institutional Investors: Selected Issues and Policies”, OECD Journal: Financial Market Trends, Vol. 2011/1. Diamond, Douglas W. (1984), “Financial Intermediation and Delegated Monitoring”, Review of Economic Studies, Vol. 51; pp. 393-414. Gorton, G. and A. Winton (2003), “Financial Intermediation”, Handbook of Economics and Finance, Chapter 8, Elsevier B. V. Kotecha, Mahesh and S. Ryan Sharon (2004), “Role of the Financial Sector: Channeling Private Savings to Infrastructure Investment in East Asia and the Pacific (EAP),” ADB-JBIC-World Bank East Asia and Pacific Infrastructure Flagship Study. Leland, H.E and D .H. Pyle (1977), “Information Asymmetries, F inancial Structur e, and F inancial Intermediation”, The Journal of Finance, Vol. 32, No. 2; pp. 371-387. OECD (2010), “Financing Transport Infrastructure Development”, Southeast Asian Economic Outlook 2010 , Chapter 6, prepared by Naoyuki Yoshino; OECD Publishing, http://dx.doi.org/10.1787/9789264096004-en. Revankar Nagesh and Naoyuki Yoshino, (2008), “An Empirical Analysis of Japanese Banking Behavior in a Period of Financial Instability,” Keio Economic Studies, Vol. 45 No. 1. Riley, J. (1975), “Competitive Signalling”, Journal of Economic Theory, No. 10. Rothschild, M. and J . Stiglitz (1976), “Equilibrium in Competitive Insurance Markets: An Essay on the Economics of Imperfect Information”, Quarterly Journal of Economics. Shimada, Toshiyuki and Ting Yang (2010), “Challenges and Developments in the Financial Systems of the Southeast Asian Economies”, OECD Journal: Financial Market Trends Vol. 2010/2. Ström, Patrik and Naoyuki Yoshino (2009), “Japanese financial service firms in East and Southeast Asia: Location pattern and str ategic r esponse in c hanging economic conditions”, Asian Business and Management, Vol. 8, No. 1; pp. 33-58. Suk, Hyun, Toshiro Nishizawa and Nao yuki Yoshino (2008), “Exploring the U se of Re venue Bond for Infrastructure F inancing in Asia”, JBIC Institute , J apan Bank for International Cooper ation, JBICI Discussion Paper No. 15, July 2008. U NESCAP (2006), “Enhancing Re gional Cooper ation in F inancing Infr astructure Investment”, Chapter VIII Enhancing Re gional Cooper ation in Infr astructure De velopment Including That Related To Disaster Management, the 62nd Commission Theme Study. Yoshino, Naoyuki, Satoshi Nakagawa and Suk Hyun (2007),“Development of Infrastructure Bond Market in Asia: F easibility of Asian Infr astructure Bond Fund”, K eio U niversity COE Pr oject Discussion Paper Series DP2007-001. Yoshino, Naoyuki, Tomohiro Hirano, and K akeru Miura (2009), “The Optimal Basel Capital Requirement to Cope with Pr o-cyclicality: A Theoretical Approach”, FRTS Discussion Papers, DP2009-5 (11, 2009); Financial Research and Training Center, Financial Services Agency (FSA), Go vernment of Japan; available at www.fsa.go.jp/frtc/english/seika/discussion.html. Yoshino, Nao yuki, Mic hael Lac ktorin, Hir oyuki Chuma, Yoshibumi Aso, Masaki Nakahig ashi, Masao Nakata (eds.) (2010), The Postwar Japanese Economy, Yuhihaku Publishing Company, Japan. Yoshino, Naoyuki, and Testuto Mizoguchi (2010), “The Role of Public Works in the Political Business Cycle and the Insta bility of the Budg et Deficits in Japan”, Asian Economic Papers, MIT Pr ess, Vol. 9, No. 1. OECD JOURNAL: FINANCIAL MARKET TRENDS – VOLUME 2012/1 © OECD 2012
111
Global Imbalances and the Development of Capital Flows among Asian Cou ntries
Yoshino, Naoyuki, Koichi Suzuki, Yasuhiro Maehara and K azutomo Abe (2009), Development of Corporate Credit Information Database and Credit Guarantee System, paper presented to the ASEAN Secretariat, February. Yoshino, Naoyuki and Tomohiro Hirano (2011), “Procyclicality of The Basel Capital Requir ement Ratio and Its Impact on Banks”, Asian Economic Papers, MIT Press, Vol. 10, No. 2. World Bank (1995), The East Asia Miracle, Washington, DC. World Bank (2008), Finance for All? Policies and Pitf alls in Expanding Access, A World Bank P olicy Report, published 13 November 2007, prepared by Aslı Demirgüç-Kunt, Thorsten Beck, and Patrick Honohan; http://go.worldbank.org/7BAOC2SP90. World Bank, http://ppi.worldbank.org/book.
112
OECD JOURNAL: FINANCIAL MARKET TRENDS – VOLUME 2012/1 © OECD 2012