Exploration of Classification Techniques as a Treatment Decision Support Tool for Patients with Uterine Fibroids
Technical Report
Department of Computer Science and Engineering University of Minnesota 4-192 EECS Building 200 Union Street SE Minneapolis, MN 55455-0159 USA
TR 10-010 Exploration of Classification Techniques as a Treatment Decision Support Tool for Patients with Uterine Fibroids Kevin Campbell, N. Marcus Thygeson, Jaideep Srivastava, and Stuart Speedie
April 16, 2010
Exploration of Classification Techniques as a Treatment Decision Support Tool for Patients with Uterine Fibroids Kevin Campbell MHI, N. Marcus Thygeson MD, Jaideep Srivastava PhD, Stuart Speedie PhD
[email protected] Keywords: preference sensitive decision; uterine fibroid; decision aids; classification; evaluation; rare-class
Abstract. Uterine fibroids are benign growths in the uterus, for which there are several possible treatment options. Patients and physicians generally approach the decision process based on a combination of the patient’s degree of discomfort, patient preferences, and physician practice patterns. In this paper, we examine the use of classification algorithms in combination with metalearning algorithms as a decision support tool to facilitate more systematic fibroid treatment decisions. A model constructed from both Naïve Bayes (with Adaboost) and J48 (with bagging) algorithms gave the best results and could be a useful tool to patients making this decision.
1
INTRODUCTION
1.1
Focus area and motivation
The purpose of this study is to evaluate six selected classification algorithms in predicting the treatment choice of patients diagnosed with uterine fibroids. A recent review of the uterine fibroid treatment literature found insufficient evidence to help guide women’s treatment choices [1]. This study is relevant in light of previous research that suggests unaided human analysis of data for decision making is unintentionally flawed [2]. Applying data mining to even small data sets can provide protection against unaided error-prone human inference and could consequently support improved treatment decisions [3]. Data mining could be particularly useful in medicine when there is no dispositive evidence favoring a particular treatment option, as in the case of uterine fibroid management. 1.2
Aim and objectives of this paper
The research questions of this project are: 1.
Can data mining techniques be applied to data collected from patients with uterine fibroids in order to predict a treatment choice?
2 Kevin Campbell MHI, N. Marcus Thygeson MD, Jaideep Srivastava PhD, Stuart Speedie PhD
2.
2
Which classification algorithm among those selected for this project is most successful in predicting the treatment decisions for the patients in our data set?
BACKGROUND
Uterine fibroids are benign growths of smooth muscle cells and fibrous tissue in the wall of the uterus. Approximately 30% to 40% of women of reproductive age are affected by uterine fibroids. Fifty percent of these women report symptoms that affect their quality of life [5], such as abnormal uterine bleeding, anemia, pelvic pain, pelvic pressure, urinary problems, and infertility [6]. Surgical options such as hysterectomy and abdominal myomectomy have been the mainstay of fibroid treatment. These treatment options typically result in 1-5 days of hospitalization, and a hysterectomy results in permanent loss of reproductive potential. Given the substantial impact of surgery, minimally invasive procedures have been developed, such as uterine artery embolization (UAE), which has a notably shorter hospital stay. Treatments which use medications to manipulate steroid hormones can be effective in the short term; however undesirable side-effects occur with extended use. In addition, recurrence of fibroids after less invasive treatments remains a substantial problem. While many treatment options for fibroids now exist, there have been almost no controlled trials comparing these treatments. Therefore, the decision for fibroid treatment is a preference-sensitive decision, defined as a decision for which “there is no reason to choose one treatment over others for most patients other than what best suits the values and preferences of individual patients.” Preference sensitive decisions often show wide geographic variation in practice patterns, suggesting that local medical opinions and resource availability, rather than objective evidence or patient preference, have a strong impact on the decision outcome [7]. Treatment decisions can be challenging. The ultimate decision rests with the patient, who may be overwhelmed with a confusing range of information sources. Often, both patient and physician may be unduly influenced by personal experience and/or misguided anecdotal evidence instead of the body of knowledge gained through research or the cumulative experience of all the patients in a large medical database. Misconceived or inappropriate human inference about patterns can be avoided or reduced by applying the unbiased techniques of data mining to even small datasets. In this way, data mining should aid human judgment via discovered patterns of successful and quantifiably measurable outcomes within the data [3]. While there have been many successes in applying data mining technology to the improvement of diagnostic accuracy, we found only two studies addressing decisions about choosing a particular course of action after a diagnosis has already been made. Nagori and colleagues [8] studied treatment decisions for children with asthma by using the C4.5 algorithm, which is referred to as the J48 algorithm in the Waikato Environment for Knowledge Analysis (WEKA) software and remainder of this paper. Nagori and colleagues first used the algorithm in order to classify the asthma severity and origin of the disease. Next, they used the algorithm to create a decision tree that could be used for a treatment plan. They found that the best treatment depended on
Exploration of Classification Techniques as a Treatment Decision Support Tool for Patients with Uterine Fibroids 3
the severity of the asthma. Their biggest methodological challenge was the paucity of data demonstrating previous successes and failures in making the same decision[8]. Baca-Garcia and colleagues [9] had success using data mining to determine whether a suicidal patient should be hospitalized. The study reanalyzed a published study that had predicted psychiatrists’ decisions with multivariate statistics. While, the statistical approach was correct 72% to 88% of the time, the data mining techniques correctly classified 99% of the patients. These results suggest that data mining may be useful in exploring important treatment questions in both psychiatry and medicine [10].
3
METHODOLOGY
3.1
Data Selection
The data used for this paper was collected from a survey given to women ages 18 or older who had recently made a decision regarding their uterine fibroid treatment at eight different clinics in Minnesota, USA. Cases in which a decision was not made or was ambiguous, or where critical data was missing, were removed, leading to a final data set containing 171 patients. Survey data included demographic and sociographic factors (age, educational level, race, English proficiency and confidence filling out medical forms); duration of symptoms; degree of bother from four symptoms (pain/pressure, bleeding, urinary frequency, and infertility) and interference with daily activities; six treatment preferences (rapid relief, preserve fertility, permanent treatment, low failure rate, short recuperation period, avoid medication side effects, and improve sexual function); the treatment chosen; level of knowledge (answers to five questions about fibroids and their treatment); participant perceptions of their decision quality (whether they were adequately informed, their decision was consistent with their values, they were satisfied with the decision process, and they were satisfied with the decision); and the types of decision support processes that participants recalled using [11]. The degree of bother and treatment preferences were measured on a 0 to 10 scale, with 0 being little and 10 being very much. 3.2
Data Mining Preprocess
Applying machine learning techniques to this study can be framed as a classification problem. The variable to be classified, or learned, is the treatment choice of the patient. After a series of preliminary tests with the algorithms listed later in this paper, we determined that classifier performance would suffer unless we restructured our strategy to use the one-vs.-rest approach described below.
4 Kevin Campbell MHI, N. Marcus Thygeson MD, Jaideep Srivastava PhD, Stuart Speedie PhD
3.2.1 One-vs.-Rest strategy The class variable (treatment choice) was recorded in the survey as one of five different treatment options (Hormone Therapy, Hysterectomy, Myomectomy, No Treatment, UAE). We created five dummy binary variables, one for each treatment, and ran each algorithm five different times (once for each treatment), to create five separate models. Instead of attempting to answer the question, Will a patient choose treatment A or B or C or D or E; we have five new questions of the form, Will a patient choose treatment X or not-X? The final output of this approach is a prediction for each of the five classifier questions and a confidence level for each prediction. This could be delivered to the patient or physician as a predicted ranking of treatments and the associated confidence levels. 3.2.2 Resampling strategy The class frequency distribution in our data was highly skewed. In a binary class situation with highly skewed classes, a classifier algorithm can develop a model that may always predict the majority class and yet still be highly accurate. For example, in a binary problem where 1% of the population falls into the rare class, predicting that everything will be of the majority class will result in 99% accuracy. While this might seem acceptable from a global perspective, it is unacceptable from the perspective of the minority class [12]. The distributions by class are displayed below in Table 1. Clearly, UAE, Myomectomy, and Hormone Therapy are rare classes, where acceptable accuracy can be achieved by simply predicting the majority class for all cases. Table 1. Distribution of treatment choices in 171 cases
Treatment Choice UAE Myomectomy Hormone Thereapy Hysterectomy No Treatment
Number of instances 7 19 20 50 75
Percentage of cases 4.1% 11.1% 11.7% 29.2% 43.9%
To overcome this problem a resampling strategy was used. With MATLAB version 7.8.0 (R2009a), developed by The Mathworks, the data was randomly divided into training sets (60%) and test sets (40%) via a random sampling feature [13]. This random training/test split was carried out 20 different times. Next, within the training sets the cases of the minority class were reproduced, until there was an equal distribution of the class variable within the set. Therefore, the algorithms will not create models that favor the majority class. The test set data was not resampled because that would artificially inflate the accuracy of the classifier. The 20 different training and test sets could be used to guarantee that all portions of the data set were used for both the classifier training and testing. Because there were 5 treatment
Exploration of Classification Techniques as a Treatment Decision Support Tool for Patients with Uterine Fibroids 5
classes of interest, this process was conducted once for each class, resulting in 100 total data sets. 3.3
Data Reduction and Transformation
Once the 100 training and test sets were developed with MATLAB, all further work was done within the WEKA environment. The WEKA Explorer interface was used for data reduction and transformation processes. Data reduction is an important process in which confounding and redundant variables are removed from the data set, in order to increase accuracy and validity of the developed models. Naïve Bayes methods, for example are particular susceptible to a decrease in performance with the addition of confounding variables. The data transformation process was done primarily to accommodate both ordinal and nominal values recorded in the survey data. Typically, decision trees perform better with nominal attributes. For attributes like patient’s bother or preferences that were recorded on a 0-10 scale, there was some meaning to the order, although the numbers carried little arithmetic meaning. These attributes were transformed into binary nominal attributes prior to attribute selection methods. These processes are described below. 3.3.1 Binary Nominal Transformation All ordinal attributes in the data were transformed into binary nominal attributes. Assuming an attribute had k possible values it was transformed into k-1 binary attributes, where the values below a certain threshold are considered false, and the rest true. Each new binary attribute contains within it the number of cases that fell above or below its threshold. For example, the attribute that represented patients’ degree of bother caused by pain had 11 possible values, ranging from 0 to 10. So this 1 ordinal attribute was replaced with 10 binary attributes, the first of which indicated if a patient scored below a 1, the second of which indicated if a patient scored below a 2, and so on. This technique allowed us to use learning methods that may not handle ordered attributes well, without sacrificing the information contained in ordered data [14]. Some classifiers used in this project are able to work with numerical or ordinal variables, although preliminary tests with our data suggested that performing a transformation from ordinal to binary nominal variables would improve classifier performance. Further, by doing this before the attribute selection process, we were able to consider information contained within each portion of an ordinal attribute as a piece of information that should help or hinder the construction of a model. This process increased our number of attributes from 45 to 208.
6 Kevin Campbell MHI, N. Marcus Thygeson MD, Jaideep Srivastava PhD, Stuart Speedie PhD
3.3.2 Attribute Selection Infogain is an attribute selection tool available within the WEKA Explorer interface that ranks attributes within the data set in decreasing order based on information gained by splitting the data with each attribute. We used this method to rank attributes by importance because it is similar to methods used to construct decision trees. Attribute ranking was performed once for each of the five different treatment options because the information gained from a particular attribute depends on the class we are attempting to predict. The process was performed on data that was not resampled, in order to avoid bias due to the resampling process 3.4
Exploration of Feature Space
Table 2 shows the top 15 attributes ranked by the infogain tool for each treatment class. Many of the attributes appear multiple times, differing in the value upon which they were split in the binary transformation. We show only the top 15 variables for simplicity, although models were constructed on many diffirent configurations of attributes. The table reveals which attributes are most likely to contain information that would be useful in predicting a particular class. Some of these are surprising (such as duration, age and quiz answers); others make intuitive sense. We can see from the hormone therapy column that preference to avoid medications may play a large part in determining whether or not a patient pursues hormone treatment. Likewise, we see that whether a preference for permanent treatment is less than or equal to ten also impacts this decision. This makes sense; a patient with a strong desire for permanant treatment is unlikely to want hormone therapy, which is likely to be an impermanent solution. Further, in the hysterectomy column, there are many binary splits of the ‘preference for permanent treatment’ variable, indicating that the degree to which a patient prefers permanent treatment may play a large role in determining if patient actually chooses something as permanent as a hysterectomy. The myomectomy column lists preference to have a baby near the top multiple times. Again, this is sensible, because myomectomy preserves the uterus and cervix, allowing women to retain their reproductive ability. In the no treatment class, there is a high dependency on the attributes that measures a patient’s preference for rapid relief and the degree to which the patient’s symptoms interfere with her daily activities. For patients with a strong desire for rapid relief or high interference with daily activities, watchful waiting may not be a good choice. The UAE class shows a strong emphasis on how bothered a patient is by her symptoms of infertility along with preferences for a short recuperation, both of which are sensible, as an advantage of UAE treatment is a quicker return to normal activities as compared to the other more invasive treatments. The column on the far right side of the table functions as a key, and provides a snapshot of the most important variables in the global treatment decision. The list is shorter because it groups together ordinal variables that were split previously in the binary nominal transformation. We can conclude from this table that an attribute impacts a patient’s choice, but not the direction (pro v. con) of the choice. This
Hormone Therapy PAM 6 PAM 1 PPT 10 QH * PAM 7 PAM 4 PAM 5 PAM 2 QT * PAM 3 PAM 8 BB 8 QN 4 PAM 10 AGE 35 PPT PPT PPT PPT PPT PPT IFD IFD BB MB PRR IFD PPT IFD PRR 9 10 7 8 3 5 4 6 8 7 8 2 6 1 6 PHB PHB PHB PHB PHB BUF PHB Race PHB BB PHB DUR PHB AGE PHB 7 8 9 10 6 8 4 * 5 1 3 2 1 50 2
Hysterectomy Myomectomy
No Treatment PRR 6 PRR 7 PRR 8 PRR 5 IFD 6 PRR 9 IFD 2 PRR 1 IFD 0 IFD 1 PRR 5 MB 4 IFD 3 MB 5 BB 1 BI BI DUR BI PSR IFD BB BI BI BI PSR BB DUR BI AGE
UAE 2 1 3 3 7 5 4 10 8 9 6 3 1 7 50
PAM PPT QH QT BB QN IFD PHB MB PRR BUF DUR BI PSR AGE
Prefer to avoid medication Prefer permanent treatment Answer to hysterectomy quiz question Answer to treatment quiz question Bothered by bleeding Number quiz questions correct (5 total) Interferes with daily activities Prefer to have a baby Score of most bothering symptom Prefers rapid relief Bothered by urinary frequency Duration Bothered by infertility Prefer a short recuperation Age of the patient
Key
7
Each attribute is abbreviated and can be found in the key on the right side of the table. All attributes that have a star following them are nominal attributes. Attributes with a number following them are ordinal attributes that have been transformed to binary nominal attributes. The number represents the threshold for which the value of the binary attributes was created. For example the first attribute on the hormone therapy list, PAM 6, documents if a patient answered the survey question “Do you prefer to avoid taking medications” with a score less than 6, or with a 6 or more. Likewise the next attribute down PAM 1 documents if the patient’s score was below 1 or not.
1 2 3 4 5 6 7 8 9 10 11 12 13 14 15
Rank
Table 2. This table shows the top 15 attributes as ranked by infogain for each treatment.
Exploration of Classification Techniques as a Treatment Decision Support Tool for Patients with Uterine Fibroids
8 Kevin Campbell MHI, N. Marcus Thygeson MD, Jaideep Srivastava PhD, Stuart Speedie PhD
information is useful, but we need specific models to understand how each variable contributes to a treatment decision. 3.5
Selection of Data Mining Algorithms
The following classification algorithms were evaluated with the WEKA Experimenter, and were chosen because of their past success and/or prevalence within the health care domain [4]. 1. 2. 3. 4. 5. 6.
Naïve Bayes Multilayer Perceptron Decision Stump J48 (C4.5 algorithm) Simple Cart JRip (RIPPER algorithm)
Each algorithm was executed with the one of three metalearning options: simple (no metalearning), Adaboost (10 iterations), and bagging (10 iterations). The 6 algorithms and 3 metalearning techniques yields 18 potential combinations, each of which was performed on data sets that were reduced with the infogain technique. For each treatment, we created nine variations of reduced feature sets, comprised of the top 10, 15, 20, 25, 30, 35, 50, 100, and 208 attributes determined via the infogain tool. Given the 18 different algorithm-metalearning combinations and the 9 different reduced feature sets, there were 162 experiments performed for each of the five treatment predictions. To the best of our knowledge, this paper presents the most comprehensive study empirically examining this topic to date. 3.6
Data Mining Process:
Each of the 100 training/test sets (20 per class) created via resampling were transformed and reduced based on the infogain results and then loaded into the WEKA Experimenter environment, which allowed us to evaluate how various data mining methods perform on multiple data sets. This module is automated and records detailed statistics on performance which can be saved for further analysis. 3.7
Evaluation
Because our data exhibited skewed class distributions, it was important to choose an appropriate metric by which to judge classifier performance. While accuracy is a metric widely used in machine learning, it is not appropriate in the rare class setting, where the goal is to optimize both the recall and precision of the rare class. For example, in predicting if a patient will decide on myomectomy or some other treatment, we would like to avoid predicting myomectomy when the patient will actually choose something else (poor precision) as well as failing to predict
Exploration of Classification Techniques as a Treatment Decision Support Tool for Patients with Uterine Fibroids 9
myomectomy when it is the correct choice (poor recall). Because both high recall and high precision from the rare class perspective are equally important with highly skewed classes, we chose the rare class F-measure, which is the harmonic mean of recall and precision, as a suitable metric of performance. F = 2 * Precision * Recall / (Precision + Recall) Others have shown that the F-measure is better suited for rare class data sets than area under the receiver operating characteristic curve (AUROC) or the geometric mean of recall and precision [12].
4
Results and Discussion
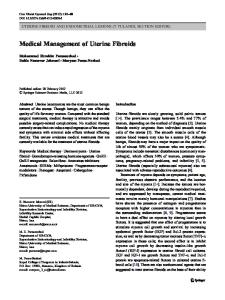
We performed 162 experiments for each treatment prediction. Table 3 lists the three best performing algorithm-metalearning-attribute combinations for each of the five treatments, as measured by F-measure, accuracy, and AUROC. Accuracy and AUROC results are displayed only for the sake of discussion and because they are often reported with classifier results. The results of the F-measure statistic will be discussed in more detail. Some important patterns emerge from the information contained in Table 3. First, Adaboost-Naïve Bayes was the highest performing algorithm-metalearning combination in the three rare class treatments—UAE, myomectomy, and hormone treatment. Further, the top three algorithms for the three rarer treatments were always Naïve Bayes. The only variation was in the metalearning technique or the selected number of attributes, which varied near 25 or 30. Moreover, the Naïve Bayes algorithm performed better on the other less critical performance metrics, AUROC and Accuracy, so in general Naïve Bayes is the best performing classifier for the rarer classes. Finally, the F-measure is generally below 0.5 with the rarer classes, indicating that the sum of false positives plus false negatives is greater than twice the number of true positives. In other words, there are far more classification errors pertaining to the rare class than is desirable. The hysterectomy and no-treatment classifiers performed better, with F-measures consistently exceeding 0.5. Using the F-measure, the J48 algorithm with bagging and 15 attributes performed best in both of these classes. The results using other performance measures are mixed. Table 3 also illustrates the prominent role metalearning can play in improving performance, as there are few high performing combinations that did not use either Adaboost or bagging. Figure 1 is a plot of the F-measure for the highest performing algorithms of each treatment as the number of attributes varies from 10 to 208. This graph illustrates the change in classifier performance that can occur as the number of attributes is altered. The three rare class curves are very similar. As attributes decrease, there is an increase in performance which peaks around 25-30 attributes and then begins to decrease again as more attributes are removed. The large performance improvement going from 208 to 50 attributes may be due to Naïve Bayes’ susceptibility to confounding variables. For the hysterectomy and no-treatment classes the F-measure
A NB (25) B NB (35)
3
A NB (30)
1 2
A NB (30) A J48 (35)
A NB (35)
1
3
S NB (30)
2
A NB (35)
3
A NB (30)
2
1
(4.1%) Algorithm
0.9651
0.9683
0.9709
94.42
94.86
95.15
0.4163
0.5093
0.5258
Metric
S NB (30)
B NB (35)
B NB (30)
A JR (100)
A SC (50)
A J48 (50)
A NB (25)
A NB (25)
A NB (30)
Algorithm
0.8375
0.8382
0.8399
87.25
87.61
87.97
0.4024
0.4039
0.4106
Metric
(11.1%)
Myomectomy
B NB (25)
S NB (30)
S NB (25)
A SC (25)
A SC (30)
A MP (35)
B NB (50)
S NB (50)
A NB (25)
Algorithm
0.8550
0.8553
0.8571
87.14
87.14
87.68
0.4695
0.4696
0.4831
Metric
(11.7%)
Hormone
Treatments
S NB (15)
B NB (25)
S NB (35)
B MP (15)
A JR (35)
B JR (35)
B SC (15)
S J48 (15)
B J48 (15)
Algorithm
0.8647
0.8694
0.8700
78.70
78.99
79.63
0.6842
0.6862
0.6910
Metric
(29.2%)
Hysterectomy
B NB (20)
B NB (15)
S NB (15)
S J48 (15)
B J48 (20)
B J48 (15)
S J48 (15)
B J48 (20)
B J48 (15)
Algorithm
0.8490
0.8519
0.8520
78.12
78.55
78.55
0.7757
0.7772
0.7781
Metric
(43.9%)
No Treatment
Note: Each algorithm-metalearning-attribute combination is listed beneath the word “algorithm.” The first letter indicates metalearning technique: Simple – no metalearning technique (S), Adaboost (A), or bagging (B). The second set of letters indicates the algorithm: Naïve Bayes (NB), Multipreceptron (MP), JRip (JR), Decision Stump (DS), J48, or Simple Cart (SC). The number in parentheses indicates the number of attributes used to build the model. The final number under “metric” is the performance of that particular classifier as calculated by the metrics listed in the first column of the table. The percentages beneath each treatment indicate the relative occurrence of each treatment within our original data set.
Area Under ROC
Accuracy (%)
F-Measure
Rank
UAE
Table 3. Top 3 performing algorithm-metalearning-attribute combinations by 3 different metrics.
Kevin Campbell MHI, N. Marcus Thygeson MD, Jaideep Srivastava PhD, Stuart Speedie PhD
Performance Metric
10
Exploration of Classification Techniques as a Treatment Decision Support Tool for Patients with Uterine Fibroids 11
is less sensitive to the number of attributes and peaks at 15 attributes. The legend of Figure 1 lists the treatments in order of descending frequency (test set percentages are 43.9, 29.2, 11.7, 11.1, and 4.1). We observe qualitatively that decreasing class frequency is associated with the following characteristics: worse performance, an increase in the number of attributes required to optimize performance, and increased curvature (sensitivity to attribute number). Treatment class rarity in the test set increases the sensitivity in the model to the number of attributes included.
Fig. 1. The F-measure of the best performing algorithm-metalearning combinations (in parentheses) for each treatment versus the number of attributes in the model.
5
Conclusion
In this paper, we demonstrate a useful data mining approach to decision making for uterine fibroid treatments. We used several data preprocessing strategies in order to optimize results from six well established classifying algorithms and two metalearning algorithms. We then ran these algorithms over a range of parameters to attempt to establish the best possible model, and algorithm to develop that model, within the limitations of our dataset. An Adaboost-Naïve Bayes combination with 2530 attributes selected performed best for rare classes, while a combination of bagging and a J48 decision tree, using only 15 attributes, performed best with common classes. The models developed from this project could be a potential starting point for an online decision support tool. A web based application could be offered to patients, which would display predictions for each treatment with an associated confidence level. This would give both patients and physicians some insight into the level of complexity of the decision faced by the patient. For example, those who receive a positive prediction for only hysterectomy, the decision may be a simple one, and the patient may need to schedule less time to consult with the physician. Conversely, those who receive positive predictions for several treatments, or for only rare class treatments, may need more time for consultation. New data, including long term satisfaction, could be incorporated into the application in order to improve the usefulness and accuracy of the predictions for all treatment classes. Given that there are annually 1.6 million women diagnosed with fibroids in the United States alone,
12 Kevin Campbell MHI, N. Marcus Thygeson MD, Jaideep Srivastava PhD, Stuart Speedie PhD
the potential power for an application such as this is noteworthy [15]. Further, the most accurate and readable decision trees or rule based models could be distributed to patients or physicians and function as a learning tool or reference in order to highlight important factors in the decision process. The methods in this paper could be extended to future research that employs other techniques such as support vector machines or clustering and classifier ensembles. The processes described here could also be applicable to other types of medical decisions, preference-sensitive or otherwise, as well as other decision making domains.
6
References
1. Viswanathan, M., Hartmann, K., McKoy, N., Stuart, G., Rankins, N., Thieda, P., Lux, L.J., Lohr, K.N.:Management of Uterine Fibroids: an Update of the Evidence. Evid Rep Technol Assess (Full Rep) 154, 1--122 (2007) 2. Kahneman, D., Slovic, P., Tversky, A.: Judgement Under Uncertainty: Heuristics and Biases. New York: Cambridge University Press (1982) 3. Brown, D.E.: Introduction to Data Mining for Medical Informatics. Clinical Lab Medicine 28(1), 9—35 (2008) 4. Aftarczuk, K.: Evaluation of Selected Data mining Algorithms Implemented in Medical Decision Support Systems. Blekinge Institute of Technology School of Engineering: Blekinge. (2007) 5. Lally, O.: The Quality of Life of Women Who Suffer From Uterine Fibroids: When is the Dysfunction Enough. Northern Kentucky University: Highland Heights (2008) 6. Cook, E.D.: Patterns of Care for Women With Uterine Leiomyoma. University of Massachusetts School of Public Health, Amherst (2003) 7. Solberg, L.I., Asche, S.E., Anderson, L.H., Sepucha, K., Thygeson, N.M., Madden, J.E., Morrissey, L., Kraemer, K.K.: Evaluating Preference-Sensitive Care for Uterine Fibroids: It’s Not So Simple. J. of Women’s Health 7(18), (2009) 8. Nagori, M., Suvarna, P., Kshirsagar, V.: Managing Asthma in Children and Analyzing Best Possible Treatment With Data Mining Approach of Classification. In: World Congress on Engineering and Computer Science, San Francisco (2009) 9. Baca-Garcia, E., Perez-Rodriguez, M.M., Basurte-Villamor, I., Saiz-Ruiz, J., Leiva-Murillo, J. M., de Prado-Cumplido, M., Santiago-Mozos, R., Artes-Rodriguez, A., de Leon, J.: Using data mining to explore complex clinical decisions: A study of hospitalization after a suicide attempt.J. Clin. Psychiatry 67(7), 1124—32 (2006). 10. Lavrac, N.: Selected Techniques for Data Mining in Medicine. Artif. Intell. Med. 16(1), 3-23 (1999) 11. Solberg, L.I., Asche, S.A., Sepucha, K., Thygeson, N.M., Madden, J.E., Morrissey, L., Kraemer, K.K., Anderson, L.H.: Informed Choice Assistance for Women Making Uterine Fibroid Treatment Decisions: A Practical Clinical Trial. Med Decis Making. Nov 30. (2009) [Epub ahead of print] 12. Joshi, M.V.: On Evaluating Performance of Classifiers for Rare Classes. In: Proceeding of the 2002 IEEE International Conference on Data Mining, p. 64 (2002) 13. The Mathworks, Inc., http://www.mathworks.com 14. Witten, I.H., Frank E.: Data Mining, practical Machine Learning Tools and Techniques. San Fancisco: 2nd Elsevier. (2005) 15. National Uterine Fibroids Foundation, http://www.nuff.org