JOURNAL OF CHEMICAL PHYSICS
VOLUME 119, NUMBER 3
15 JULY 2003
Pore size distribution, survival probability, and relaxation time in random and ordered arrays of fibers Manolis M. Tomadakis Department of Chemical Engineering, Florida Institute of Technology, Melbourne, Florida 32901-6975
Teri J. Robertson Hydrogen R&D Division, Florida Solar Energy Center, University of Central Florida, Cocoa, Florida 32922
共Received 11 February 2003; accepted 22 April 2003兲 We present a random walk based investigation of the pore size probability distribution and its moments, the survival probability and mean survival time, and the principal relaxation time, for random and ordered arrays of cylindrical fibers of various orientation distributions. The dimensionless mean survival time, principal relaxation time, mean pore size, and mean square pore size are found to increase with porosity, remain practically independent of the directionality of random fiber beds, and attain lower values for ordered arrays. Wide pore size distributions are obtained for random fiber structures and relatively narrow for ordered square arrays, all in very good agreement with theoretically predicted limiting values. Analytical results derived for the pore size probability and its lower moments for square arrays of fibers practically coincide with the corresponding simulation results. Earlier variational bounds on the mean survival time and principal relaxation time are obeyed by our numerical results in all cases, and are found to be quite sharp up to very high porosities. Dimensionless groups representing the deviation of such bounds from our simulation results vary in practically the same range as the corresponding values reported earlier for beds of spherical particles. A universal scaling expression of the literature relating the mean survival time to the mean pore size 关S. Torquato and C. L. Y. Yeong, J. Chem. Phys. 106, 8814 共1997兲兴 agrees very well with our results for all types of fiber structures, thus validated for the first time for anisotropic porous media. © 2003 American Institute of Physics. 关DOI: 10.1063/1.1582431兴
I. INTRODUCTION
and reaction, x-ray tomographic analysis, and digitization and numerical reconstruction of porous media, such as sandstones, beds of spheres, and porous gels. A number of studies on porous media9–14 involve the concept of mean survival time, i.e., the average travel time of a molecule in steady-state Brownian diffusion before colliding and reacting with the pore wall, under infinite surface reaction rate conditions. Some of these studies also involve the broader concept of survival probability, representing the fraction of molecules that survive 共do not react兲 up to a certain time during the process; the survival probability has also been the focus of extensive research on diffusion-controlled reactions in nonporous environments.15 The notion of mean survival time is equivalent to that of a mean residence time in a portion of the coordinate space,16 and is integral to many diffusion and reaction processes involving porous media. For instance, Drewry and Seaton12 used their simulation results for the mean survival time to derive the rate constant for heterogeneous reaction in catalyst particles. Torquato and Kim13 presented a direct link between the survival probability and the volume-integrated magnetization, a quantity of principal interest in nuclear magnetic resonance 共NMR兲 studies. Torquato and Yeong14 derived a universal scaling relation linking the mean survival time to the mean pore size, porosity, and specific surface area of the porous medium. Banavar and Schwartz17 applied numerical calculations
Fibrous porous media are encountered in a broad spectrum of modern technology applications, including paper products, thermal insulations, fibrous filters and membranes, physiological systems and processes, and fiber-reinforced composites used extensively in the aerospace and automobile industry. In the recent past, Tomadakis and Sotirchos1–3 investigated the formation factor of random fibrous structures of various orientation distributions, allowing prediction of the corresponding thermal and electrical conductivities, dielectric constants, molecular diffusivities and magnetic permeabilities; they further examined the fiber structures with regards to their percolation and diffusion properties, as well as the track length distributions resulting from their traversal by random lines.4 Pore size distribution functions have been reported by other researchers for two-dimensional arrays of fibers, i.e., arrays of random lines on a plane.5 Experimental and theoretical investigations by Sotirchos and co-workers6 revealed the strong influence of pore size distribution on the transport of gas mixtures in porous media and the performance of gas–solid reaction processes, such as the desulfurization of coal gas using limestone or zinc oxide sorbent particles. Prager7 used the pore size distribution function to derive variational bounds and estimates of interphase transfer rates in random two-phase media. Torquato and co-workers8 –10 used the function in studies of diffusion 0021-9606/2003/119(3)/1741/9/$20.00
1741
© 2003 American Institute of Physics
Downloaded 02 Apr 2007 to 128.97.46.58. Redistribution subject to AIP license or copyright, see http://jcp.aip.org/jcp/copyright.jsp
1742
J. Chem. Phys., Vol. 119, No. 3, 15 July 2003
M. M. Tomadakis and T. J. Robertson
on two types of granular media, in search of a correlation between the viscous permeability k and the NMR relaxation time, T 1 ; they found a strong correlation between k and the group 4 T 21 , being the porosity, for fully saturated systems. This relation was later tested and validated or moderately upgraded for various types of porous media, such as beds of spherical particles, polymer membranes, and consolidated sandstones.18,19 Borgia et al.19 discussed a number of studies on this subject; they also presented their own experimental investigation of the relationship between k and T 1 , , F 共F being the formation factor兲, and concluded that the relaxation time is the decisive parameter for the estimation of the viscous permeability k. Torquato and co-workers13,20 developed a series of variational bounds and approximations relating the viscous permeability of porous media to the mean survival time, principal relaxation time, and other diffusion parameters. Torquato and Avellaneda10 derived lower bounds on the principal relaxation time T 1 and mean survival time , in terms of the moments of the pore size distribution, and evaluated these moments and bounds for random arrays of overlapping and nonoverlapping spheres. The purpose of our present investigation is to compute the pore size probability distribution and its moments, the survival probability and mean survival time, and the principal relaxation time, for various types of fiber structures consisting of cylindrical fibers with axes parallel to a line 共1d random or ordered in a square array兲, parallel to a plane 共2d random兲, or oriented randomly in the three-dimensional space 共3d random兲. In Sec. II, we outline the basic theoretical principles and methods involved in this study. In Sec. III, we present our numerical results for all types of investigated fiber structures, along with our analytical results for the 1d square array, and compare them to variational bounds, earlier results on arrays of spheres, and the above mentioned universal scaling relation. Our main conclusions are summarized in Sec. IV.
tion probability P( ␦ )d ␦ is the probability that a randomly chosen point in the pore region lies at a distance between ␦ and ␦ ⫹d ␦ from the nearest point on the pore–solid interface. This definition facilitates the numerical computation of parameter ␦ and the corresponding pore size distribution, and was adopted in a number of later studies;8 –10 nevertheless, it should be born in mind that this modified ␦ is not any more a pore diameter, but rather a much smaller characteristic pore size, with values ranging from 0 to the pore radius, r p . For instance, the mean pore size of an infinitely long cylindrical pore of radius r p is readily derived 关from 具 ␦ 典 ⫽(1/V) 兰 ␦ dV, V being the pore volume兴 as 具 ␦ c 典 ⫽r p /3, while that of a spherical pore as 具 ␦ s 典 ⫽r p /4. The pore size distribution probability is of course independent of the employed unit length, therefore P( ␦ )d ␦ ⫽ P( ␦ /r)d( ␦ /r) and P( ␦ /r)⫽r P( ␦ ). At the extreme values of ␦, P( ␦ /r) attains the values
II. THEORETICAL PRINCIPLES AND METHODS
Substituting these expressions into Eq. 共3a兲, we obtain for the random arrays,
A. Pore size distribution
Scheidegger20 defined the ‘‘pore diameter’’ ␦ at any point within the pore space as ‘‘the diameter of the largest sphere which contains this point and remains wholly within the pore space.’’ He further defined the pore size distribution ‘‘based on the fraction P( ␦ ) of the total pore space that has a pore diameter between ␦ and ␦ ⫹d ␦ .’’ P( ␦ ) is normalized by the well known equation
冕
⬁
0
P 共 ␦ 兲 d ␦ ⫽1
共1兲
with the corresponding cumulative pore size distribution, F( ␦ ), given by F共 ␦ 兲⫽
冕
⬁
␦
P共 ␦ 兲d␦.
共2兲
Prager7 interpreted Scheidegger’s definition of ␦ as the size of the largest sphere centered at the point, i.e., he in effect redefined ␦ as the minimum distance of the point from the pore surface. By Prager’s definition, the pore size distribu-
P共 0 兲⫽
S Sb 4 ⫽ ⫽ , V ¯d
共3a兲
and P 共 ⬁ 兲 ⫽0,
共3b兲
where S and S b are the surface area and specific surface area of the porous medium, respectively, is the porosity, and ¯d the mean intercept length. For randomly overlapping fiber structures, ¯d is given from1 ⫺2r ¯d ⫽2r ¯⫽ , ln
共4兲
where r is the fiber radius and ¯r is the mean intercept halflength 共an average pore radius兲. For random nonoverlapping fiber structures, such as the square array studied here, the mean intercept length is obtained from2 2r ¯d ⫽2r ¯⫽ . 1⫺
P 共 0 兲 ⫽⫺2 ln ,
共5兲
共6兲
and for the square array P 共 0 兲 ⫽2
冉 冊
1 ⫺1 .
共7兲
The moments of the pore size distribution P( ␦ ) are defined from
具 ␦ n典 ⫽
冕␦ ⬁
0
n
P共 ␦ 兲d␦.
共8兲
The lower-order moments 具␦典 and 具 ␦ 2 典 can be used to derive lower bounds on the mean survival time, , and the principal relaxation time, T 1 , as discussed in the following section. B. Survival and relaxation time
The mean survival time, , of molecules undergoing steady-state Brownian diffusion may be obtained from integration of the corresponding survival probability, S(t),
Downloaded 02 Apr 2007 to 128.97.46.58. Redistribution subject to AIP license or copyright, see http://jcp.aip.org/jcp/copyright.jsp
J. Chem. Phys., Vol. 119, No. 3, 15 July 2003
⫽
冕
⬁
0
S 共 t 兲 dt.
Pore size distribution, survival probability and relaxation time
共9兲
Torquato and Kim13 expressed the survival probability as an infinite summation involving the diffusion relaxation times, T n , associated with the time-dependent solution of the Laplace equation for diffusional flow; they showed that for large t, ln S 共 t 兲 ⬃t/T 1 ,
共10兲
where T 1 is the principal or largest diffusion relaxation time, which may thence be obtained from the inverse of the slope of ln S(t) versus t, for large values of the survival time, t. Prager7 used the lower-order moments 具␦典 and 具 ␦ 2 典 of the pore size distribution function P( ␦ ) to obtain rigorous lower bounds on and T 1 for diffusion-controlled reactions 共infinite surface reaction rates兲,
⭓
具␦典
2
D
T 1⭓
具 ␦ 2典 D
共11兲
,
.
共12兲
Torquato and Avellaneda10 derived generalized versions of these bounds accounting for finite surface reaction rates. They claimed that Eq. 共12兲 should provide a rather coarse estimate of T 1 for systems of very wide fluctuations in pore size, while Eq. 共11兲 should be a more robust estimator of , especially at low porosities. Although most relevant literature studies refer to the survival time of molecules in a porous medium, the truly structure-dependent parameter is the dimensionless survival distance 共total path length until molecule reacts兲, s/r. Once the average value ¯s /r of this parameter is obtained, the corresponding mean survival time may be readily estimated ¯ /¯v , where ¯v is the molecular mean thermal speed. from ⫽s The resulting value of may be rendered dimensionless by means of Eqs. 共4兲 or 共5兲 and the fundamental relations D ¯ , relating the no-memory Brownian ⫽1/3¯v and Kn⫽/d random walk diffusion coefficient 共D兲 and the Knudsen number 共Kn兲 to the molecular mean free path 共兲, mean thermal ¯ ). The resulting dispeed (¯v ), and mean intercept length (d mensionless mean survival time is given for randomly overlapping fiber structures by
D r
2
⫽
⫺2 Kn共¯s /r 兲 , 3 ln
共13兲
and for unidirectional nonoverlapping fibers, such as the 1d square array, by
D r2
⫽
2 Kn共¯s /r 兲 . 3 共 1⫺ 兲
共14兲
The dimensionless mean survival distance ¯s /r may be obtained from random walk simulations using Kn⫽0.02, i.e., in the bulk regime, where Brownian diffusion prevails.
1743
C. Universal scaling
Torquato and Yeong14 used rigorous bounds on the mean survival time, along with their own and earlier theoretical results on and 具␦典 for various random and ordered isotropic arrays of spheres and digitized media of ⭐0.9, to derive the following universal scaling relation for diffusion-controlled reactions in porous media:
8 8 ⫽ ⫹ 2, 0 5 7
共15兲
where the reference time 0 and the length scale are given from
0⫽ ⫽
3 共 1⫺ 兲 DS 2b
具␦典2 0D
,
.
共16兲 共17兲
According to Eqs. 共15兲–共17兲, the mean survival time, , may be predicted from the values of porosity, , specific surface area, S b , mean pore size, 具␦典, and bulk diffusion coefficient, D. Torquato and Yeong14 claim that this relation should be applicable to a wide class of microstructures provided that ⬍0.5, as was the case with the data employed in its derivation.
D. Brownian diffusion random walk
The survival probability and mean survival time are estimated in this study from an earlier Brownian diffusion random walk simulation algorithm,1 marginally modified to account for molecular trajectory termination at first impact with the solid surface. A unit cubic cell is created first to represent numerically the random fiber structure; this is equivalent to the problem of generating a random line population in a convex body. Coleman22 described various ways such random secants could arise, with ‘‘mean free path randomness,’’ or ‘‘-randomness,’’ being the mechanism producing statistically homogeneous structures: The secants are defined by a random point on a reference plane and a random direction with respect to that plane, and have size and orientation distributions identical to those of actual paths of molecules moving randomly in the empty cell 共i.e., reflecting on the six faces of the cube兲. Trajectory computations begin by generating a random position within the unit cell. If the point falls within the void space it becomes the starting position for a random walk. A random direction is assigned to the walker, and a molecular free path is sampled from an exponential distribution. Before the molecule can be moved to this point, verification must be made that the molecule will not encounter a fiber or cell boundary within this distance. If no interference is found, the molecule is advanced the distance . If one or more fibers lie within the path of the advancing molecule, the shortest distance between the point of origin for this step and the fibers determines the next position of the walker. When infinite surface reaction rate is considered, no reflection of
Downloaded 02 Apr 2007 to 128.97.46.58. Redistribution subject to AIP license or copyright, see http://jcp.aip.org/jcp/copyright.jsp
1744
J. Chem. Phys., Vol. 119, No. 3, 15 July 2003
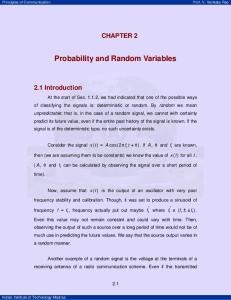
FIG. 1. Cumulative pore size probability distribution of random and ordered fiber structures of various orientation distributions.
the walker from the solid surface is accounted for, and the simulation continues by placing another random walker in the unit cell. When a random walker encounters the unit cell boundary, it is specularly reflected on it and reintroduced to the unit cell. This is equivalent to assuming that the porous medium is an infinite assemblage of identical unit cells where each neighboring cell is a mirror image of the next. The use of such boundary conditions does not introduce any measurable bias in the simulation results, provided that a high enough population of fibers is present in the unit cell, i.e., a big enough sample of the random fiber structure is investigated.23 The computation of the molecular trajectories is accelerated considerably by using time-saving modifications of the basic simulation algorithm, namely, a spherical inclusion technique exploiting the basic idea of first-passagetime 共FPT兲 random walks, and certain domain and path discretization schemes.23 By keeping track of the travel distance of the random walkers, as well as their initial distance from the closest solid surface, survival probability and pore size distributions can be derived for all types of random and ordered fiber structures covering a broad range of porosities. III. RESULTS AND DISCUSSION A. Pore size distribution
Figure 1 presents the cumulative probability distribution F( ␦ /r) at ⫽0.7 for all four types of random and ordered fiber structures investigated in this work. As mentioned in Sec. II A, F( ␦ /r) represents the fraction of points in the porous space whose dimensionless distance from the solid surface is higher than ␦ /r; naturally, all cumulative pore size distribution curves originate from point 共0,1兲. No significant fiber directionality effect is encountered for the three random structures, since the 1d, 2d, and 3d curves practically coincide; this was found to be the case throughout the porosity range. As shown in Fig. 1, the random beds encounter a wider range of pore sizes than the ordered square array, since
M. M. Tomadakis and T. J. Robertson
FIG. 2. Cumulative pore size probability distribution of three-directional random fiber structures of various porosities.
their stochastic nature allows for both very small and very big voids. The ordered nature of the square array facilitates geometrical derivation of analytical expressions for the cumulative pore size probability distribution. Setting ⫽1 ⫹ ␦ /r and ⫽r cp /r⫽ 21 冑 /(1⫺), where r cp is the close packing radius of the structure, we obtain For ⭐ : F 共 兲 ⫽1⫺ 共 1⫺ ⫺1 兲共 1⫺ 2 兲 ,
共18a兲
For ⭓ : F 共 兲 ⫽
2 ⫹ 2 关 cos⫺1 共 / 兲 ⫺ /4兴 ⫺ 冑 2 ⫺ 2 2 ⫺ /4
. 共18b兲
The maximum value of may be obtained from simple geometry as max⫽冑2, predicted also by Eq. 共18b兲 for F( ) ⫽0. For ⫽, Eqs. 共18a兲 and 共18b兲 reduce to the trivial F( )⫽ cp /, where cp⫽1⫺ /4 is the close packing porosity of the square array. As shown in Fig. 1, both equations are in very good agreement with our simulation results for the square array of fibers. The porosity effect on the cumulative pore size distribution of a 3d random fiber structure is illustrated in Fig. 2; it can be seen that higher-porosity beds encounter higher values of ␦ /r due to the bigger voids they contain, hence they also exhibit higher F( ␦ /r) values at any given ␦ /r. Figure 3 presents the pore size distribution P( ␦ /r) at ⫽0.4 for all types of random and ordered fiber structures under consideration. Since P( ␦ /r) represents the derivative of F( ␦ /r) at any given point, its values were derived from the cumulative distribution using a numerical differentiation scheme. For all curves shown in Fig. 3, the pore size probability density P(0) agrees very well with the earlier discussed theoretical predictions 关Eqs. 共6兲 and 共7兲兴. Furthermore, all differences in the P( ␦ /r) values of the three random array curves are of the order of their differences at ␦ /r⫽0, which are known from Eq. 共6兲 to be due to their minor porosity deviations from ⫽0.4共⫾0.005兲. This is true also for all other porosities investigated in this study, which leads us to postulate that all
Downloaded 02 Apr 2007 to 128.97.46.58. Redistribution subject to AIP license or copyright, see http://jcp.aip.org/jcp/copyright.jsp
J. Chem. Phys., Vol. 119, No. 3, 15 July 2003
Pore size distribution, survival probability and relaxation time
FIG. 3. Pore size probability distribution of random and ordered fiber structures of various orientation distributions.
1d, 2d, and 3d random beds of the same porosity exhibit practically identical pore size distribution. As also deduced from Fig. 3, the maximum pore size probability density, P( ␦ /r) max , attains a higher value for the square array structures, due to the narrower pore size distributions encountered in such beds. Analytical predictions for the pore size distribution of square arrays of fibers may be readily obtained through differentiation of Eqs. 共18a兲 and 共18b兲, For ⭐ : P 共 兲 ⫽2 共 1⫺ ⫺1 兲 , For ⭓ : P 共 兲 ⫽
2 关 cos⫺1 共 / 兲 ⫺ /4兴
2 ⫺ /4
共19a兲
.
共19b兲
FIG. 4. Pore size probability distribution of three-directional random fiber structures of various porosities.
1745
FIG. 5. Variation of the dimensionless mean pore size 关first moment of P( ␦ )] with the porosity for random and ordered fiber structures of various orientation distributions.
These equations are plotted in Fig. 3 for the square array of ⫽0.4, where they are seen to agree very well with our simulation results for that fiber structure. Figure 4 shows the P( ␦ /r) curves for 3d random structures of various porosities, derived from the cumulative probabilities F( ␦ /r) shown in Fig. 2. Our numerical estimates for P(0) agree very well with the predictions of Eqs. 共6兲 and 共7兲, as was the case with the results presented in Fig. 3. Furthermore, lower values of P( ␦ /r) max are encountered at higher porosities, due to the wider pore size distributions in dilute beds; naturally, the location of P( ␦ /r) max shifts to higher ␦ /r values as the porosity increases, due to the presence of bigger voids in such beds. David24 employed numerical simulations on twodimensional ordered pore networks to show that when the pore size distribution has a decreasing exponential-like shape—as opposed to nearly uniform distributions—the ‘‘hydraulic tortuosity’’ of the porous medium is much higher than its ‘‘electrical tortuosity,’’ by a factor of about 4 on the average for the networks he studied. Since the pore size distributions computed in our study for random fiber structures are indeed of that form, David’s observation is in excellent agreement with our own recent results on the relative value of the viscous and bulk tortuosity of random beds of fibers.25 Figures 5 and 6 present the variation of the dimensionless first and second moments of P( ␦ /r), namely, the mean pore size, 具 ␦ 典 /r, and the mean square pore size, 具 ␦ 2 典 /r 2 , with the porosity, for all four types of fiber structures examined in our study. In accordance with the observations made in Figs. 1– 4, the random bed values of both moments are independent of fiber directionality and considerably higher than the corresponding square array values, at any porosity level. The latter are in excellent agreement with the analytical predictions obtained from Eqs. 共8兲, 共19a兲, and 共19b兲,
具 ␦ sq典 r
⫽
关 冑2⫹ln共 冑2⫹1 兲兴 ⫺⫺2 , 3
共20兲
Downloaded 02 Apr 2007 to 128.97.46.58. Redistribution subject to AIP license or copyright, see http://jcp.aip.org/jcp/copyright.jsp
1746
J. Chem. Phys., Vol. 119, No. 3, 15 July 2003
M. M. Tomadakis and T. J. Robertson
FIG. 6. Variation of the dimensionless mean square pore size 关second moment of P( ␦ )] with the porosity for random and ordered fiber structures of various orientation distributions.
FIG. 8. Survival probability distribution in three-directional random fiber structures of various porosities.
B. Survival probability 2 具 ␦ sq 典
r2
⫽
4 关 ⫺ 冑2⫺ln共 冑2⫹1 兲兴 ⫹⫹5 . 6
共21兲
A regression analysis of the ratio of simulation estimate to analytical prediction for square arrays of ⭐0.9 gives 具具 ␦ 典 sim / 具 ␦ 典 Eq. (20) 典 ⫽1.001⫾0.003 and 具具 ␦ 2 典 sim / 具 ␦ 2 典 Eq. (21) 典 ⫽1.000⫾0.007, underlining the nearly perfect agreement of numerical and analytical results. For the randomly overlapping fiber structures, the ratio 具 ␦ 2 典 / 具 ␦ 典 2 varies from 1.79 to 1.39 in the porosity range 0.1–0.9, in very good agreement with the observations of Torquato and Avellaneda10 for beds of randomly overlapping spheres, where the same ratio is reported to vary from 1.73 to 1.35, over the same range of porosity.
FIG. 7. Survival probability distribution in random and ordered fiber structures of various orientation distributions.
Figure 7 presents the survival probability distribution S(t) at ⫽0.5 for all random and ordered arrays of fibers investigated in our work, with each curve obtained from 10 000 random walks. As shown in the figure, the three random structures behave practically as one, as was the case with the corresponding pore size distributions presented in Sec. III A. The ordered array encounters lower S(t) values, since molecules terminate their trajectories sooner due to the smaller voids contained in such structures. A more elaborate look at the survival probability is offered in Figs. 8 and 9, which show the evolution of S(t) with throughout the porosity range for the 3d random and 1d square array, respectively. Both figures show higher survival probability values at higher porosities, as anticipated by intuition, with the difference becoming more pronounced for very dilute beds.
FIG. 9. Survival probability distribution in unidirectional square arrays of fibers of various porosities.
Downloaded 02 Apr 2007 to 128.97.46.58. Redistribution subject to AIP license or copyright, see http://jcp.aip.org/jcp/copyright.jsp
J. Chem. Phys., Vol. 119, No. 3, 15 July 2003
Pore size distribution, survival probability and relaxation time
1747
FIG. 11. Variation of the dimensionless mean survival time with the Knudsen number. FIG. 10. Variation of the dimensionless mean survival time with the porosity for random and ordered fiber structures of various orientation distributions.
The variation of the dimensionless mean survival time, D/r 2 , with the porosity is presented in Fig. 10. In agreement with the observations made in Fig. 7, minor differences are encountered in the behavior of 1d, 2d, and 3d random beds of fibers, but considerably lower survival times are obtained for square arrays. The lower bound by Prager7 and Torquato and Avellaneda10 关Eq. 共11兲兴 is also plotted in Fig. 10 for both the random and ordered fiber structures, as derived from the 具 ␦ 典 /r values presented in Fig. 5. It is readily seen that the bound is quite sharp, and is obeyed by our simulation results for all structures, throughout the porosity range. For ⭐0.9, the bound underpredicts the simulation results by a factor of 1.5–1.8 for random arrays and 1.6 –2.4 for square arrays, with the deviation becoming more pronounced at higher porosities. Torquato and Yeong14 plot D/r 2 versus 具 ␦ 典 2 /r 2 for five types of random and ordered, overlapping and nonoverlapping arrays of spheres of ⭐0.9. The ratios /( 具 ␦ 典 2 /D) obtained from their data vary from 1.75 to 2.1, in very good agreement with our results for fiber structures. Table I offers a comparison of the dimensionless mean survival distance, ¯s /r, to the mean intercept radius, ¯r /r, and TABLE I. Comparison of the mean survival distance to the mean pore size and mean intercept radius for 3d random arrays of fibers.
¯s /r
¯r /r
具 ␦ 典 /r
¯r / 具 ␦ 典
0.99 0.95 0.9 0.8 0.7 0.6 0.5 0.4 0.3 0.2 0.1
285.9 108.1 67.6 48.1 37.1 30.2 24.5 21.3 17.1 13.1 10.3
99.5 20.8 9.01 4.27 2.83 2.00 1.48 1.11 0.83 0.61 0.43
9.02 3.27 2.20 1.33 0.92 0.69 0.53 0.43 0.33 0.25 0.18
11.0 6.35 4.10 3.21 3.07 2.90 2.79 2.57 2.51 2.42 2.39
the mean pore size, 具 ␦ 典 /r, for 3d random fiber beds of various porosities. As is evident on this table, the mean survival distance is much higher than both other values, as it represents the total length of a multistep Brownian movement from the void space to the fiber surface. On the other hand, the mean pore size 具 ␦ 典 /r represents the one-step shortest distance from a point in the void space to the solid surface, therefore it attains the lowest values among all three parameters. The dimensionless mean intercept radius ¯r /r represents also a one-step distance from the void space to the fiber surface; however, instead of the shortest distance, intercept steps follow the -random orientation distribution of actual molecular paths, which makes their average size higher than 具 ␦ 典 /r. Table I shows also the relative values ¯r / 具 ␦ 典 in 3d random fiber structures; interestingly, for the most part of the porosity range, this ratio varies from about 2.4 to 3.2, i.e., very close to the values 2.67共⫽8/3兲 and 3 corresponding to spherical and cylindrical pores, respectively 共derived from ¯r ⫽2V/S and the values of 具 ␦ 典 /r presented in Sec. II A兲. This is not the case with very dilute beds, where the fibers occupy a very small part of the total volume, hence ¯r increases dramatically with while 具␦典 increases much slower, as it represents the distance from the closest fiber, not one hit randomly. All survival time and distance results presented as distributions or mean values in Figs. 7–10 and Table I were obtained from Brownian diffusion random walk simulations, using a Knudsen number value Kn⫽0.02. Figure 11 shows the dependence of such numerical results on Kn for a 3d random bed of fibers of ⫽0.5. As shown on this plot, the dimensionless mean survival time D/r 2 is practically independent of the Knudsen number for Kn⭐0.02, i.e., as long as the random walks are carried out in the Brownian diffusion regime. For high values of Kn, one straight path step is all it takes for a molecule to reach the solid surface, which transforms the mean survival distance to a mean intercept radius of fixed value, independent of Kn. In accordance with Eq. 共13兲, this results to the linear behavior of D/r 2 versus Kn observed in Fig. 11.
Downloaded 02 Apr 2007 to 128.97.46.58. Redistribution subject to AIP license or copyright, see http://jcp.aip.org/jcp/copyright.jsp
1748
J. Chem. Phys., Vol. 119, No. 3, 15 July 2003
FIG. 12. Variation of the dimensionless principal relaxation time with the porosity for random and ordered fiber structures of various orientation distributions.
C. Relaxation time
Figure 12 presents the variation of the dimensionless principal relaxation time, T 1 , with the porosity, for all fiber structures examined in this study. The results are qualitatively similar to those shown in Fig. 10 for the dimensionless mean survival time. The lower bound by Prager7 and Torquato and Avellaneda10 关Eq. 共12兲兴, derived from our 具 ␦ 2 典 /r 2 data shown in Fig. 6, is obeyed by our T 1 results in all cases; it is also less sharp for the random beds than the corresponding bound on 共Fig. 10兲, in accordance with earlier predictions.10 The bound underpredicts the measured T 1 by a factor of about 2 for random beds and 1.5 for square arrays, for porosities in the range 0.2–0.9, and by a higher factor for more dilute beds. The fact that the bound is sharper for the square array than it is for the random beds agrees with an earlier proposition that this bound should yield a reasonable estimate on the relaxation time of porous media with finite pore size range.10 A comparison of the T 1 results of Fig. 12 to the results of Fig. 10 reveals that the mean survival time is bounded from above by the relaxation time T 1 , as suggested earlier based on theoretical results on beds of spheres.10 Furthermore, the ratio T 1 / is found lower than 2.5 for all but the lowest-porosity random fiber beds, approaching unity in the dilute limit for all types of random and ordered fiber structures investigated in our work; this is in excellent agreement with the results of Torquato and Kim13 for beds of spheres ordered in SC, FCC, and BCC arrangement. Lower ratios are obtained for the square array of fibers, reaching a maximum of about 1.5 near the close packing limit, where molecules are practically isolated in identical single pores with concave walls. It may be worth mentioning that practically the same value of T 1 / , namely 15/ 2 ⫽1.52, was obtained earlier for diffusion interior to isolated spherical pores.10 The values of T 1 shown in Fig. 12 were derived from the corresponding survival probability distributions S(t) using
M. M. Tomadakis and T. J. Robertson
FIG. 13. Comparison of the universal scaling expression for the mean survival time 关Eq. 共15兲兴 to our simulation results for random and ordered fiber structures of various orientation distributions.
Eq. 共10兲; from the 10 000 random walkers used to obtain S(t), only the ten with the largest survival times 共i.e., the top 0.1%兲 were used to get the average slope of ln S(t) versus t, yielding T 1 . All values of T 1 were then recalculated from only one slope value for each run 共obtained from the two highest survival times兲, and compared to those presented in Fig. 12; a regression analysis gave 具 T 1 (10)/T 1 (1) 典 ⫽0.98 ⫾0.08, with the average ratio and standard deviation being practically independent of porosity and type of structure. Eight more simulations were run for the 3d random bed of 50% porosity, using 2 500– 65 000 random walkers, and estimating T 1 again from the top 0.1% of the measured t values. A regression analysis of the derived values gave 具 T 1 (N)/T 1 (104 ) 典 ⫽1.01⫾0.05, indicating again a negligible effect of the number of employed random walkers, N, on the accuracy of the estimated T 1 . D. Universal scaling
Our results for the mean survival time and the mean pore size 具␦典 were scaled by means of the time scale / 0 and length scale using Eqs. 共16兲 and 共17兲, and plotted in Fig. 13 for comparison to the ‘‘universal curve’’ 关Eq. 共15兲兴 proposed by Torquato and Yeong.14 The plot shows very good agreement of our results with Eq. 共15兲 throughout the porosity range for all types of random fiber structures, and up to a very high porosity 共⬇0.9兲 for the square array of fibers. This is the first time that Eq. 共15兲 is validated for statistically anisotropic media, such as the 1d square array and the 1d and 2d random fiber beds investigated in this work. This result lends further support to the universal character of this scaling expression which enables a direct estimation of any one of , , S b , 具␦典, from the values of the other three parameters. IV. SUMMARY AND REMARKS
We investigated the pore size probability distribution and its moments, the survival probability and mean survival time,
Downloaded 02 Apr 2007 to 128.97.46.58. Redistribution subject to AIP license or copyright, see http://jcp.aip.org/jcp/copyright.jsp
J. Chem. Phys., Vol. 119, No. 3, 15 July 2003
and the principal relaxation time, for various types of fiber structures. We considered random porous media consisting of cylindrical fibers randomly distributed in space with their axes parallel to a line 共1d兲, parallel to a plane 共2d兲, or oriented randomly in the three-dimensional space 共3d兲, with the fibers allowed to overlap freely in all three cases. We also studied an ordered structure, formed by parallel cylindrical nonoverlapping fibers arranged in a square-array configuration. We applied a Brownian diffusion random-walk simulation technique to obtain the pore size distribution P( ␦ ) and survival probability S(t) in the randomly overlapping and square array fiber structures, at different porosities. This numerical data was then used to derive the moments 具␦典 and 具 ␦ 2 典 , mean survival time, , and principal relaxation time, T 1 , and test the accuracy of variational bounds and a universal scaling expression. The dimensionless mean survival time and principal relaxation time were found to increase with porosity, remain practically independent of the directionality of random fiber beds, and attain lower values for ordered arrays. The dimensionless mean pore size, 具 ␦ 典 /r, and mean square pore size, 具 ␦ 2 典 /r 2 , were found to follow the same general trends, too, with regards to the porosity, directionality, and order effects. The corresponding pore size probability distributions were found typically wide for random fiber structures, but narrow for square arrays, and in very good agreement with theoretically predicted limiting values at ␦⫽0, for all types of structures. For the square array of fibers, we derived analytical results for the pore size probability and its moments, which were found to practically coincide with the corresponding numerical results in all cases. The variational lower bounds ⭓ 具 ␦ 典 2 /D and T 1 ⭓ 具 ␦ 2 典 /D are obeyed by our simulation results in all cases, and are quite sharp up to very high porosities, in agreement with earlier predictions. The bound ⭐T 1 is also obeyed by our numerical results for all random and ordered arrays of fibers, becoming an equality at the dilute limit. For all random and ordered fiber structures, the values of the ratios 具 ␦ 2 典 / 具 ␦ 典 2 , D/ 具 ␦ 典 2 , T 1 D/ 具 ␦ 2 典 , and T 1 / were found to vary in practically the same range as the corresponding ratios reported earlier for beds of spherical particles, revealing some fundamental similarity in the transport and structural properties of these otherwise very different families of porous media. A universal curve relating the mean survival time to the mean pore size through properly defined length and time scales, derived earlier for various types of sphere assem-
Pore size distribution, survival probability and relaxation time
1749
blages, was found to agree throughout the porosity range with our numerical data for random fiber structures, and up to a very high porosity 共⬇0.9兲 for the square array. This is the first validation of this scaling expression for anisotropic porous media, lending support to the claim that it describes a broad variety of porous structures. ACKNOWLEDGMENT
This work was supported in part by a grant from the Florida Solar Energy Center. M. M. Tomadakis and S. V. Sotirchos, J. Chem. Phys. 98, 616 共1993兲. M. M. Tomadakis and S. V. Sotirchos, J. Chem. Phys. 99, 9820 共1993兲. 3 M. M. Tomadakis and S. V. Sotirchos, J. Chem. Phys. 104, 6893 共1996兲. 4 M. M. Tomadakis and S. V. Sotirchos, J. Chem. Phys. 109, 4508 共1998兲; AIChE J. 39, 397 共1993兲; 37, 74 共1991兲; 37, 1175 共1991兲; Radiat. Res. 135, 302 共1993兲. 5 P. R. Johnston, Filtr. Sep. 35, 287 共1998兲; H. W. Piekaar and L. A. Clarenburg, Chem. Eng. Sci. 22, 1399 共1967兲; H. K. Corte and E. H. Lloyd, in Consolidation of the Paper Web 共British Paper and Board Makers’ Association, London, 1966兲, pp. 981–1009. 6 E. A. Efthimiadis and S. V. Sotirchos, Chem. Eng. Sci. 48, 1971 共1993兲; S. Zarkanitis and S. V. Sotirchos, AIChE J. 35, 821 共1989兲; S. V. Sotirchos and H. C. Yu, Chem. Eng. Sci. 40, 2039 共1985兲. 7 S. Prager, Chem. Eng. Sci. 18, 227 共1963兲. 8 D. A. Coker and S. Torquato, J. Appl. Phys. 77, 6087 共1995兲; C. L. Y. Yeong and S. Torquato, Phys. Rev. E 58, 224 共1998兲; M. D. Rintoul and S. Torquato, J. Colloid Interface Sci. 186, 467 共1997兲. 9 G. A. Coker, S. Torquato, and J. H. Dunsmuir, J. Geophys. Res. 101, 17497 共1996兲; M. D. Rintoul, S. Torquato, C. Yeong, D. T. Keane, S. Erramilli, Y. N. Jun, D. M. Dabbs, and I. A. Aksay, Phys. Rev. E 54, 2663 共1996兲; C. Manwart, S. Torquato, and R. Hilfer, ibid. 62, 893 共2000兲. 10 S. Torquato and M. Avellaneda, J. Chem. Phys. 95, 6477 共1991兲. 11 D. A. Coker and S. Torquato, J. Appl. Phys. 77, 955 共1995兲. 12 H. P. G. Drewry and N. A. Seaton, AIChE J. 41, 880 共1995兲. 13 S. Torquato and I. C. Kim, J. Appl. Phys. 72, 2612 共1992兲. 14 S. Torquato and C. L. Y. Yeong, J. Chem. Phys. 106, 8814 共1997兲. 15 G. Srinivas, K. L. Sebastian, and B. Bagchi, J. Chem. Phys. 116, 7276 共2002兲; J. Sung, E. Barkai, R. J. Silbey, and S. Lee, ibid. 116, 2338 共2002兲; H.-X. Zhou, ibid. 108, 8139 共1998兲. 16 N. Agmon, J. Chem. Phys. 81, 3644 共1984兲. 17 J. R. Banavar and L. M. Schwartz, Phys. Rev. Lett. 58, 1411 共1987兲. 18 K. J. Dunn, G. A. LaTorraca, and D. J. Bergman, Geophysics 64, 470 共1999兲; A. Viallat and M. M. Margulies, Eur. Phys. J. E 2, 117 共2000兲; W. E. Kenyon, P. I. Day, C. Straley, and J. F. Willemsen, SPE Formation Evaluation, September, 1988, p. 622. 19 G. C. Borgia, V. Bortolotti, A. Brancolini, R. J. S. Brown, and P. Fantazzini, Magn. Reson. Imaging 14, 751 共1996兲. 20 S. Torquato, Phys. Rev. Lett. 64, 2644 共1990兲; M. Avellaneda and S. Torquato, Phys. Fluids A 3, 2529 共1991兲; L. M. Schwartz, N. Martys, D. P. Bentz, E. J. Garboczi, and S. Torquato, Phys. Rev. E 48, 4584 共1993兲. 21 A. E. Scheidegger, The Physics of Flow Through Porous Media 共University of Toronto Press, Toronto, 1957兲, p. 7. 22 R. Coleman, J. Appl. Probab. 6, 430 共1969兲. 23 M. M. Tomadakis, Ph.D. thesis, University of Rochester, Rochester, 1993. 24 C. David, J. Geophys. Res., 关Solid Earth兴 98, 12267 共1993兲. 25 M. M. Tomadakis and T. J. Robertson, Phys. Rev. B 共to be published兲. 1 2
Downloaded 02 Apr 2007 to 128.97.46.58. Redistribution subject to AIP license or copyright, see http://jcp.aip.org/jcp/copyright.jsp