Outline Chapter 3: Random Sampling, Probability, and the Binomial Distribution Part II
I
Density Curves
I
Random Variables
I
The Binomial Distribution
I
Fitting a Binomial Distribution to Data
Eric D. Nordmoe Math 261 Department of Mathematics and Computer Science Kalamazoo College
Spring 2009
Random Sampling Model
Random Variables A random variable is a variable that takes on numerical values that depend on the outcome of a chance operation.
Probability Model
Types of Random Variables
Random Sampling
Population
Sample
I
Continuous random variables take values on a continuous scale.
I
Discrete random variables have a discrete list of possible values.
Probability Models for Random Variables
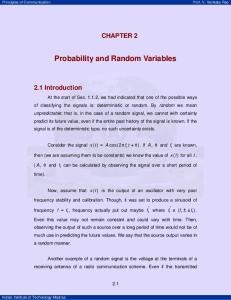
Density Curve Example
The method of characterizing the distribution of a random variable depends on the nature of the variable:
0.005
0.010
The distribution of a continuous random variable is described by a density curve. I
A probability density may be viewed as an idealized histogram.
0.000
Continuous Random Variables
Density
The distribution of a discrete random variable is described by the probability distribution comprised of enumerated possible values and corresponding probabilities.
0.015
Discrete Random Variables
I
A stylistic example
50
100
150
Diastolic Blood Pressure
Histogram Density Curve
I
I I
The proportion of the distribution that falls in that range. The probability that a randomly selected individual has a value in that range.
0.25 0.20
The total area underneath the density is 1. The area under the curve and above any range of values can be interpreted in two ways:
0.15
I
0.10
The density curve always lies on or above the horizontal axis.