273 Performance review
Aviva plc Annual Report and Accounts 2011
Notes to the consolidated financial statements continued
47 – Pension obligations
(a) Introduction
Governance
The Group operates a large number of defined benefit and defined contribution pension schemes around the world. The only material defined benefit schemes are in the UK, Canada and Ireland and, prior to its deconsolidation, the Netherlands. Of these, the main UK scheme is by far the largest. This note gives full IAS 19 disclosures for these schemes while the smaller ones, while still measured under IAS 19, are included as one total within Provisions (see note 46). Similarly, while the charges to the income statement for the main schemes are shown in section (e)(iv) below, the total charges for all pension schemes are disclosed in section (d) below. The assets of the UK, Irish and Canadian schemes are held in separate trustee-administered funds to meet long-term pension liabilities to past and present employees. In all schemes, the appointment of trustees of the funds is determined by their trust documentation, and they are required to act in the best interests of the schemes’ beneficiaries. The long-term investment objectives of the trustees and the employers are to limit the risk of the assets failing to meet the liabilities of the schemes over the long term, and to maximise returns consistent with an acceptable level of risk so as to control the long-term costs of these schemes. A full actuarial valuation of each of the defined benefit schemes is carried out at least every three years for the benefit of scheme trustees and members. Actuarial reports have been submitted for each scheme within this period, using appropriate methods for the respective countries on local funding bases.
Corporate responsibility
This note describes the Group’s pension arrangements for its employees and explains how our obligations to these schemes are calculated.
(b) Membership
The number of scheme members was as follows: United Kingdom
Ireland
Canada
2010 Number
2011 Number
2010 Number
2011 Number
2010 Number
Active members Deferred members Pensioners
— 57,328 30,447
7,261 52,833 29,754
1,063 998 707
1,082 933 683
636 577 1,284
732 578 1,288
Total members
87,775
89,848
2,768
2,698
2,497
2,598
As noted below, the final salary sections of both UK schemes were closed to future accrual with effect from 1 April 2011. (c) UK schemes
Other information
The Company works closely with the trustees who are required to consult it on the funding of the scheme and its investment strategy. Following each actuarial valuation, the Company and the trustees agree the level of contributions needed and funding levels are then monitored on an annual basis. At 31 March 2009, the date of the last actuarial valuation, this section of the scheme had an excess of obligations over available assets, on a funding basis, which uses more prudent assumptions than are required for reporting under IAS 19, of £3.0 billion. As a result of that valuation, the Company and the trustees have agreed a long-term funding plan where contributions, together with anticipated growth in scheme investments, are expected to eliminate the funding deficit over time. Under this agreement, deficit funding payments of £378 million were made in 2010, and £178 million in 2011. Further funding payments of £150 million are expected in 2012. The funding payments, the reduction in scheme liabilities arising from scheme closures described above and the benefits arising from interest rate and inflation hedging activity have been partially offset by the impact of adverse market conditions, in particular significant falls in real gilt yields. At 31 December 2011, the funding deficit is estimated to have fallen to £2.3 billion. The employing companies’ contributions to the defined benefit section of the ASPS for the first three months of 2011 were 48% of employees’ pensionable salaries, together with the cost of redundancies during the year and the additional deficit funding described above, together totalling £239 million. Active members of this section of the ASPS contributed between 5% and 7.5% of their pensionable salaries during the same period in 2011.
Financial statements MCEV
(i) Defined benefit section of the ASPS
Financial statements IFRS
In the UK, the Group operates two main pension schemes, the Aviva Staff Pension Scheme (ASPS) and the smaller RAC (2003) Pension Scheme, the obligation to which was retained after the sale of RAC Limited in September 2011. New entrants join the defined contribution section of the ASPS, as the defined benefit section is closed. This scheme is operated by a trustee company, with 11 trustee directors, comprising representatives of the employers, staff, pensioners and an independent trustee (referred to below as the trustees). On 20 October 2010, following formal consultation, the Group confirmed its decision to close the final salary sections of both UK schemes with effect from 1 April 2011, with entry into the defined contribution sections being offered to the staff members affected. The consequential reduction in the liabilities of both schemes, arising from projecting forward salaries using estimates of inflation rather than salary inflation, together with additional contributions to affected members’ defined contribution accounts and implementation costs, resulted in an overall gain on closure of £286 million, which was accounted for in 2010. Closure of the schemes has removed the volatility associated with adding future accrual for active members, and has also led to lower service costs and their cash funding since April 2011.
Shareholder information
2011 Number
274 Aviva plc Annual Report and Accounts 2011
Notes to the consolidated financial statements continued
47 – Pension obligations continued (ii) Defined contribution (money purchase) section of the ASPS
The trustees have responsibility for selecting a range of suitable funds in which the members can choose to invest and for monitoring the performance of the available investment funds. Members are responsible for reviewing the level of contributions they pay and the choice of investment fund to ensure these are appropriate to their attitude to risk and their retirement plans. Members of this section contribute at least 2% of their pensionable salaries and, depending on the percentage chosen, the Company contributes up to a maximum 14%, together with the cost of the death-in-service benefits. These contribution rates are unchanged for 2012. (d) Credit/charges to the income statement
The total pension costs/(credit) of all the Group’s defined benefit and defined contribution schemes were:
Continuing operations UK defined benefit schemes Overseas defined benefit schemes Total defined benefit schemes (note 10b) UK defined contribution schemes Overseas defined contribution schemes
2011 £m
2010 £m
36 22 58 75 20
(227) 8 (219) 53 17
95
70
Total charge/(credit) from continuing operations Total charge from discontinued operations
153 7
(149) 44
Total charge/(credit) for pension schemes
160
(105)
Total defined contribution schemes (note 10b)
The credit for the defined benefit schemes in 2010 arose from the £286 million gain on the closure of the UK scheme to future accrual, described in section (c) above. There were no significant contributions outstanding or prepaid as at either 31 December 2010 or 2011. (e) IAS 19 disclosures
Disclosures under IAS 19 for the material defined benefit schemes in the UK, Ireland and Canada, and the Netherlands prior to the deconsolidation of Delta Lloyd, are given below. Where schemes provide both defined benefit and defined contribution pensions, the assets and liabilities shown exclude those relating to defined contribution pensions. Total employer contributions for these schemes in 2012, including the ASPS deficit funding, are expected to be £250 million. (i) Assumptions on scheme liabilities The projected unit credit method
The inherent uncertainties affecting the measurement of scheme liabilities require these to be measured on an actuarial basis. This involves discounting the best estimate of future cash flows to be paid out by the scheme using the projected unit credit method. This is an accrued benefits valuation method which calculates the past service liability to members and makes allowance for their projected future earnings. It is based on a number of actuarial assumptions, which vary according to the economic conditions of the countries in which the relevant businesses are situated, and changes in these assumptions can materially affect the measurement of the pension obligations. Alternative measurement methods
There are alternative methods of measuring liabilities, for example by calculating an accumulated benefit obligation (the present value of benefits for service already rendered but with no allowance for future salary increases) or on a solvency basis, using the cost of securing the benefits at a particular date with an insurance company or one of the growing market of alternative buy-out providers. This could take the form of a buy-out, in which the entire liability will be settled in one payment with all obligations transferred to an insurance company or buy-out provider, or a buy-in, in which annuities or other insurance products are purchased to cover a part or all of the liability. A valuation of the liabilities in either of these cases will almost always result in a higher estimate of the pension deficit than under an ongoing approach, as they assume that the sponsor immediately transfers the majority, if not all, of the risk to another provider who would be seeking to make a profit on the transaction. However, there are only a limited number of organisations that would be able to offer these options for schemes of the size of those in our Group. The full buy-out cost would only be known if quotes were obtained from such organisations but, to illustrate the cost of a buy-out valuation, an estimate for the main UK scheme is that the year-end liabilities of £8.4 billion could be valued some £5.4 billion higher, at £13.8 billion. There is a small buy-out market in Ireland, largely restricted to pensions currently in payment and it is not clear whether current capacity would enable an immediate buy-out of our Irish pension liabilities at present. The Canadian defined benefit plan’s liabilities represent the likely limit on what the Canadian group annuity market could absorb at normal competitive group annuity prices if the entire plan were subject to a buy-out valuation. There is in fact a reasonably high chance that only a portion of the plan’s liabilities could be absorbed in one tranche. IAS 19 requires us to use the projected unit credit method to measure our pension scheme liabilities. Neither of the alternative methods is considered appropriate in presenting fairly the Group’s obligations to the members of its pension schemes on an ongoing basis, so they are not considered further.
275 Performance review
Aviva plc Annual Report and Accounts 2011
Notes to the consolidated financial statements continued
47 – Pension obligations continued The valuations used for accounting under IAS 19 have been based on the most recent full actuarial valuations, updated to take account of that standard’s requirements in order to assess the liabilities of the material schemes at 31 December 2011. Scheme assets are stated at their fair values at 31 December 2011. The main actuarial assumptions used to calculate scheme liabilities under IAS 19 are: UK 2011
3.1% 3.5% 4.9% 5.3% 3.1% 3.5% 3.1% 3.5% 4.9% 5.5% AA-rated corporate bonds
2010
2.0% 2.0% 3.5% 3.5% 2.0% 2.0% 2.0% 2.0% 5.7% 5.6% AA-rated corporate bonds
Canada 2011
Inflation rate General salary increases Pension increases Deferred pension increases Discount rate Basis of discount rate
Netherlands 2011
2010
2.5% 2.5% 3.75% 3.75% 1.25% 1.25% — — 4.5% 5.0% AA-rated corporate bonds
2010
n/a 1.9% n/a 2.9%* n/a 1.9%** n/a 1.9%** n/a 5.1% AA-rated corporate bonds
The discount rate and pension increase rate are the two assumptions that have the largest impact on the value of the liabilities, with the difference between them being known as the net discount rate. For each country, the discount rate is based on current average yields of high-quality debt instruments taking account of the maturities of the defined benefit obligations. A 1% increase in this rate (and therefore the net discount rate) would reduce the liabilities by £1.7 billion and the service cost for the year by £9 million. It would also reduce the interest cost on those liabilities by £1 million. Mortality assumptions
Life expectancy/(pension duration) at NRA of a male Normal retirement age (NRA)
UK – ASPS
60
SAPS series 1, including allowances for future improvement
65
Ireland
94% PNA00 with allowance for future improvements
Canada
UP1994, with Projection Scale AA applied on a generational basis
– RAC
20 years younger than NRA
Currently aged NRA
20 years younger than NRA
89.9 (29.9) 87.7 (22.7)
93.2 (33.2) 90.7 (25.7)
89.9 (29.9) 89.8 (24.8)
92.1 (32.1) 91.8 (26.8)
61
86.5 (25.5)
89.5 (28.5)
89.3 (28.3)
92.3 (31.3)
65
84.6 (19.6)
86.1 (21.1)
87.0 (22.0)
87.9 (22.9)
Other information
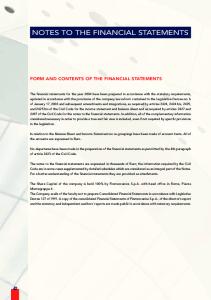
The assumptions above are based on commonly used mortality tables and, in the UK, have been changed to those used by both schemes’ trustees in the most recent full actuarial valuations. The new tables make allowance for observed variations in such factors as age, gender, pension amount, salary and postcode-based lifestyle group, and have been adjusted to reflect recent research into mortality experience. However, the extent of future improvements in longevity is subject to considerable uncertainty and judgement is required in setting this assumption. In the UK schemes, which are the most material to the Group, the assumptions include an allowance for future mortality improvement, based on the actuarial profession’s long and medium cohort projection tables (for the ASPS and RAC schemes respectively) and incorporating underpins to the rate of future improvement equal to 1.5% per annum for males and 1.0% per annum for females. The effect of assuming all members were one year younger would increase the liabilities in all the schemes by £265 million and the service cost for the year by £1 million. The discounted scheme liabilities have an average duration of 20 years in the main UK scheme, 22 years in the RAC scheme, 19 years in the Irish scheme and 13 years in the Canadian scheme. The undiscounted benefits payable from the main UK defined benefit scheme are expected to be as shown in the chart below:
Financial statements MCEV
Club Vita pooled experience, including an allowance for future improvements
Currently aged NRA
Life expectancy/(pension duration) at NRA of a female
Financial statements IFRS
Mortality assumptions are significant in measuring the Group’s obligations under its defined benefit schemes, particularly given the maturity of these obligations in the material schemes. The assumptions used are summarised in the table below and have been selected to reflect the characteristics and experience of the membership of these schemes. The mortality tables, average life expectancy and pension duration used at 31 December 2011 for scheme members are as follows:
Shareholder information
* Age-related scale increases plus 2.9%. ** 2.1% until 2011 and expected return less 3% thereafter.
Mortality table
Governance
Inflation rate General salary increases Pension increases Deferred pension increases Discount rate Basis of discount rate
Ireland 2011
2010
Corporate responsibility
Valuations and assumptions
276 Aviva plc Annual Report and Accounts 2011
Notes to the consolidated financial statements continued
47 – Pension obligations continued Undiscounted benefit payments £m Deferred member cash flows
Pensioner cash flows
700 600 500 400 300 200 100 0 2012
2042
2072
2102
(ii) Assumptions on scheme assets
The expected rates of return on the schemes’ assets are: UK
Equities Bonds Property Cash
Ireland
Canada
Netherlands
2012
2011
2012
2011
2012
2011
2012
2011
5.8% 3.4% 4.3% 0.7%
7.2% 4.4% 5.7% 0.6%
5.9% 3.2% 4.4% 0.9%
6.9% 2.7% 5.4% 2.7%
5.8% 3.2% n/a 0.8%
7.0% 3.2% n/a 1.0%
n/a n/a n/a n/a
6.2% 3.6% 2.9% n/a
The overall rates of return are based on the expected returns within each asset category and on current asset allocations. The expected returns for equities and properties are aligned with the rates used for the longer-term investment return assumptions, other than in the Netherlands, where the 2011 figures were developed in conjunction with external advisers due to the characteristics of the scheme. The figures for the total expected return on scheme assets in the following section are stated after deducting investment expenses and, in Ireland, the government levy on pension fund assets. (iii) Investments in Group-managed funds and insurance policies
Plan assets include investments in Group-managed funds in the consolidated statement of financial position of £112 million (2010: £116 million) and insurance policies with other Group companies of £163 million (2010: £160 million) in the main UK scheme. Prior to the deconsolidation of Delta Lloyd, the assets of the Dutch scheme mainly consisted of insurance policies with that company, totalling £1,445 million at 31 December 2010. The Dutch insurance policies were considered non-transferable under the terms of IAS 19 and so, in the 2010 comparatives, were treated as other obligations to staff pension schemes within provisions (see note 46). The treatment in the relevant parts of the financial statements is as follows: Plan assets – the treatment of these funds and policies in the consolidated statement of financial position is described above. Expected rates of return – where the relevant insurance policies are in segregated funds with specific asset allocations, their expected rates of return are included in the appropriate line in the table in section (ii) above. Pension expense – to avoid double-counting of investment income on scheme assets and the assets backing the underlying policies, adjustments have been made to the former in the discontinued operations part of the tables in section (iv) below.
277 Performance review
Aviva plc Annual Report and Accounts 2011
Notes to the consolidated financial statements continued
47 – Pension obligations continued As noted above, plan assets in the UK and Dutch schemes include insurance policies with other Group companies. To avoid doublecounting of investment income on scheme assets and the assets backing the underlying policies, adjustments have been made to the former as shown in the tables below. The total pension expense for these schemes comprises: Recognised in the income statement 2010 £m
Continuing operations Current service cost Past service cost Gains on curtailments
(51) — —
(126) (10) 347
Total pension (cost)/credit from continuing operations Total pension cost from discontinued operations
(51) (7)
211 (34) 177 457 (584)
(87) (26)
(127) (68)
Total charge to finance costs
(113)
(195)
Total (charge)/credit to income arising from continuing operations Total charge to income arising from discontinued operations
(138) (33)
84 (102)
Total charge to income
(171)
(18)
Expected return on scheme assets Interest charge on scheme liabilities Charge to finance costs from continuing operations Charge to finance costs from discontinued operations
The gains on curtailments in 2010 principally arose from closure of the UK schemes to future accrual, described in section (c) above. Recognised in the statement of comprehensive income 2011 £m
2010 £m
(452) 1,815
(457) 1,001
Actuarial gains on scheme assets Experience (losses)/gains arising on scheme liabilities Changes in assumptions underlying the present value of the scheme liabilities
1,363 (46) (321)
544 382 152
996 11
1,078 (79)
Actuarial gains from continuing operations Actuarial gains/(losses) from discontinued operations Total actuarial gains recognised in other comprehensive income
1,007
999
Attributable to equity shareholders of Aviva plc Attributable to non-controlling interests
1,002 5
1,033 (34)
1,007
999
Financial statements IFRS
Continuing operations Expected return on scheme assets Actual return on these assets
Shareholder information
(58) 452 (539)
Total pension (cost)/credit charged to net operating expenses
Governance
2011 £m
Corporate responsibility
(iv) Pension expense
Financial statements MCEV Other information
278 Aviva plc Annual Report and Accounts 2011
Notes to the consolidated financial statements continued
47 – Pension obligations continued The loss arising from changes in assumptions in 2011 primarily reflects the impact of lower discount rates for liabilities across all but the Irish schemes. The cumulative amount of actuarial gains and losses on the pension schemes recognised in other comprehensive income since 1 January 2004 (the date of transition to IFRS) is a loss of £224 million at 31 December 2011 (2010: cumulative loss of £1,231 million). (v) Experience gains and losses
The following disclosures of experience gains and losses give a five-year history. Scheme assets exclude insurance policies with Group companies and income on the assets underlying them. 2011 £m
Fair value of scheme assets at the end of the year Present value of scheme liabilities at the end of the year Net surplus/(deficits) in the schemes Difference between the expected and actual return on scheme assets Amount of gains/(losses) Percentage of the scheme assets at the end of the year Experience gains/(losses) on scheme liabilities (excluding changes in assumptions) Amount of gains/(losses) Percentage of the present value of scheme liabilities
2010 £m
2009 £m
2008 £m
2007 £m
11,791 9,971 8,754 7,936 8,814 (10,527) (11,419) (11,812) (9,951) (10,017) 1,264
(1,448) (3,058) (2,015) (1,203)
1,363 11.6%
547* 5.5%
561* (1,893)* 6.4% 23.8%
(138)* 1.6%
(46) 0.4%
450* 3.9%
77* 0.7%
(80)* 0.8%
105* 1.1%
* Including gains and losses from discontinued operations.
(vi) Risk management and asset allocation strategy
As noted above, the long-term investment objectives of the trustees and the employers are to limit the risk of the assets failing to meet the liabilities of the schemes over the long term, and to maximise returns consistent with an acceptable level of risk so as to control the long-term costs of these schemes. To meet these objectives, each scheme’s assets are invested in a diversified portfolio, consisting primarily of equity and debt securities. These reflect the current long-term asset allocation ranges chosen, having regard to the structure of liabilities within the schemes. Main UK scheme
Both the Group and the trustees regularly review the asset/liability management of the main UK scheme. It is fully understood that, while the current asset mix is designed to produce appropriate long-term returns, this introduces a material risk of volatility in the scheme’s surplus or deficit of assets compared with its liabilities. The principal asset risks to which the scheme is exposed are: Equity market risk – the effect of equity market falls on the value of plan assets. Inflation risk – the effect of inflation rising faster than expected on the value of the plan liabilities. Interest rate risk – falling interest rates leading to an increase in liabilities significantly exceeding the increase in the value of assets. There is also an exposure to currency risk where assets are not denominated in the same currency as the liabilities. The majority of this exposure has been removed by the use of hedging instruments. In 2011, there has been a further reduction in the proportion of assets invested in equities, thereby mitigating the equity risk above. In addition, the trustees have taken further measures to partially mitigate inflation and interest rate risks. Other schemes
The other schemes are considerably less material but their risks are managed in a similar way to those in the main UK scheme.
279 Performance review
Aviva plc Annual Report and Accounts 2011
Notes to the consolidated financial statements continued
47 – Pension obligations continued The assets and liabilities of the schemes, attributable to defined benefit members, including investments in Group insurance policies (see footnote below), at 31 December 2011 were: Ireland
Canada
Total
£m
£m
£m
2011 £m
735 8,663 657 1,135
46 233 13 90
76 129 — 14
857 9,025 670 1,239
11,190 (9,606)
382 (539)
219 (382)
11,791 (10,527)
Net surplus/(deficits) in the schemes
1,584
(157)
(163)
1,264
Surplus included in other assets (note 27) Deficits included in provisions (note 46)
1,670 (86)
— (157)
— (163)
1,670 (406)
1,584
(157)
(163)
1,264
Equities Bonds Property Other Total fair value of assets Present value of scheme liabilities
UK
Ireland
Canada
Netherlands
Total
£m
£m
£m
Equities Bonds Property Other
2,435 5,533 558 835
50 202 17 118
54 150 — 12
244 1,061 81 66
2,783 6,946 656 1,031
Total fair value of assets Present value of scheme liabilities
9,361 (9,044)
387 (551)
216 (362)
1,452 (1,462)
11,416 (11,419)
Net surplus/(deficits) in the schemes
317
(164)
(146)
(10)
(3)
Surplus included in other assets (note 27) Deficits included in provisions (note 46)
524 (207)
— (164)
— (146)
— (10)
524 (527)
317
(164)
(146)
(10)
(3)
Ireland
Canada
Netherlands
Total
£m
£m
£m
Equities Bonds Property Other
2,435 5,533 558 835
50 202 17 118
54 150 — 12
— — — 7
2,539 5,885 575 972
Total fair value of assets Present value of scheme liabilities
9,361 (9,044)
387 (551)
216 (362)
7 (1,462)
9,971 (11,419)
Net surplus/(deficits) in the schemes
317
(164)
(146)
(1,455)
(1,448)
Surplus included in other assets (note 27) Deficits included in provisions (note 46)
524 (207)
— (164)
— (146)
— (1,455)
524 (1,972)
317
(164)
(146)
(1,455)
(1,448)
The present value of unfunded post-retirement benefit obligations included in the totals in both sets of tables above is £116 million (2010: £130 million).
Other information
£m
2010 £m
Financial statements MCEV
UK
Financial statements IFRS
Other assets comprise cash at bank, derivative financial instruments, receivables and payables. Plan assets in the table above include investments in Group-managed funds and insurance policies, as described in section (iii) above. Where the investment and insurance policies are in segregated funds with specific asset allocations, they are included in the appropriate line in the table above, otherwise they appear in ‘Other’. Prior to the deconsolidation of Delta Lloyd, the Dutch insurance policies (£1,445 million at 31 December 2010) were considered non-transferable under the terms of IAS 19 and so were treated as other obligations to staff pension schemes within the 2010 comparatives for provisions (see note 46). The total IAS 19 obligations and strict IAS 19 assets (i.e. excluding the non-transferable insurance policies) of the schemes at 31 December 2010 gave a net deficit of £1,448 million, as shown in the following table.
Shareholder information
£m
2010 £m
Governance
UK
Corporate responsibility
(vii) Recognition in the statement of financial position
280 Aviva plc Annual Report and Accounts 2011
Notes to the consolidated financial statements continued
47 – Pension obligations continued (viii) Movements in the scheme deficits and surpluses
Movements in the pension schemes’ surpluses and deficits comprise: 2011
Scheme assets £m
Pension scheme net Scheme surplus/ liabilities (deficit) £m £m
Net deficits in the schemes at 1 January Employer contributions Employee contributions Benefits paid Current and past service cost (see (iv) above) Credit/(charge) to finance costs (see (iv) above) Actuarial gains/(losses) (see (iv) above) Disposals Deconsolidation of Delta Lloyd Exchange rate movements on foreign plans
11,416 (11,419) 452 — 12 (12) (356) 356 — (58) 465 (565) 1,347 (356) (23) 30 (1,589) 1,558 67 (61)
Net surplus in the schemes at 31 December
11,791 (10,527)
(3) 452 — — (58) (100) 991 7 (31) 6 1,264
Adjust for IAS 19 Group pensions insurance net surplus/ policies (deficit) £m £m
(1,445) (66) (9) 15 — (13) 16 — 1,582 (80) —
(1,448) 386 (9) 15 (58) (113) 1,007 7 1,551 (74) 1,264 2010
Scheme assets £m
Scheme liabilities £m
Pension scheme net deficit £m
Adjust for Group IAS 19 insurance pensions net policies deficit £m £m
Deficits in the schemes at 1 January Employer contributions Employee contributions Benefits paid Current and past service cost (see (iv) above) Gains/(losses) on curtailments (see (iv) above) Credit/(charge) to finance costs (see (iv) above) Actuarial gains/(losses) (see (iv) above) Transfers Exchange rate movements on foreign plans
10,105 (11,812) 579 — 15 (15) (385) 385 — (170) (1) 348 522 (652) 623 456 1 2 (43) 39
(1,707) 579 — — (170) 347 (130) 1,079 3 (4)
(1,351) (34) (9) 47 — — (65) (80) (1) 48
(3,058) 545 (9) 47 (170) 347 (195) 999 2 44
Deficits in the schemes at 31 December
11,416 (11,419)
(3)
(1,445)
(1,448)
The fall in the pension schemes’ net deficits during 2011 is mainly attributable to increases in investment values and additional employer contributions, partly offset by changes in actuarial assumptions.