SAP Integrated Report 2013 Notes to the Consolidated Financial Statements 1 1 2 23 25 26 26 28 29 30 33 34 35 36 37 41 42 45 55 55 57 59 60 64 68 74 81 90 95 100 101 101 101 102
(1) (2) (3) (4) (5) (6) (7) (8) (9) (10) (11) (12) (13) (14) (15) (16) (17) (18) (19) (20) (21) (22) (23) (24) (25) (26) (27) (28) (29) (30) (31) (32) (33) (34)
General Information About Consolidated Financial Statements Scope of Consolidation Summary of Significant Accounting Policies Business Combinations Revenue Other Operating Income/Expense, Net Employee Benefits Expense and Headcount Other Non-Operating Income/Expense, Net Financial Income, Net Income Tax Earnings per Share Other Financial Assets Trade and Other Receivables Other Non-Financial Assets Goodwill and Intangible Assets Property, Plant, and Equipment Trade and Other Payables, Financial Liabilities, and Other Non-Financial Liabilities Provisions Deferred Income Total Equity Additional Capital Disclosures Other Financial Commitments and Contingent Liabilities Litigation and Claims Financial Risk Factors Financial Risk Management Additional Fair Value Disclosures on Financial Instruments Share-Based Payments Segment and Geographic Information Board of Directors Related Party Transactions Principal Accountant Fees and Services German Code of Corporate Governance Subsequent Events Subsidiaries, Associates, and Other Equity Investments
www.sapintegratedreport.com
Notes to the Consolidated Financial Statements Assured (1) General Information about Consolidated Financial Statements The accompanying Consolidated Financial Statements of SAP AG and its subsidiaries (collectively, “we,” “us,” “our,” “SAP,” “Group,” and “Company”) have been prepared in accordance with International Financial Reporting Standards (IFRS). The designation “IFRS” includes all standards issued by the International Accounting Standards Board (IASB) and related interpretations issued by the IFRS Interpretations Committee (IFRIC). We have applied all standards and interpretations that were effective on and endorsed by the European Union (EU) as at December 31, 2013. There were no standards or interpretations impacting our Consolidated Financial Statements for the years ended December 31, 2013, 2012, and 2011, that were effective but not yet endorsed. Therefore our Consolidated Financial Statements comply with both IFRS as issued by the IASB and with IFRS as endorsed by the EU. Our Executive Board approved the Consolidated Financial Statements on February 20, 2014, for submission to our Supervisory Board. All amounts included in the Consolidated Financial Statements are reported in millions of euros (€ millions) except where otherwise stated. Due to rounding, numbers presented throughout this document may not add up precisely to the totals we provide and percentages may not precisely reflect the absolute figures.
Notes to the Consolidated Financial Statements
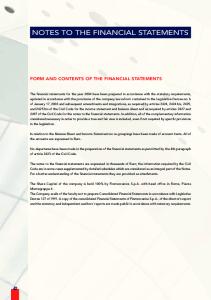
(2) Scope of Consolidation The Consolidated Financial Statements include SAP AG and all subsidiaries of SAP AG. The following table summarizes the changes in the number of entities included in the Consolidated Financial Statements.
Entities Consolidated in the Financial Statements
December 31, 2011
German
Foreign
Total 199
23
176
Additions
4
92
96
Disposals
−5
−23
−28
December 31, 2012
267
22
245
Additions
1
24
25
Disposals
−1
−19
−20
December 31, 2013
22
250
272
The additions relate to legal entities added in connection with acquisitions and foundations. The disposals are due to sales, mergers and liquidations of legal entities. In August 2013, we acquired hybris AG, which may affect comparability of our 2013 Consolidated Financial Statements with our 2012 and 2011 Consolidated Financial Statements. For more information about our business combinations and the effect on our Consolidated Financial Statements, see Note (4).
1
Assured (3) Summary of Significant Accounting Policies (3a) Bases of Measurement The Consolidated Financial Statements have been prepared on the historical cost basis except for the following: –D � erivative financial instruments, available-for-sale financial assets, and liabilities for cash-settled share-based payments are measured at fair value. –M � onetary assets and liabilities denominated in foreign currencies are translated at period-end exchange rates. –P � ost-employment benefits are measured according to IAS 19 (Employee Benefits) as described in Note (18a). Where applicable, information about the methods and assumptions used in determining the respective measurement bases is disclosed in the Notes specific to that asset or liability. (3b) Relevant Accounting Policies Business Combinations and Goodwill Business combinations are accounted for using the acquisition method as at the closing date, which is the date on which we obtain control of the acquiree. The consideration transferred in an acquisition is measured at the fair value of the assets transferred and liabilities incurred at the date of transfer of control. Settlements of pre-existing relationships are not included in the consideration transferred. Such amounts are recognized in profit and loss. Identifiable assets acquired and liabilities assumed in a business combination (including contingent consideration) are measured at their acquisition date fair values. Changes in contingent consideration classified as a liability at the acquisition date are recognized in profit and loss unless they related to facts that existed at the measurement date that we become aware of during the measurement period. We decide on a transaction-by-transaction basis whether to measure the non-controlling interest in the acquiree either at fair value or at the proportionate share of the acquiree’s identifiable net assets. Acquisition-related costs are accounted
2
as expense in the periods in which the costs are incurred and the services are received, with the expense being classified as general and administration expense. The excess of the consideration transferred in a business combination over the fair value of the identifiable net assets acquired is recorded as goodwill. With respect to at-equity investments, the carrying amount of goodwill is included in the carrying amount of the investment. Foreign Currencies Assets and liabilities of our foreign subsidiaries that use a functional currency other than the euro are translated at the closing rate at the date of the Statement of Financial Position. Income and expenses are translated at average rates of exchange computed on a monthly basis. All resulting exchange differences are recognized in other comprehensive income. Exchange differences from monetary items denominated in foreign currency transactions that are part of a long-term investment (that is, settlement is neither planned nor likely to occur in the foreseeable future) are also included in other comprehensive income. When a foreign operation is disposed of, liquidated, or abandoned, the foreign currency translation adjustments applicable to that entity are reclassified from other comprehensive income to profit or loss.
Notes to the Consolidated Financial Statements
Assured On initial recognition, foreign currency transactions are recorded in the respective functional currencies of Group entities by applying to the foreign currency amount the exchange rate at the date of the transaction. Monetary assets and liabilities that are denominated in foreign currencies are remeasured at the period-end closing rate. Resulting exchange differences are recognized, in the period in which they arise, in other non-operating expense. Operating cash flows of foreign subsidiaries are translated into euros using average rates of exchange computed on a monthly basis. Investing and financing cash flows of foreign subsidiaries
are translated into euros using the exchange rates in effect at the time of the respective transaction. The effect of exchange rate changes on cash is reported in a separate line item in the Consolidated Statements of Cash Flows. Any goodwill arising from the acquisition of a foreign operation and any fair value adjustments to the carrying amounts of assets and liabilities arising from the acquisition are treated as assets and liabilities of the foreign operation and translated at the respective closing rates. The exchange rates of key currencies affecting the Company were as follows:
Exchange Rates Equivalent to €1 Closing Rate as at December 31, 2013
2012
Annual Average Exchange Rate 2013
2012
2011
U.S. dollar
USD
1.3791
1.3194
1.3301
1.2862
1.3863
Pound sterling
GBP
0.8337
0.8161
0.8482
0.8104
0.8656
Japanese yen
JPY
144.72
113.61
130.21
103.05
110.17
Swiss franc
CHF
1.2276
1.2072
1.2302
1.2055
1.2299
Canadian dollar
CAD
1.4671
1.3137
1.3710
1.2843
1.3739
Australian dollar
AUD
1.5423
1.2712
1.3944
1.2419
1.3436
Revenue Recognition We derive our revenue from fees charged to our customers for (a) licenses to our on-premise software products, (b) the use of our hosted cloud subscription software offerings and (c) support, consulting, development, training, and other services. The majority of our software arrangements include support services, and many also include professional services and other elements.
Notes to the Consolidated Financial Statements
Software and software-related service revenue, as shown in our Consolidated Income Statements, is the sum of our software revenue, our support revenue and our cloud subscriptions and support revenue. Professional services and other service revenue as shown in our Consolidated Income Statements is the sum of our consulting revenue and other service revenue. Other service revenue as shown in our Consolidated Income Statements mainly consists of revenue from training services, messaging services, and SAP marketing events. Revenue information by segment and geographic region is disclosed in Note (28).
3
Assured If, for any of our product or service offerings, we determine at the outset of an arrangement that the amount of revenue cannot be measured reliably, we conclude that the inflow of economic benefits associated with the transaction is not probable, and we defer revenue recognition until the arrangement fee becomes due and payable by the customer. If, at the outset of an arrangement, we determine that collectability is not probable, we conclude that the inflow of economic benefits associated with the transaction is not probable, and we defer revenue recognition until the earlier of when collectability becomes probable or payment is received. If collectability becomes not probable before all revenue from an arrangement is recognized, we recognize revenue only to the extent of the fees that are successfully collected unless collectability becomes probable again. If a customer is specifically identified as a bad debtor, we stop recognizing revenue from the customer except to the extent of the fees that have already been collected.
We usually sell or license on-premise software on a perpetual basis. Occasionally, we license on-premise software for a specified period of time. Revenue from short-term time-based licenses, which usually include support services during the license period, is recognized ratably over the license term. Revenue from multi-year time-based licenses that include support services, whether separately priced or not, is recognized ratably over the license term unless a substantive support service renewal rate exists; if this is the case, the amount allocated to the delivered software is recognized as software revenue based on the residual method once the basic criteria described above have been met.
We account for out-of-pocket expenses invoiced by SAP and reimbursed by customers as support, cloud subscription and support, consulting, or other service revenue, depending on the nature of the service for which the out-of-pocket expenses were incurred.
We usually recognize revenue from on-premise software arrangements involving resellers on evidence of sell-through by the reseller to the end-customer, because the inflow of the economic benefits associated with the arrangements to us is not probable before sell-through has occurred.
Software revenue represents fees earned from the sale or license of software to customers for use on the customer’s premises, in other words, where the customer has the right to take possession of the software for installation on the customer’s premises (on-premise software). Revenue from the sale of perpetual licenses of our standard software products is recognized in line with the requirements for selling goods stated in IAS 18 (Revenue) when evidence of an arrangement exists, delivery has occurred, the risks and rewards of ownership have been transferred to the customer, the amount of revenue and associated costs can be measured reliably, and collection of the related receivable is probable. The fee of the sale is recognized net of returns and allowances, trade discounts, and volume rebates.
Sometimes we enter into customer-specific on-premise software development agreements. We recognize software revenue in connection with these arrangements using the percentage-ofcompletion method based on contract costs incurred to date as a percentage of total estimated contract costs required to complete the development work. If we do not have a sufficient basis to reasonably measure the progress of completion or to estimate the total contract revenue and costs, revenue is recognized only to the extent of the contract costs incurred for which we believe recoverability to be probable. When it becomes probable that total contract costs exceed total contract revenue in an arrangement, the expected losses are recognized immediately as an expense based on the costs attributable to the contract.
4
In general, our software license agreements do not include acceptance-testing provisions. If an arrangement allows for customer acceptance-testing of the software, we defer revenue until the earlier of customer acceptance or when the acceptance right lapses.
Notes to the Consolidated Financial Statements
Assured On-premise software subscription contracts combine software and support service elements, as under these contracts the customer is provided with current software products, rights to receive unspecified future software products, and rights to product support during the on-premise software subscription term. Customers pay a periodic fee for a defined subscription term, and we recognize such fees ratably over the term of the arrangement beginning with the delivery of the first product. Revenue from on-premise software subscription contracts is allocated to the software revenue and support revenue line items in our Consolidated Income Statements. On-premise software rental contracts also combine software and support service elements. Under such contracts the customer is provided with current software products and product support, but not with the right to receive unspecified future software products. Customers pay a periodic fee over the rental term. We recognize fees from software rental contracts ratably over the term of the arrangement. Revenue from rental contracts is allocated to the software revenue and support revenue line items in our Consolidated Income Statements. Support revenue represents fees earned from providing customers with unspecified future software updates, upgrades, and enhancements, and technical product support services for on-premise software products. We recognize support revenue based on our performance under the support arrangements. Under our major support services our performance obligation is to stand ready to provide technical product support and to provide unspecified updates and enhancements on a whenand-if-available basis. For these support services we recognize revenue ratably over the term of the support arrangement. We do not sell separately technical product support or unspecified software upgrades, updates, and enhancements. Accordingly, we do not distinguish within software and software-related service revenue or within cost of software and software-related services the amounts attributable to technical support services and unspecified software upgrades, updates, and enhancements.
Notes to the Consolidated Financial Statements
Revenue from cloud subscriptions and support represents fees earned from providing customers with: – �The right to use software in a cloud-based-infrastructure (hosting) provided by SAP, where the customer does not have the right to terminate the hosting contract and take possession of the software to run it on the customer’s own IT infrastructure or by a third party hosting provider without significant penalty, or – �Additional premium support beyond the standard support which is included in SAP’s basic cloud subscription fees, or – �Hosting services and related application management services for software hosted by SAP, where the customer has the right to terminate the hosting contract and take possession of the software without significant penalty. Cloud subscription and support revenue is recognized as the services are performed. Where a fixed fee is agreed for the right to continuously access and use a cloud offering for a certain term, the fee is recognized ratably over the term covered by the fixed fee. Fees that are based on actual transaction volumes are recognized as the transactions occur. Revenue from consulting primarily represents fees earned from providing customers with consulting services which primarily relate to the installation and configuration of our software products and cloud offerings. Usually, our consulting contracts do not involve significant production, modification, or customization of software and the related revenue is recognized as the services are provided using the percentageof-completion method of accounting as outlined above.
5
Assured Revenue from other services represents fees earned from providing customers with training services, application management services for software not hosted by SAP, messaging services, SAP marketing events, and referral services. – �Training services provide educational services to customers and partners regarding the use of our software products. We recognize training revenue and application management services as the services are rendered. –M � essaging services primarily comprise the transmission of electronic text messages from one mobile phone provider to another. We recognize revenue from message services based upon the number of messages successfully processed and delivered. Revenue from fixed-price messaging arrangements is recognized ratably over the contractual term of the arrangement. –R � evenue from marketing events hosted by SAP, for which SAP sells tickets to its customers, is recognized when the marketing event is completed. –R � eferral services comprise referring customers to partners. We recognize revenue from referral services upon providing the referral. The majority of our arrangements contain multiple elements. We account for software, support, cloud subscription, consulting and other service deliverables as separate units of account and allocate revenue based on fair value. Fair value is determined by establishing either company-specific objective evidence, or an estimated stand-alone selling price. The revenue amounts allocated to the individual elements are recognized when the revenue recognition criteria described above have been met for the respective element. We generally determine the fair value of each element based on its company-specific objective evidence of fair value, which is the price charged when that element is sold separately or, for elements not yet sold separately, the price established by our management if it is probable that the price will not change before the element is sold separately.
6
We derive the company-specific objective evidence of fair value for our support services from the rates charged to renew the support services annually after an initial period. Such renewal rates generally represent a fixed percentage of the discounted software license fee charged to the customer. The majority of our customers renew their annual support service contracts at these rates. Where company-specific objective evidence of fair value or third-party evidence of selling price cannot be established for deliverables, we determine the fair value of the respective element by estimating its stand-alone selling price. This is generally the case for our cloud subscription offerings. Estimated stand-alone selling price (ESP) for our cloud subscription offerings is determined based on the rates agreed with the individual customers to apply if and when the subscription arrangement renews. We determine ESP by considering multiple factors which include, but are not limited to, the following: i) substantive renewal rates contained within an arrangement for cloud subscription deliverables; ii) gross margin objectives and internal costs for services; and iii) pricing practices, market conditions, and competitive landscape. We apply the residual method of revenue recognition when company-specific objective evidence of fair value or estimated stand-alone selling price exists for all of the undelivered elements in the arrangement, but does not exist for one or more delivered elements. This is generally the case in multiple element arrangements involving on-premise software and services related to on-premise software where companyspecific objective evidence of fair value or estimated standalone selling price exists for all the services in the arrangement (for example, support services, consulting services, cloud subscription services), but does not exist for the on-premise software. Under the residual method, revenue is allocated to all undelivered elements in the amount of their respective fair values and the remaining amount of the arrangement fee is allocated to the delivered element. With this policy we have considered the guidance provided by FASB ASC Subtopic 985605, Software Revenue Recognition (FASB ASC 985-605), where applicable, as authorized by IAS 8 Accounting Policies, Changes in Accounting Estimates and Errors (IAS 8).
Notes to the Consolidated Financial Statements
Assured In multiple element arrangements where company-specific objective evidence of fair value or an estimated stand-alone selling price exists for all elements, revenue is allocated to the elements based on their relative fair values (relative fair value method). Our consideration of whether on-premise software, cloud subscriptions, consulting or other services are to be accounted for separately or as one combined element of the arrangement depends on: – �Whether the arrangement involves significant production, modification, or customization of the software or cloud subscription, and – �Whether the services are not available from third-party vendors and are therefore deemed essential to the software. If neither of the above is the case, revenue for the on-premise software or cloud subscription element, and the other elements, are recognized separately. In contrast, if one or both of the above applies, the respective elements of the arrangement are combined and accounted for as a single unit of account, and the portion of the arrangement fee allocated to this single unit of account is recognized using the percentageof-completion method, as outlined above, or over the cloud subscription term, if applicable, depending on which service term is longer.
Cost of Software and Software-Related Services Cost of software and software-related services includes the cost incurred in producing the goods and providing the services that generate software and software-related service revenue. Consequently, this line item includes primarily employee expenses relating to these services, amortization of acquired intangibles, fees for third-party licenses, shipping and ramp-up cost. Cost of Professional Services and Other Services Cost of professional services and other services includes the cost incurred in providing the services that generate professional service and other service revenue including messaging revenues. The item also includes sales and marketing expenses related to our professional services and other services that result from sales and marketing efforts that cannot be clearly separated from providing the services.
We consider FASB ASC 985-605 in our accounting for options that entitle the customer to purchase, in the future, additional on-premise software. We allocate revenue to future incremental discounts whenever customers are granted the right to license additional on-premise software at a higher discount than the one given within the initial software license arrangement, or to purchase or renew services at rates below the fair values established for these services. Our contributions to resellers that allow our resellers to execute qualified and approved marketing activities are recognized as an offset to revenue, unless we obtain a separate identifiable benefit for the contribution, and the fair value of the benefit is reasonably estimable.
Notes to the Consolidated Financial Statements
7
Assured Research and Development Research and development includes the costs incurred by activities related to the development of software solutions (new products, updates, and enhancements) including resource and hardware costs for the development systems. Development activities involve the application of research findings or other knowledge to a plan or design of new or substantially improved software products before the start of commercial use. Development expenditures are capitalized only if all of the following criteria are met: – �The development cost can be measured reliably. – �The product is technically and commercially feasible. –F � uture economic benefits are probable. – �We intend to complete development and market the product. We have determined that the conditions for recognizing internally generated intangible assets from our software development activities are not met until shortly before the products are available for sale. Development costs incurred after the recognition criteria are met have not been material. Consequently, all research and development costs are expensed as incurred. Sales and Marketing Sales and marketing includes costs incurred for the selling and marketing activities related to our software solutions, softwarerelated service portfolio, and cloud business. General and Administration General and administration includes costs related to finance and administrative functions, human resources, and general management as long as they are not directly attributable to one of the other operating expense line items.
8
Leases We are a lessee of property, plant, and equipment, mainly buildings, hardware, and vehicles, under operating leases that do not transfer to us the substantive risks and rewards of ownership. Rent expense on operating leases is recognized on a straight-line basis over the life of the lease including renewal terms if, at inception of the lease, renewal is reasonably assured. Some of our operating leases contain lessee incentives, such as up-front payments of costs or free or reduced periods of rent. The incentives are amortized over the life of the lease and the rent expense is recognized on a straight-line basis over the life of the lease. The same applies to contractually-agreed future increases of rents. Income Tax Deferred taxes are accounted for under the liability method. We recognize deferred tax assets and liabilities for the future tax consequences attributable to differences between the carrying amounts of existing assets and liabilities in the Consolidated Statements of Financial Position and their respective tax bases and on the carryforwards of unused tax losses and unused tax credits. Deferred tax assets are recognized to the extent that it is probable that taxable profit will be available against which the deductible temporary differences, unused tax losses, and unused tax credits can be utilized. Deferred tax assets and liabilities are measured at the tax rates that are expected to apply to the period when the asset is realized or the liability is settled, based on tax rates and tax laws that have been enacted or substantively enacted by the end of the reporting period. The effect on deferred tax assets and liabilities of a change in tax rates is recognized in profit or loss, unless related to items recognized in other comprehensive income or directly in equity, in the period of (substantive) enactment.
Notes to the Consolidated Financial Statements
Assured The carrying amount of a deferred tax asset is reviewed at the end of each reporting period and is reduced to the extent that it is no longer probable that sufficient taxable profit will be available to allow the benefit of part or all of the deferred tax assets to be utilized. We have aligned the presentation of prior period comparative amounts for tax assets and tax liabilities with the current period presentation by offsetting certain current tax assets against certain current tax liabilities and certain deferred tax assets against certain deferred tax liabilities which were not offset previously. The impact of this offsetting on the comparative amounts was to decrease both, current tax assets and current tax liabilities as of December 31, 2012, by €70 million and to decrease both, deferred tax assets and deferred tax liabilities as of December 31, 2012, by €353 million. Management concluded that these adjustments were immaterial to the consolidated financial statements. Share-Based Payments Share-based payments cover cash-settled and equity-settled awards issued to our employees. The fair values of both equitysettled and cash-settled awards are initially measured at grant date using an option-pricing model. The fair value of equity-settled awards is not subsequently remeasured. The grant date fair value of equity-settled awards is recognized as personnel expense in profit or loss over the period in which the employees become unconditionally entitled to the rights, with a corresponding increase in share premium. The amount recognized as an expense is adjusted to reflect the actual number of equity-settled awards that ultimately vest. We grant our employees discounts on certain share-based payments. Since those discounts are not dependent on future services to be provided by our employees, the discount is recognized as an expense when the rights are granted.
Notes to the Consolidated Financial Statements
For the share-based payments that are settled by paying cash rather than by issuing equity instruments, a provision is recorded for the rights granted reflecting the vested portion of the fair value of the rights at the end of each reporting period. Personnel expense is recognized over the period the beneficiaries are expected to perform the related service (vesting period), with a corresponding increase in provisions. Cashsettled awards are remeasured to fair value at the end of each reporting date until the award is settled. Any changes in the fair value of the provision are recognized as personnel expense in profit or loss. The amount of unrecognized compensation expense is dependent on the future price of our ordinary shares which we cannot reasonably predict. Where we hedge our exposure to cash-settled awards, changes in the fair value of the respective hedging instruments are also recognized as personnel expense in profit or loss. The fair values for hedged programs are based on market data reflecting current market expectations. For more information about our share-based payments, see Note (27). Other Components of Equity Other components of equity include: – �Exchange differences arising from the translation of the financial statements of our foreign operations as well as the exchange differences from intercompany long-term monetary items for which settlement is neither planned nor likely to occur in the foreseeable future – �Unrealized gains and losses on available-for-sale financial assets – �Gains and losses on cash flow hedges comprising the net change in fair value of the effective portion of the respective cash flow hedges that have not yet impacted profit or loss
9
Assured Treasury Shares Treasury shares are recorded at acquisition cost and are presented as a deduction from total equity. Gains and losses on the subsequent reissuance of treasury shares are credited or charged to share premium on an after-tax basis. On cancellation of treasury shares, any excess of their carrying amount over the calculated par value is charged to retained earnings. Earnings per Share We present basic and diluted earnings per share (EPS). Basic earnings per share is determined by dividing profit after tax attributable to equity holders of SAP AG by the weighted average number of ordinary shares outstanding during the respective year. Diluted earnings per share reflect the potential dilution assuming the conversion of all dilutive potential ordinary shares. Financial Assets Our financial assets comprise cash and cash equivalents (highly liquid investments with original maturities of three months or less), loans and receivables, acquired equity and debt investments, and derivative financial instruments (derivatives) with positive fair values. These assets are recognized and measured in accordance with IAS 39 (Financial Instruments: Recognition and Measurement). Accordingly, financial assets are recognized in the Consolidated Statements of Financial Position if we have a contractual right to receive cash or other financial assets from another entity. Regular way purchases or sales of financial assets are recorded at the trade date. Financial assets are initially recognized at fair value plus, in the case of financial assets not at fair value through profit or loss, directly attributable transaction costs. Interest-free or below-marketrate loans and receivables are initially measured at the present
10
value of the expected future cash flows. The subsequent measurement depends on the classification of our financial assets to the following categories according to IAS 39: – �Loans and receivables: Loans and receivables are nonderivative financial assets with fixed or determinable payments that are neither quoted in an active market nor intended to be sold in the near term. This category comprises trade receivables, receivables and loans included in other financial assets, and cash and cash equivalents. We carry loans and receivables at amortized cost less impairment losses. For further information on trade receivables, see the Trade and Other Receivables section. – �Available-for-sale financial assets: Available-for-sale financial assets are non-derivative financial assets that are not assigned to either of the two other categories and mainly include equity investments and debt investments. Available-for-sale financial assets are measured at fair value, with changes in fair value being reported net of tax in other comprehensive income. Fair value changes are not recognized in profit or loss until the assets are sold or impaired. – �Financial assets at fair value through profit or loss: Financial assets at fair value through profit or loss comprise only those financial assets that are held for trading, as we do not designate financial assets at fair value through profit or loss on initial recognition. This category solely contains embedded and freestanding derivatives with positive fair values. Except where hedge accounting is applied, all changes in the fair value of financial assets in this category are immediately recognized in profit or loss. For more information about derivatives, see the Derivatives section. All financial assets not accounted for at fair value through profit or loss are assessed for impairment at each reporting date or if we become aware of objective evidence of impairment as a result of one or more events that indicate that the carrying amount of the asset may not be recoverable. Objective evidence includes but is not limited to a significant or prolonged decline of the fair value below its carrying amount, a high probability of insolvency, or a material breach of contract by the issuer such as a significant delay or a shortfall
Notes to the Consolidated Financial Statements
Assured in payments due. Impairment losses in the amount of the difference between an asset’s carrying amount and the present value of the expected future cash flows or current fair value, respectively, are recognized in financial income, net. For available-for-sale financial assets such impairment losses directly reduce an asset’s carrying amount, while impairments on loans and receivables are recorded using allowance accounts. Account balances are charged off against the respective allowance after all collection efforts have been exhausted and the likelihood of recovery is considered remote. Impairment losses are reversed if the reason for the original impairment loss no longer exists. No such reversals are made for availablefor-sale equity investments. Income/expenses and gains/losses on financial assets consist of impairment losses and reversals, interest income and expenses, dividends, and gains and losses from the disposal of such assets. Dividend income is recognized when earned. Interest income is recognized based on the effective interest method. Neither dividend nor interest income is included in net gains/losses at the time of disposal of an asset. Financial assets are derecognized when contractual rights to receive cash flows from the financial assets expire or the financial assets are transferred together with all material risks and benefits.
Derivatives We account for derivatives and hedging activities in accordance with IAS 39 at fair value. Derivatives Without Designated Hedge Relationship Many transactions constitute economic hedges, and therefore contribute effectively to the securing of financial risks but do not qualify for hedge accounting under IAS 39. For the hedging of currency risks inherent in foreign currency denominated and recognized monetary assets and liabilities, we do not designate our held-for-trading derivative financial instruments as accounting hedges, as the profits and losses from the underlying transactions are recognized in profit or loss in the same periods as the profits or losses from the derivatives. Embedded Derivatives We occasionally have contracts that require payment streams in currencies other than the functional currency of either party to the contract. Such embedded foreign currency derivatives are separated from the host contract and accounted for separately if the following are met: – �The economic characteristics and risks of the host contract and the embedded derivative are not closely related. – �A separate instrument with the same terms as the embedded derivative would meet the definition of a derivative. – �The combined instrument is not measured at fair value through profit or loss. Derivatives with Designated Hedge Relationship We designate derivatives in respect of foreign currency risk or interest rate risk as cash flow or fair value hedges in a hedging relationship that qualifies for hedge accounting under IAS 39 and carry them at their fair value. At inception, we designate and document the hedge relationship, including the nature of the risk, the identification of the hedged item, the hedging instrument, and how we will assess the hedge effectiveness. Furthermore, at inception and on an ongoing basis we measure and document whether the derivatives are highly effective in
Notes to the Consolidated Financial Statements
11
Assured offsetting the changes in the fair values or cash flows of the hedged item attributable to the hedged risk. The accounting for changes in fair value of the hedging instrument depends on the type of the hedge and the effectiveness of the hedging relationship. For more information about our hedges, see Note (25). a) Cash Flow Hedge In general, we apply cash flow hedge accounting to the foreign currency risk of highly probable forecasted transactions and interest rate risk on variable rate financial liabilities. The effective portion of changes in the fair value of the derivative instrument determined to be an effective hedge is recognized in other comprehensive income and presented within other components of equity from cash flow hedges. With regard to foreign currency risk, this relates to the spot price and the intrinsic values of the derivatives designated and qualifying as cash flow hedges, while gains and losses on the interest element and on those time values excluded from the hedging relationship as well as the ineffective portion of gains or losses are recognized in profit or loss. We subsequently reclassify the effective portion of gains or losses from other comprehensive income to profit or loss when the hedged transaction affects profit or loss. If the hedge no longer meets the criteria for hedge accounting, any cumulative gain or loss recognized in other comprehensive income at that time remains in other comprehensive income until the forecasted transaction is ultimately recognized in profit or loss. When a forecasted transaction is no longer expected to occur, the cumulative gain or loss existing in other comprehensive income at that time is immediately transferred to profit or loss.
b) Fair Value Hedge We apply fair value hedge accounting for hedging certain of our fixed rate financial liabilities. Changes in the fair value of derivatives that are designated and qualify as fair value hedges are recorded in profit or loss, together with any changes in the fair value of the hedged asset or liability that are attributable to the hedged risk (basis adjustment). The change in the fair value of the derivatives and the change in the hedged item attributable to the hedged risk are recognized in profit or loss in the line item relating to the hedged item. If the hedge no longer meets the criteria for hedge accounting, the basis adjustment to the carrying amount of a hedged item for which the effective interest method is used is amortized over the period to maturity. Valuation and Testing of Effectiveness The effectiveness of the hedging relationship is tested prospectively and retrospectively. Prospectively, we apply the critical terms match for our foreign currency hedges as currencies, maturities, and the amounts are identical for the forecasted transactions and the spot element of the forward exchange rate contract or intrinsic value of the currency options, respectively. For interest rate swaps, we also apply the critical terms match as the notional amounts, currencies, maturities, basis of the variable legs or fixed legs, respectively, reset dates, and the dates of the interest and principal payments are identical for the debt instrument and the corresponding interest rate swaps. Therefore, over the life of the hedging instrument, the changes in the designated components of the hedging instrument will offset the impact of fluctuations of the underlying hedged items. The method of retrospectively testing effectiveness depends on the type of the hedge as described further below:
12
Notes to the Consolidated Financial Statements
Assured a) Cash Flow Hedge Retrospectively, effectiveness is tested on a cumulative basis applying the dollar offset method by using the hypothetical derivative method. Under this approach, the change in fair value of a constructed hypothetical derivative with terms reflecting the relevant terms of the hedged item is compared to the change in the fair value of the hedging instrument employing its relevant terms. The hedge is deemed highly effective if the results are within the range 80% to 125%. b) Fair Value Hedge Retrospectively, effectiveness is tested using statistical methods in the form of a regression analysis by which the validity and extent of the relationship between the change in value of the hedged items as the independent and the fair value change of the derivatives as the dependent variable is determined. The hedge is deemed highly effective if the determination coefficient between the hedged items and the hedging instruments exceeds 0.8 and the slope coefficient lies within a range of –0.8 to –1.25. Trade and Other Receivables Trade receivables are recorded at invoiced amounts less sales allowances and allowances for doubtful accounts. We record these allowances based on a specific review of all significant outstanding invoices. When analyzing the recoverability of our trade receivables, we consider the following factors: – �First, we consider the financial solvency of specific customers and record an allowance for specific customer balances when we believe it is probable that we will not collect the amount due according to the contractual terms of the arrangement. – �Second, we evaluate homogenous portfolios of trade receivables according to their default risk primarily based on the age of the receivable and historical loss experience, but also taking into consideration general market factors that might impact our trade receivable portfolio. We record a general bad debt allowance to record impairment losses for a portfolio of trade receivables when we believe that the age of the receivables indicates that it is probable that a loss has occurred and we will not collect some or all of the amounts due.
Notes to the Consolidated Financial Statements
Account balances are written off, that is, charged off against the allowance after all collection efforts have been exhausted and the likelihood of recovery is considered remote. In our Consolidated Income Statements, expenses from recording bad debt allowances for a portfolio of trade receivables are classified as other operating income, net, whereas expenses from recording bad debt allowances for specific customer balances are classified as cost of software and software-related services or cost of professional services and other services, depending on the transaction from which the respective trade receivable results. Sales allowances are recorded as an offset to the respective revenue item. Included in trade receivables are unbilled receivables related to fixed-fee and time-and-material consulting arrangements for contract work performed to date. Other Non-Financial Assets Other non-financial assets are recorded at amortized cost, which approximates fair value due to their short-term nature. Intangible Assets We classify intangible assets according to their nature and use in our operation. Software and database licenses consist primarily of technology for internal use, whereas acquired technology consists primarily of purchased software to be incorporated into our product offerings and in-process research and development. Customer relationship and other intangibles consist primarily of customer contracts and acquired trademark licenses.
13
Assured All our purchased intangible assets other than goodwill have finite useful lives. They are initially measured at acquisition cost and subsequently amortized either based on expected usage or on a straight-line basis over their estimated useful lives ranging from two to 16 years.
Useful Lives of Property, Plant, and Equipment
We recognize acquired in-process research and development projects as an intangible asset separate from goodwill if a project meets the definition of an asset. Amortization for these intangible assets starts when the projects are complete and the developed software is taken to the market. We typically amortize these intangibles over five to seven years.
Automobiles
Amortization expenses of intangible assets are classified as cost of software and software-related services, cost of professional services and other services, research and development, sales and marketing, and general and administration depending on their use. Property, Plant, and Equipment Property, plant, and equipment are carried at acquisition cost plus the fair value of related asset retirement costs, if any and if reasonably estimable, and less accumulated depreciation. Interest incurred during the construction of qualifying assets is capitalized and amortized over the related assets’ estimated useful lives. Property, plant, and equipment are depreciated over their expected useful lives, generally using the straight-line method.
14
Buildings
25 to 50 years
Leasehold improvements
Based on the lease contract
Information technology equipment Office furniture
3 to 5 years 4 to 20 years 4 to 5 years
Leasehold improvements are depreciated using the straightline method over the shorter of the term of the lease or the useful life of the asset. If a renewal option exists, the term used reflects the additional time covered by the option if exercise is reasonably assured when the leasehold improvement is first put into operation. Impairment of Goodwill and Non-Current Assets We test goodwill for impairment at least annually and when events occur or changes in circumstances indicate that the recoverable amount of a cash-generating unit to which goodwill has been allocated is less than its carrying value. The recoverable amount of goodwill is estimated each year at the same time. The goodwill impairment test is performed at the level of our operating segments since there are no lower levels in SAP at which goodwill is monitored for internal management purposes. For the purpose of impairment testing, goodwill acquired in a business combination is allocated to the operating segments that are expected to benefit from the synergies of the combination. If the carrying amount of the operating segment to which the goodwill is allocated exceeds the recoverable amount, an impairment loss on goodwill allocated to this operating segment is recognized. The recoverable amount is the higher of the operating segment’s fair value less costs of disposal and its value in use. Fair value less costs of disposal is the price that would be received to sell an asset or cash generating unit or paid to transfer a liability in an orderly transaction between market participants at the measurement date, less the cost of
Notes to the Consolidated Financial Statements
Assured disposal. Value in use is the present value of the future cash flows expected to be derived from an asset or cash-generating unit. Impairment losses on goodwill are not reversed in future periods. We review non-current assets, such as property, plant, equipment, and intangible assets for impairment whenever events or changes in circumstances indicate that the carrying amount of an asset or group of assets may not be recoverable. Intangible assets not yet available for use are tested for impairment annually. For the purpose of impairment testing, assets that cannot be tested individually are grouped together into the smallest group of assets that generates cash inflows from continuing use that are largely independent of the cash inflows of other assets or groups of assets. If assets do not generate cash inflows that are largely independent of those from other assets or groups of assets, the impairment test is not performed at an individual asset level; instead, it is performed at the level of the cash-generating unit (CGU) to which the asset belongs. An impairment loss is recognized if the carrying amount of an asset or its CGU exceeds its estimated recoverable amount. The recoverable amount of an asset or its CGU is the greater of its value in use and its fair value less costs of disposal. In assessing value in use, the estimated future cash flows are discounted to their present value using a pre-tax discount rate that reflects current market assessments of the time value of money and the risks specific to the asset. Impairment losses are presented in other operating income, net in profit or loss.
Notes to the Consolidated Financial Statements
Contingent Assets We carry insurance policies to, among other things, offset the expenses associated with defending against litigation matters as well as other risks. We recognize the respective reimbursements in profit or loss when it is virtually certain that the reimbursement will be received and retained by us. Liabilities Financial Liabilities Financial liabilities include trade and other payables, bank loans, issued bonds, private placements and other financial liabilities which comprise derivative and non-derivative financial liabilities. Financial liabilities are recognized and measured in accordance with IAS 39. Accordingly, they are recognized in the Consolidated Financial Statements if we have a contractual obligation to transfer cash or another financial asset to another party. Financial liabilities are initially recognized at fair value. In the case of financial liabilities not measured at fair value through profit or loss, the initial measurement includes directly attributable transaction costs. If material, financial liabilities are discounted to present value based on prevailing market rates adjusted for credit risk, with the discount being recognized over time as interest expense. The subsequent measurement depends on the allocation of financial liabilities to the following categories according to IAS 39: – �Financial liabilities at fair value through profit or loss only comprise those financial liabilities that are held for trading, as we do not designate financial liabilities at fair value through profit or loss on initial recognition. This category solely contains embedded and other derivatives with negative fair values, except where hedge accounting is applied. All changes in the fair value of financial liabilities in this category are immediately recognized in profit or loss. For more information about derivatives, see the Derivatives section. – �Financial liabilities at amortized cost include all nonderivative financial liabilities which are measured at amortized cost using the effective interest method.
15
Assured Expenses and gains/losses on financial liabilities consist of interest expense, and gains and losses from the disposal of such liabilities. Interest expense is recognized based on the effective interest method. Financial liabilities are derecognized when the contractual obligation is discharged, canceled, or has expired. Non-Financial Liabilities Other non-financial liabilities with fixed or determinable payments that are not quoted in an active market are mainly the result of obligations to employees and fiscal authorities and are generally measured at amortized cost. Provisions Provisions are recorded when all of the following conditions are met: – I� t is more likely than not that we have a legal or constructive obligation to third parties as a result of a past event. – �The amount can be reasonably estimated. – I� t is probable that there will be an outflow of future economic benefits to settle the obligation, while there may be uncertainty about the timing or amount of the future expenditure required in the settlement. We regularly adjust provisions as further information becomes available or circumstances change. Non-current provisions are reported at the present value of their expected settlement amounts as at the reporting date. Discount rates are regularly adjusted to current market interest rates. A provision for restructuring is recognized when we have approved a detailed and formal restructuring plan and the restructuring has commenced or has been announced.
16
Post-Employment Benefits We measure our pension-benefit liabilities and other postemployment benefits based on actuarial computations using the projected-unit-credit method in accordance with IAS 19. The assumptions used to calculate pension liabilities and costs are disclosed in Note (18a). As a result of the actuarial calculation for each plan, we recognize an asset or liability for the overfunded or underfunded status of the respective defined benefit plan. We classify a portion of the liability as current (determined on a plan-by-plan basis) if the amount by which the actuarial present value of benefits included in the benefit obligation payable within the next 12 months exceeds the fair value of plan assets. Remeasurements of the defined benefit obligation (DBO) or plan assets resulting from demographic and financial data different than originally assumed and from changes in assumptions can result in actuarial gains and losses. We recognize all such remeasurements immediately in retained earnings through other comprehensive income. They will not be reclassified to profit or loss in subsequent periods. Net interest expense and other expenses related to defined benefit plans are recognized in employee expenses. SAP’s pension benefits are classified as defined contribution plans if the payment to a separate fund relieves SAP of all obligations from the pension plan. Obligations for contributions to defined contribution pension plans are recognized as an expense in profit or loss when paid or due. Certain of our foreign subsidiaries are required to provide termination indemnity benefits to their employees regardless of the reason for termination (retirement, voluntary, or involuntary). We treat these plans as defined benefit pension plans if the substance of the post-employment plan is a pension-type arrangement. Most of these arrangements provide the employee with a one-time payout based on compensation levels, age, and years of service on termination independent of the reason (retirement, voluntary, or involuntary).
Notes to the Consolidated Financial Statements
Assured Deferred Income Deferred income is recognized as software revenue, support revenue, cloud subscription and support revenue, consulting revenue, or other service revenue, depending on the reasons for the deferral, once the basic applicable revenue recognition criteria have been met, for example, when the related services are performed or when the discounts are used. (3c) Management Judgments and Sources of Estimation Uncertainty The preparation of the Consolidated Financial Statements in conformity with IFRS requires management to make judgments, estimates, and assumptions that affect the application of accounting policies and the reported amounts of assets, liabilities, revenues, and expenses, as well as disclosure of contingent assets and liabilities. We base our judgments, estimates, and assumptions on historical and forecast information, as well as regional and industry economic conditions in which we or our customers operate, changes to which could adversely affect our estimates. Although we believe we have made reasonable estimates about the ultimate resolution of the underlying uncertainties, no assurance can be given that the final outcome of these matters will be consistent with what is reflected in our assets, liabilities, revenues, and expenses. Actual results could differ from original estimates. The accounting policies that most frequently require us to make judgments, estimates, and assumptions, and therefore are critical to understanding our results of operations, include the following: – Revenue recognition – Valuation of trade receivables – Accounting for share-based payments – Accounting for income tax – Accounting for business combinations – Subsequent accounting for goodwill and other intangibles – Accounting for legal contingencies – �Recognition of internally generated intangible assets from development
Notes to the Consolidated Financial Statements
Our management periodically discusses these critical accounting policies with the Audit Committee of the Supervisory Board. Revenue Recognition As described in the Revenue Recognition section of Note (3b), we do not recognize revenue before persuasive evidence of an arrangement exists, delivery has occurred, the risks and rewards of ownership have been transferred to the customer, the amount of revenue can be measured reliably, and collection of the related receivable is probable. The determination of whether the amount of revenue can be measured reliably or whether the fees are collectible is inherently judgmental as it requires estimates as to whether and to what extent subsequent concessions may be granted to customers and whether the customer is expected to pay the contractual fees. The timing and amount of revenue recognition can vary depending on what assessments have been made. In most of our revenue-generating arrangements we sell to the customer more than one product solution or service. Additionally, we have ongoing relationships with many of our customers and often enter into several transactions with the same customer within close proximity in time. We therefore have to determine the following: – �Which arrangements with the same customer are to be accounted for as one arrangement – �Which deliverables under one arrangement are to be accounted for separately – �How to allocate the total arrangement fee to the individual elements of one arrangement
17
Assured The determination of whether different arrangements with the same customer are to be accounted for as one arrangement is highly judgmental, as it requires us to evaluate whether the arrangements are negotiated together or linked in any other way. The timing and amount of revenue recognition can vary depending on whether two arrangements are accounted for separately or as one arrangement. Under an arrangement including on-premise software, or a cloud subscription, and other deliverables, we do not account for the on-premise software, or cloud subscription, and the other deliverables separately if one of the other deliverables (such as consulting services) is deemed to be essential to the functionality of the on-premise software, or cloud subscription. The determination whether an undelivered element is essential to the functionality of the delivered element requires the use of judgment. The timing and amount of revenue recognition can vary depending on how that judgment is exercised, because revenue may be recognized over a longer service term. We also do not account separately for different deliverables under an arrangement if we have no basis for allocating the overall arrangement fee to the different elements of the arrangement. However, we believe that such allocation basis exists if we can either demonstrate for each undelivered element of the arrangement a company-specific fair value, or, where such company-specific fair value cannot be established, if we can reasonably estimate stand-alone selling prices, as further defined in the Revenue Recognition section of Note (3b). Judgment is required in the determination of an appropriate fair value measurement which may impact the timing and amount of revenue recognized depending on the following: – �Whether an appropriate measurement of fair value can be demonstrated for undelivered elements. – The approaches used to establish fair value.
18
Additionally, our revenue for on-premise software contracts would be significantly different if we applied a revenue allocation policy other than the residual method. Revenue from consulting, other services, and customerspecific on-premise software development projects is determined by applying the percentage-of-completion method. The percentage-of-completion method requires us to make estimates about total revenue, total cost to complete the project, and the stage of completion. The assumptions, estimates, and uncertainties inherent in determining the stage of completion affect the timing and amounts of revenue recognized and expenses reported. If we do not have a sufficient basis to measure the progress of completion or to estimate the total contract revenue and costs, revenue recognition is limited to the amount of contract costs incurred. The determination of whether a sufficient basis to measure the progress of completion exists is judgmental. Changes in estimates of progress towards completion and of contract revenue and contract costs are accounted for as cumulative catch-up adjustments to the reported revenue for the applicable contract. Valuation of Trade Receivables As described in the Trade and Other Receivables section in Note (3b), we account for impairments of trade receivables by recording sales allowances and allowances for doubtful accounts on an individual receivable basis and on a portfolio basis. The assessment of whether a receivable is collectible is inherently judgmental and requires the use of assumptions about customer defaults that could change significantly. Judgment is required when we evaluate available information about a particular customer’s financial situation to determine whether it is probable that a credit loss will occur and the amount of such loss is reasonably estimable and thus an allowance for that specific account is necessary. Basing the general allowance for the remaining receivables on our historical loss experience, too, is highly judgmental, as history may not be indicative of future development, particularly
Notes to the Consolidated Financial Statements
Assured in the global economic circumstances resulting from the recent global financial crisis. Changes in our estimates about the allowance for doubtful accounts could materially impact the reported assets and expenses in our financial statements, and our profit could be adversely affected if actual credit losses exceed our estimates.
(SOP PP), we believe that future payout will be significantly impacted not only by our share price but also by the requirement to outperform the TechPGI. Changes in these factors could significantly affect the estimated fair values as calculated by the option-pricing model, and the future payout. For more information about these plans, see Note (27).
Accounting for Share-Based Payments We use certain assumptions in estimating the fair values for our share-based payments, including expected future share price volatility and expected option life (which represents our estimate of the average amount of time remaining until the options are exercised or expire unexercised). In addition, the final payout for these plans also depends on our share price at the respective exercise dates. All these assumptions may significantly impact the fair value determination and thus the amount and timing of our share-based payment expense. Furthermore, the fair values of the options granted under our 2009 Plan (SOP PP) are dependent on our performance against the Technology Peer Group Index (TechPGI) since the respective grant date, the volatility and the expected correlation between the market price of this index, and our share price.
Accounting for Income Tax We conduct operations and earn income in numerous foreign countries and are subject to changing tax laws in multiple jurisdictions within the countries in which we operate. Our ordinary business activities also include transactions where the ultimate tax outcome is uncertain, such as those involving revenue sharing and cost reimbursement arrangements between SAP Group entities. In addition, the amount of income tax we pay is generally subject to ongoing audits by domestic and foreign tax authorities. As a result, judgment is necessary in determining our worldwide income tax provisions. We have made reasonable estimates about the ultimate resolution of our tax uncertainties based on current tax laws and our interpretation thereof. Such judgment can have a material effect on our income tax expense, income tax provision, and profit after tax.
For the purpose of determining the estimated fair value of our stock options, we believe expected volatility is the most sensitive assumption. Regarding future payout under the plans, the price of SAP’s shares will be the most relevant factor. The fair values of the Restricted Share Units (RSUs) granted under our Employee Participation Plan (EPP) and Long-Term Incentive Plan (LTI) 2015 depend on SAP’s share price directly after the announcement of the preliminary fourth quarter and fullyear results for the last financial year of the respective performance period under the EPP (three-year holding period under the LTI 2015), and thus may be significantly above or below the budgeted amounts. With respect to our plan granted in 2009
The carrying amount of a deferred tax asset is reviewed at the end of each reporting period and is reduced to the extent that it is no longer probable that sufficient taxable profit will be available to allow the benefit of part or all of the deferred tax assets to be utilized. This assessment requires management judgment, estimates, and assumptions. In evaluating our ability to utilize our deferred tax assets, we consider all available positive and negative evidence, including the level of historical taxable income and projections for future taxable income over the periods in which the deferred tax assets are recoverable. Our judgment regarding future taxable income is based on expectations of market conditions and other facts and circumstances. Any adverse change to the underlying facts or our estimates and assumptions could require that we reduce the carrying amount of our net deferred tax assets. For more information about our income tax, see Note (10).
Notes to the Consolidated Financial Statements
19
Assured Accounting for Business Combinations In our accounting for business combinations, judgment is required in determining whether an intangible asset is identifiable, and should be recorded separately from goodwill. Additionally, estimating the acquisition date fair values of the identifiable assets acquired and liabilities assumed involves considerable management judgment. The necessary measurements are based on information available at the acquisition date and are based on expectations and assumptions that have been deemed reasonable by management. These judgments, estimates, and assumptions can materially affect our financial position and profit for several reasons, among which are the following: –F � air values assigned to assets subject to depreciation and amortization affect the amounts of depreciation and amortization to be recorded in operating profit in the periods following the acquisition. –S � ubsequent negative changes in the estimated fair values of assets may result in additional expense from impairment charges. –S � ubsequent changes in the estimated fair values of liabilities and provisions may result in additional expense (if increasing the estimated fair value) or additional income (if decreasing the estimated fair value). Subsequent Accounting for Goodwill and Other Intangibles As described in the Intangible Assets section in Note (3b), all our intangible assets other than goodwill have finite useful lives. Consequently, the depreciable amount of the intangible assets is allocated on a systematic basis over their useful lives. Judgment is required in determining the following: – �The useful life of an intangible asset, as this determination is based on our estimates regarding the period over which the intangible asset is expected to produce economic benefits to us. – �The amortization method, as IFRS requires the straight-line method to be used unless we can reliably determine the pattern in which the asset’s future economic benefits are expected to be consumed by us.
20
Both the amortization period and the amortization method have an impact on the amortization expense that is recorded in each period. In making impairment assessments for our intangible assets and goodwill, the outcome of these tests is highly dependent on management’s latest estimates and assumptions regarding future cash flow projections and economic risks, which are complex and require significant judgment and assumptions about future developments. They can be affected by a variety of factors, including changes in our business strategy, our internal forecasts, and an estimate of our weighted-average cost of capital. Due to these factors, actual cash flows and values could vary significantly from the forecasted future cash flows and related values derived using the discounted cash flow method. Although we believe the assumptions and estimates we have made in the past have been reasonable and appropriate, different assumptions and estimates could materially affect our financial position and profit. The results of goodwill impairment tests may depend on the allocation of goodwill to our operating segments. This allocation is judgmental as it is based on our estimates regarding which operating segments are expected to benefit from the synergies of the business combination. We recognized no impairment losses on our goodwill and no significant impairment losses on our intangible assets during 2013. Although we do not currently have an indication of any significant impairment, there can be no assurance that impairment losses will not occur in the future. For more information, see Note (15).
Notes to the Consolidated Financial Statements
Assured Accounting for Legal Contingencies As described in Note (23), we are currently involved in various claims and legal proceedings. We review the status of each significant matter not less frequently than each quarter and assess our potential financial and business exposures related to such matters. Significant judgment is required in the determination of whether a provision is to be recorded and what the appropriate amount for such provision should be. Notably, judgment is required in the following: – �Determining whether an obligation exists – �Determining the probability of outflow of economic benefits – �Determining whether the amount of an obligation is reliably estimable – �Estimating the amount of the expenditure required to settle the present obligation Due to uncertainties relating to these matters, provisions are based on the best information available at the time. At the end of each reporting period, we reassess the potential obligations related to our pending claims and litigation and adjust our respective provisions to reflect the current best estimate. In addition, we monitor and evaluate new information that we receive after the end of the respective reporting period but before the Consolidated Financial Statements are authorized for issue to determine whether this provides additional information regarding conditions that existed at the end of the reporting period. Such revisions to our estimates of the potential obligations could have a material impact on our financial position and profit. For further information about this case, see Notes (18b) and (23).
of being used as intended by management. In contrast, all expenditures arising from the research phase are expensed as incurred. We believe that determining whether internally generated intangible assets from development are to be recognized as intangible assets requires significant judgment, particularly in the following areas: – �Determining whether activities should be considered research activities or development activities. – �Determining whether the conditions for recognizing an intangible asset are met requires assumptions about future market conditions, customer demand and other developments. – �The term “technical feasibility” is not defined in IFRS, and therefore determining whether the completion of an asset is technically feasible requires judgment and a companyspecific approach. – �Determining the future ability to use or sell the intangible asset arising from the development and the determination of the probability of future benefits from sale or use. – �Determining whether a cost is directly or indirectly attributable to an intangible asset and whether a cost is necessary for completing a development. We have determined that the conditions for recognizing internally generated intangible assets from our software development activities are not met until shortly before the developed products are available for sale. This assessment is monitored by us on a regular basis.
Recognition of Internally Generated Intangible Assets from Development Under IAS 38, internally generated intangible assets from the development phase are recognized if certain conditions are met. These conditions include the technical feasibility, intention to complete, the ability to use or sell the asset under development, and the demonstration of how the asset will generate probable future economic benefits. The cost of a recognized internally generated intangible asset comprises all directly attributable cost necessary to make the asset capable
Notes to the Consolidated Financial Statements
21
Assured (3d) New Accounting Standards Adopted in the Current Period The following new accounting standards and amendments to standards have been adopted in fiscal year 2013: – �Amendments to IFRS 7 (Financial Instruments: Disclosures) – Offsetting financial assets and financial liabilities, which require entities to disclose gross amounts subject to rights of set-off, amounts set off in accordance with the accounting standards followed, and the related net credit exposure. The amendments did not result in an impact on the Company’s Consolidated Financial Statements. – �IFRS 10 (Consolidated Financial Statements), IFRS 11 (Joint Arrangements), and IFRS 12 (Disclosure of Interests in Other Entities) including amendments to the transition guidance for IFRS 10-12 issued in June 2012, which provide a single consolidation model that identifies control as the basis for consolidation for all types of entities, establish principles for the financial reporting by parties to a joint arrangement, and combine, enhance and replace the disclosure requirements for subsidiaries, joint arrangements, associates and structured entities. The adoption of this new set of standards (we adopted the new standards earlier than required by the European Union) did not result in a change in the financial position of the Group. However, additional qualitative and quantitative disclosure has been added, for example, with respect to consolidated structured entities. – �IFRS 13 (Fair Value Measurement), which defines fair value, sets out in a single IFRS a framework for measuring fair value, and requires disclosures about fair value measurements. The adoption of the standard has resulted in
22
additional disclosures, for example, relating to risks associated with financial instruments and to the valuation techniques used for the valuation of the financial instruments. – �Amendments to IAS 1 (Presentation of Financial Statements), which aim to improve and align the presentation of items of other comprehensive income in financial statements prepared in accordance with IFRS and U.S. GAAP. Since SAP had already made appropriate changes in the Consolidated Statements of Comprehensive Income in prior years, the adoption of the standard did not result in any changes to the Consolidated Financial Statements. – �Amendments to IAS 19, which aim to improve the understanding of how defined benefit plans affect an entity’s financial position, financial performance, and cash flows. The retrospective application of the revised IAS 19 in accordance with the transitional provisions set out in IAS 19.173 (as revised in 2011) resulted in the netting of items in the Consolidated Statements of Financial Position (mandatory netting of plan assets with time credits and semiretirement obligations now classified as other long-term employee benefits), reclassifications of certain employee benefit liabilities from short-term benefits to long-term benefits and consequential remeasurement of these liabilities. These changes, which are immaterial both individually and in the aggregate, resulted in amounts of adjustments for the following balance sheet line items as of December 31, 2012: decrease of non-current other financial assets by €124 million, increase of deferred tax assets by €18 million (thus reducing total assets by €106 million), increase of current other non-financial liabilities by €68 million, decrease of current and non-current other provisions by €93 million and €45 million respectively, increase of deferred tax liabilities by €3 million (thus reducing total liabilities by €67 million) and a reduction of retained earnings by €39 million. The impacts on our income statements were inconsequential in all periods presented. The standard also resulted in additional
Notes to the Consolidated Financial Statements
Assured disclosures (for example, a sensitivity analysis for changes in defined benefit obligations, additional components considered in actuarial assumptions, etc.), for more information see Note (18a). – �Amendments to IAS 36 (Impairment of Assets), which aim to remove the unintended consequences of IFRS 13 on the disclosures required under IAS 36 and expand the disclosures on recoverable amounts of assets or cash-generating units when they are based on fair value less costs of disposals. SAP has early-adopted these new amendments to IAS 36. (3e) New Accounting Standards Not Yet Adopted The standards and interpretations (relevant to the Group) that are issued, but not yet effective, up to the date of issuance of the Group’s financial statements are disclosed below. The Group intends to adopt these standards, if applicable, when they become effective:
– �IFRS 9 (Financial Instruments) and subsequent amendments to IFRS 7 and IFRS 9, which will be applicable in fiscal year 2017 at the earliest (the final mandatory effective date is expected to be determined after the final guidance has been issued). The new guidance is expected to impact the classification and measurement of financial assets. We have not yet completed the determination of the impact on our Consolidated Financial Statements. – �Amendments to IAS 32 (Financial Instruments: Presentation) – Offsetting financial assets and financial liabilities, which become mandatory for the Group’s 2014 Consolidated Financial Statements, aim to eliminate inconsistencies when applying the offsetting criteria and include some clarifications. The amendments will not have a material impact on our Consolidated Financial Statements. (4) Business Combinations In 2013, we concluded the following business combinations:
Acquired Businesses Acquisition Type
Acquired Voting Interest
Acquisition Date
Ticket-Web GmbH & Co. KG, Wildau, Germany
Sector Solution provider of ticketing & customer relationship management
Asset Deal
NA
March 4, 2013
KMS Software Company LLC., Los Angeles, California, USA
Provider of employee onboarding solutions
Asset Deal
NA
April 1, 2013
Camilion Solutions, Inc., Toronto, Canada
Solutions for the insurance industry
Share Deal
100%
April 2, 2013
SmartOps Corporation, Pittsburgh, Pennsylvania, USA
Provider of inventory and service-level optimization software solutions
Share Deal
100%
April 12, 2013
hybris AG, Rotkreuz, Switzerland
Provider of independent commerce technology (B2B and B2C)
Share Deal
100%
August 1, 2013
KXEN Inc., San Francisco, California, USA
Provider of predictive analytics technology for line of business users and analysts
Share Deal
100%
October 1, 2013
We acquire businesses in specific areas of strategic interest to us.
Notes to the Consolidated Financial Statements
23
Assured Acquisition of hybris On August 1, 2013, following satisfaction of applicable regulatory and other approvals, we acquired 100% of the shares of hybris AG. hybris is a recognized leader in independent commerce technology (B2B and B2C). We expect this acquisition to combine hybris’s omnichannel commerce solution with SAP’s enterprise technology and in-memory, cloud, and mobile innovations and help facilitate new levels of customer insight and engagement. Financial Impact of Our Acquisitions as of the Acquisition Date The following table summarizes the values of identifiable assets acquired and liabilities assumed, as of the acquisition date.
Recognized Amounts of Identifiable Assets Acquired and Liabilities Assumed € millions
Cash and cash equivalents Other financial assets
Total
Thereof hybris
16
10
1
1
40
30
Other non-financial assets
5
4
Property, plant, and equipment
8
7
376
332
Trade and other receivables
Intangible assets Thereof acquired technology
192
167
Thereof customer relationship and other intangibles
182
164
Customer relationship
156
144
Trade name
11
10
Other intangible assets
15
10
Thereof software and database licenses Current and deferred tax assets Total identifiable assets
2
1
21
13
467
397
Trade accounts payable
13
10
Loans and borrowings
25
24
Current and deferred tax liabilities
83
67
Provisions and other non-financial liabilities
34
30
Thereof legal and litigation related liabilities
1
1
16
14
Total identifiable liabilities
171
145
Total identifiable net assets
296
252
Goodwill
840
780
1,136
1,032
Deferred revenue
Total consideration transferred in cash
The goodwill arising from the acquisitions consists largely of the synergies and the know-how and technical skills of the acquired businesses’ workforces.
24
Notes to the Consolidated Financial Statements
Assured hybris goodwill is attributed to expected synergies from the acquisition particularly sourcing from the customers’ transformations from channel-centric to omnichannel business. By combining hybris commerce solutions with SAP products, we expect to enable our customers – across all devices, delivery channels and touchpoints – to provide new levels of real-time customer interaction and customer engagement. The initial accounting for the business combinations entered into in 2013 is incomplete because we are still obtaining the information necessary to identify and measure contingent liabilities and tax related assets and liabilities of the acquired businesses. Accordingly, the respective amounts recognized in our financial statements for these items are regarded provisional as of December 31, 2013. The acquisition-related costs incurred totaled €10 million for our 2013 business combinations, all of which were recognized in general and administration expense. Impact of Business Combinations on Our Financial Statements The amounts of revenue and profit or loss of the hybris business acquired in 2013 since the acquisition date included in the consolidated income statements for the reporting period are as follows:
Impact of hybris on SAP’s Financials € millions Con tribution of hybris Revenue Profit after tax
Notes to the Consolidated Financial Statements
70
Had hybris been consolidated as of January 1, 2013, our estimated pro forma revenue for the reporting period would have been €16,865 million, and pro forma profit after tax would have been €3,282 million. These amounts were calculated after applying the Company’s accounting policies and after adjusting the results for hybris to reflect, for example: – �Additional depreciation and amortization that would have been charged assuming the fair value adjustment to property, plant, and equipment and intangible assets had been applied from January 1, 2013 – �The impact of fair value adjustments on deferred revenue on a full-year basis – �The borrowing costs on the funding levels and debt/equity position of the Company after the business combination – Employee benefits – Related tax effects These pro forma numbers have been prepared for comparative purposes only. The pro forma revenue and profit numbers are not necessarily indicative of either the results of operations that would have actually occurred had the acquisition been in effect at the beginning of the respective periods or of future results. Prior year acquisitions are described in the Consolidated Financial Statements in the 2012 Annual Report. (5) Revenue For detailed information about our revenue recognition policies, see Note (3). For revenue information by segment and geographic region, see Note (28).
−11
25
Assured Revenue from construction-type contracts (contract revenue) is included in software revenue and consulting revenue depending on the type of project. The status of our construction projects in progress at the end of the reporting period accounted for under IAS 11 was as follows:
(7) Employee Benefits Expense and Headcount Employee Benefits Expense Employee benefits expense comprises the following:
Employee Benefits Expense Construction Projects in Progress
€ millions
€ millions 2013
2012
2011
Revenue recognized in the respective year
194
196
172
Aggregate cost recognized (multi-year)
221
Salaries
255
229
Recognized result (+ profit/– loss; multi-year)
87
2
Advance payments received
1
3
5
Gross amounts due from customers
3
7
20
69
15
44
3
34
27
Gross amounts due to customers Loss provisions
14
(6) Other Operating Income/Expense, Net Other operating income/expense, net, was as follows:
2013
2012
2011
5,997
5,726
4,938
Social security expense
857
777
642
Pension expense
212
190
168
Share-based payment expense
327
522
68
Termination benefits
39
65
65
Employee-related restructuring expense
57
6
0
7,489
7,286
5,880
Employee benefits expense
Pension expense includes the amounts recorded for our defined benefit and defined contribution plans as described in Note (18a). Expenses for local state pension plans are included in social security expense. Number of Employees On December 31, 2013, the breakdown of our full-time equivalent employee numbers by function in SAP and by region was as follows:
Other Operating Income/Expense, Net € millions 2013
2012
2011
−6
−3
−3
0
−5
18
Miscellaneous other operating income
19
31
10
Other operating income/
12
23
25
Miscellaneous other operating expenses Gain/loss on disposals of non-current assets
expense, net
26
Notes to the Consolidated Financial Statements
Assured Number of Employees Full-time equivalents December 31, 2013
Software and software-related services Professional services and other services
December 31, 2012
December 31, 2011
EMEA1)
Americas
Asia Pacific Japan
Total
EMEA1)
Americas
Asia Pacific Japan
Total
EMEA1)
Americas
Asia Pacific Japan
Total
4,859
2,861
3,541
11,261
4,559
2,628
3,364
10,551
4,068
2,079
2,816
8,963
7,177
4,406
3,047
14,629
7,020
4,399
2,840
14,259
6,808
3,963
2,497
13,268
Research and development
8,806
3,630
5,367
17,804
8,952
3,672
5,388
18,012
8,713
3,028
4,120
15,861
Sales and marketing
6,346
6,437
3,041
15,824
5,697
6,220
2,982
14,899
4,856
4,581
2,343
11,780
General and administration
2,424
1,445
697
4,566
2,243
1,383
660
4,286
2,073
1,120
542
3,735
Infrastructure
1,380
790
318
2,488
1,286
821
308
2,415
1,182
702
274
2,158
30,993
19,568
16,011
66,572
29,757
19,123
15,542
64,422
27,700
15,473
12,592
55,765
511
571
29
1,111
791
2,987
1,038
4,816
264
49
90
403
30,238
19,418
15,752
65,409
29,009
17,619
14,506
61,134
27,296
15,010
12,040
54,346
SAP Group (December 31) Thereof acquisitions SAP Group (months' end average) 1)
Europe, Middle East, Africa
Allocation of Share-Based Payment Expense The allocation of expense for share-based payments, net of the effects from hedging these instruments, to the various operating expense items is as follows:
Share-Based Payments € millions 2013
2012
2011
Cost of software and software-related services
40
42
5
Cost of professional services and other services
61
104
11
Research and development
90
125
16
Sales and marketing
96
123
15
General and administration
40
127
21
327
522
68
240
450
33
87
72
35
Share-based payments Thereof cash-settled share-based payments Thereof equity-settled share-based payments
For more information about our share-based payments, see Note (27).
Notes to the Consolidated Financial Statements
27
Assured (8) Other Non-Operating Income/Expense, Net Other non-operating income/expense, net was as follows:
Other Non-Operating Income/Expense, Net € millions
Foreign currency exchange gain/loss, net
2013
2012
2011
4
−154
−58
−75
−102
44
0
−2
0
184
−32
−177
−105
−20
79
0
2
−4
1
4
2
Miscellaneous other non-operating expense
−22
−23
−19
Other non-operating income/expense, net
−17
−173
−75
Thereof from financial assets/liabilities at fair value through profit or loss Thereof from available for sale financial assets Thereof from loans and receivables Thereof from financial liabilities at amortized cost Thereof from non-financial assets/liabilities Miscellaneous other non-operating income
28
Notes to the Consolidated Financial Statements
Assured (9) Financial Income, Net Financial Income, net was as follows:
Financial Income, Net € millions 2013
2012
2011
Finance income Interest income from available-for-sale financial assets (debt)
0
1
2
loans and receivables
37
45
58
derivatives
32
27
37
Gains on available-for-sale financial assets (debt) available-for-sale financial assets (equity) Share of result of associates Finance income
0
0
1
46
30
12
0
0
9
115
103
119
−131
−130
−123
−23
−28
−37
0
−1
8
−2
−1
0
−11
−7
−2
−14
−8
−7
−181
−175
−161
−66
−72
−42
Finance cost Interest expense from financial liabilities at amortized cost derivatives TomorrowNow litigation Losses on available-for-sale financial assets (equity) Impairment losses from available-for-sale financial assets (equity) Fee expenses Finance cost Financial income, net
Notes to the Consolidated Financial Statements
29
Assured (10) Income Tax Income tax expense for the years ended December 31 is attributable to the following regions:
Income tax expense for the years ended December 31 comprised the following components:
Major Components of Tax Expense Tax Expense According to Region
€ millions
€ millions 2013
2012
2013
2012
2011
1,249
1,173
1,152
−87
33
4
1,162
1,206
1,156
−168
−266
164
77
53
11
−91
−213
175
1,071
993
1,331
2011 Current tax expense/income
Current tax expense
Tax expense for current year
Germany
836
700
635
Taxes for prior years
Foreign
326
506
521
Total current tax expense
1,162
1,206
1,156
51
−11
−14
−142
−202
189
−91
−213
175
1,071
993
1,331
Total current tax expense Deferred tax expense/income Germany Foreign Total deferred tax expense/ income Total income tax expense
Deferred tax expense/income Origination and reversal of temporary differences Unused tax losses, research and development tax credits and foreign tax credits Total deferred tax expense/ income Total income tax expense
Profit before tax for the years ended December 31 consisted of the following:
Profit Before Tax € millions 2013
30
2012
2011 2,316
Germany
3,126
2,460
Foreign
1,270
1,336
2,451
Total
4,396
3,796
4,767
Notes to the Consolidated Financial Statements
Assured The following table reconciles the expected income tax expense computed by applying our combined German tax rate of 26.41% (2012: 26.47%; 2011: 26.34%) to the actual income tax expense. Our 2013 combined German tax rate includes a corporate income tax rate of 15.00% (2012: 15.00%; 2011: 15.00%), plus a solidarity surcharge of 5.5% (2012: 5.5%; 2011: 5.5%) thereon, and trade taxes of 10.58% (2012: 10.64%; 2011: 10.51%).
€105 million of the prior-year tax income recognized in the current reporting period relate to assets acquired or liabilities assumed in business combinations of previous reporting periods. Deferred tax assets and liabilities on a gross basis as at December 31 are attributable to the following items:
Recognized Deferred Tax Assets and Liabilities Relationship Between Tax Expense and Profit Before Tax
€ millions
€ millions, unless otherwise stated
2013
2012
Deferred tax assets
2013
2012
2011
Intangible assets
87
117
Profit before tax
4,396
3,796
4,767
Property, plant, and equipment
18
35
Tax expense at applicable tax rate of 26.41% (2012: 26.47%; 2011: 26.34%)
1,161
1,005
1,256
Other financial assets Trade and other receivables Carryforwards of unused tax losses Pension provisions
Tax effect of: Foreign tax rates Non-deductible expenses Tax exempt income Withholding taxes Research and development and foreign tax credits Prior-year taxes
−116
−114
67
521
641
78
76
Share-based payments
105
122
Other provisions and obligations
305
305
158
111
89
−146
−169
−149
87
71
93
−41
−29
−33
Deferred income
48
46
Research and development and foreign tax credits
65
37
Other Deferred tax assets
−113
15
−25
60
31
0
Other
21
72
21
1,071
993
1,331
24.4
26.2
27.9
Effective tax rate (in %)
2
38
79
Reassessment of deferred tax assets, research and development tax credits, and foreign tax credits
Total income tax expense
7
121
120
1,393
1,568
696
844
Deferred tax liabilities Intangible assets Property, plant, and equipment Other financial assets Trade and other receivables
52
55
367
382
26
23
Pension provisions
6
4
Share-based payments
1
2
21
17
Other provisions and obligations Deferred income Other Deferred tax liabilities Deferred tax assets/liabilities, net
6
20
39
36
1,214
1,383
179
185
We retrospectively adjusted the provisional amounts recognized for deferred tax assets and liabilities related to the 2012 Ariba business combination by a corresponding decrease in goodwill in the amount of €82 million. The adjustment reflects new
Notes to the Consolidated Financial Statements
31
Assured information obtained about facts and circumstances as of the acquisition date, mainly about the utilization of carryforwards of unused tax losses.
The proposed dividend payment of €1.00 per share for the year ended December 31, 2013, will not have any effects on the income tax of SAP AG.
Deferred tax assets have not been recognized in respect of the following items for the years ended December 31:
Total income tax including the items charged or credited directly to share premium and other comprehensive income for the years ended December 31 consists of the following:
Items Not Resulting in a Deferred Tax Asset Total Income Tax
€ millions 2013
2012
2011
€ millions 2013
2012
2011
Unused tax losses Not expiring
68
49
38
Income tax recorded in profit
1,071
993
1,331
Expiring in the following year
43
6
10
−5
−4
−10
525
517
93
Income tax recorded in share premium
3
−4
−5
0
17
−1
Expiring after the following year Total unused tax losses
636
572
141
Deductible temporary differences
178
202
30
Unused research and development and foreign tax credits Not expiring Expiring in the following year Expiring after the following year Total unused tax credits
Income tax recorded in other comprehensive income that will not be reclassified to profit and loss Actuarial gains/losses on defined benefit pension plans
25
32
17
1
0
0
1
36
3
27
68
20
Income tax recorded in other comprehensive income that will be reclassified to profit and loss Gains/losses on cash flow hedges Currency effects
€421 million (2012: €367 million; 2011: €34 million) of the unused tax losses relate to U.S. state tax loss carryforwards. As described above, prior-year numbers for unused tax losses related to the 2012 Ariba business combination were adjusted, resulting in a decrease in the amount of €743 million.
Total
8
3
−6
1,077
1,005
1,309
We have not recognized a deferred tax liability on approximately €7.07 billion (2012: €5.84 billion) for undistributed profits of our subsidiaries, because we are in a position to control the timing of the reversal of the temporary difference and it is probable that such differences will not reverse in the foreseeable future.
32
Notes to the Consolidated Financial Statements
Assured The income tax recorded in share premium relates to our equity-settled share-based payment. We are subject to ongoing tax audits by domestic and foreign tax authorities. As a result of the tax audit of SAP AG and its German subsidiaries for the years 2003 through 2006, we are in dispute with the German tax authorities in respect of intercompany financing matters. We strongly disagree with the tax authorities’ position and intend to vigorously contest it. Currently, we expect that we will need to initiate litigation to prevail. We have not recorded a provision for this matter as we believe that the tax authorities’ claim has no merit and that no adjustment is warranted. If, contrary to our view, the German tax authorities were to prevail in their arguments before the court, we would expect to have an additional tax expense (including related interest expense) for the tax audit period 2003 through 2006 and for the following years 2007 through 2013 of approximately €168 million in total.
(11) Earnings per Share Restricted shares (the bonus shares in the Share Matching Plan discussed in Note (27) below) granted to employees under our share-based payments are included in the diluted earnings per share calculations to the extent they have a dilutive effect. Earnings per share for the years ended December 31 was calculated as follows:
Earnings per Share € millions, unless otherwise stated 2013
2012
2011
3,326
2,803
3,435
1,229
1,229
1,227
−35
−37
−38
1,193
1,192
1,189
2
1
1
1,195
1,193
1,190
Earnings per share, basic, attributable to equity holders of SAP AG (in €)
2.79
2.35
2.89
Earnings per share, diluted,
2.78
2.35
2.89
Profit attributable to equity holders of SAP AG Issued ordinary shares Effect of treasury shares Weighted average shares outstanding, basic1) Dilutive effect of share-based payments1) Weighted average shares outstanding, diluted1)
attributable to equity holders of SAP AG (in €) 1)
Notes to the Consolidated Financial Statements
Number of shares in millions
33
Assured (12) Other Financial Assets Other financial assets as at December 31 were as follows:
Other Financial Assets € millions 2013
Loans and other financial receivables Debt investments Equity investments Available-for-sale financial assets
2012
Current
Non-Current
Total
Current
Non-Current
Total
90
243
333
35
208
243
38
0
38
15
14
29
0
322
322
0
201
201
38
322
360
15
215
230
123
6
129
104
40
144
0
36
36
0
46
46
Total
251
607
858
154
509
663
Loans and Other Financial Receivables Loans and other financial receivables mainly consist of time deposits, investments in pension assets for which the corresponding liability is included in employee-related obligations (see Note (18b)), other receivables, and loans to employees and third parties. The majority of our loans and other financial receivables are concentrated in the United States.
These available-for-sale financial assets are denominated in the following currencies:
As at December 31, 2013, there were no loans and other financial receivables past due but not impaired. We have no indications of impairments of loans and other financial receivables that are not past due and not impaired as at the reporting date. For general information on financial risk and the nature of risk, see Note (24).
Euros
Derivatives Investments in associates
Available-for-Sale Financial Assets Our available-for-sale financial assets consist of debt investments in bonds of financial and non-financial corporations and municipalities and equity investments in listed and unlisted securities.
34
Currencies of Available-for-Sale Financial Assets € millions 2013
U.S. dollars
2012
51
36
305
185
Other
4
9
Total
360
230
For more information on fair value measurement with regard to our equity investments, see Note (26). Derivatives Detailed information about our derivative financial instruments is presented in Note (25).
Notes to the Consolidated Financial Statements
Assured (13) Trade and Other Receivables Trade and other receivables were as follows:
Trade and Other Receivables € millions 2013
Trade receivables, net Other receivables Total
2012
Current
Non-Current
Total
Current
Non-Current
Total
3,802
14
3,816
3,837
0
3,837
63
84
147
80
88
168
3,865
98
3,963
3,917
88
4,005
The carrying amounts of our trade receivables as at December 31 are as follows:
The changes in the allowance for doubtful accounts charged to expense were immaterial in all periods presented.
Carrying Amounts of Trade Receivables
Concentrations of credit risks are limited due to our large customer base and its distribution across many different industries and countries worldwide.
€ millions
Gross carrying amount
2013
2012
3,954
3,943
Sales allowances charged to revenue
−96
–73
Allowance for doubtful accounts charged to expense
−42
–33
3,816
3,837
Carrying amount trade receivables, net
Notes to the Consolidated Financial Statements
35
Assured The aging of trade receivables as at December 31 was:
Aging of Trade Receivables € millions
Not past due and not individually impaired
2013
2012
3,055
3,068
Past due but not individually impaired Past due 1 – 30 days
330
368
Past due 31 – 120 days
258
246
Past due 121 – 365 days
120
90
Past due over 365 days Total past due but not individually impaired Individually impaired, net of allowances Carrying amount of trade receivables, net
13
14
721
718
40
51
3,816
3,837
We believe that the recorded sales and bad debt allowances adequately provide for the credit risk inherent in trade receivables. For more information about financial risk and how we manage it, see Notes (24) and (25). (14) Other Non-Financial Assets
Other Non-Financial Assets € millions 2013
2012
Current
Non-Current
Total
Current
Non-Current
Total
179
57
236
149
68
217
Other tax assets
92
0
92
74
0
74
Capitalized contract cost
55
50
105
56
0
56
Advance payments
17
0
17
11
0
11
3
0
3
4
0
4
346
107
453
294
68
362
Prepaid expenses
Miscellaneous other assets Total
Prepaid expenses primarily consist of prepayments for operating leases, support services, and software royalties that will be recognized as an expense in future periods. 36
Notes to the Consolidated Financial Statements
Assured (15) Goodwill and Intangible Assets
Goodwill and Intangible Assets € millions Goodwill
Software and Database Licenses
Acquired Technology/IPRD
Customer Relationship and Other Intangibles
Total
12,494
Historical cost 8,808
489
1,267
1,930
Foreign currency exchange differences
January 1, 2012
−77
−2
−3
−27
−109
Additions from business combinations
4,557
4
578
1,152
6,291
Other additions
0
60
0
0
60
Retirements/disposals
0
−18
−64
−1
−83 18,653
December 31, 2012
13,288
533
1,778
3,054
Foreign currency exchange differences
−345
−2
−40
−95
−482
Additions from business combinations
840
2
192
182
1,216
Other additions
0
43
0
0
43
Retirements/disposals
0
−18
−1
−105
−124
13,783
558
1,929
3,036
19,306
January 1, 2012
97
295
692
675
1,759
Foreign currency exchange differences
−1
−3
−6
−8
−18
Additions amortization
0
57
192
316
565
Retirements/disposals
0
−14
−64
−1
−79
Transfers
0
0
29
−29
0
December 31, 2012
96
335
843
953
2,227
Foreign currency exchange differences
−45
December 31, 2013 Accumulated amortization
−1
−2
−20
−22
Additions amortization
0
51
249
303
603
Retirements/disposals
0
−17
−1
−105
−123
95
367
1,071
1,129
2,662
Carrying value December 31, 2012
13,192
198
935
2,101
16,426
Carrying value December 31, 2013
13,688
191
858
1,907
16,644
December 31, 2013
Notes to the Consolidated Financial Statements
37
Assured The additions other than from business combinations to software and database licenses in 2013 and 2012 were individually acquired from third parties and include crosslicense agreements and patents.
We carry the following significant intangible assets:
Significant Intangible Assets Carrying Amount in € Millions 2013
Remaining Useful Life in Years
2012
Business Objects – Customer relationships: Maintenance
150
181
8 – 11
Sybase – Acquired technologies
225
330
1 – 3
Sybase – Customer relationships: Maintenance
466
581
9
66
109
1 – 7
Sybase – Customer relationships: Messaging and license SuccessFactors – Acquired technologies
206
260
6
SuccessFactors – Customer relationships: Subscription
383
404
13
Ariba – Acquired technologies
186
238
7
Ariba – Customer relationships
480
508
12 – 14
hybris – Acquired technologies
159
0
7
hybris – Customer relationships
137
0
4 – 14
2,458
2,611
Total significant intangible assets
The carrying amount of goodwill has been allocated for impairment testing purposes to the SAP’s operating segments at December 31, 2013, and 2012, as follows:
Goodwill by Operating Segment € millions
Adjustments January 1, 2013
On-Premise Products
On-Premise Services
Cloud Applications
Ariba
Total
7,462
1,122
2,167
2,523
13,274
0
0
0
−82
−82
7,462
1,122
2,167
2,441
13,192
Additions from business combinations
726
85
27
2
840
Foreign currency exchange differences
−105
−12
−126
−100
−344
December 31, 2013
8,083
1,195
2,067
2,343
13,688
Prior year goodwill amounts have been adjusted by €82 million relating to tax adjustments. For more information, see Note (10).
38
Notes to the Consolidated Financial Statements
Assured Goodwill Impairment Testing The key assumptions on which management based its cash flow projections for the period covered by the underlying business plans are as follows:
The key assumptions are set out below:
Key Assumptions Percent
Key Assumptions in Cash Flow Projections
On-Premise Products
On-Premise Services
Key assumption
2013
2012
2013
2012
11.6
11.5
11.7
10.7
3.0
2.9
0.9
2.1
Basis for determining values assigned to key assumption
Budgeted revenue Revenue growth rate achieved in the current fiscal year, increased for an expected increase in SAP’s addressable growth cloud, mobility, and database markets; expected growth in the established categories of applications and analytics. Values assigned reflect our past experience and our expectations regarding an increase in the addressable market. Operating margin budgeted for a given budget period Budgeted operating margin equals the operating margin achieved in the current fiscal year, increased for expected efficiency improvements. Values assigned reflect past experience, except for efficiency improvements.
Pre-tax discount rates
Terminal growth rate
Our estimated cash flow projections are discounted to present value by means of the pre-tax discount rates. Pre-tax discount rates are based on the weighted average cost of capital (WACC) approach. The WACC takes into account both debt and equity and reflects specific risks relating to the relevant segment by applying individual beta factors. Our estimated cash flow projections for periods beyond the business plan were extrapolated using the segmentspecific terminal growth rates. These growth rates do not exceed the long-term average growth rates for the markets in which our segments operate.
On-Premise Products and On-Premise Services The recoverable amounts of the On-Premise Products and On-Premise Services segments have been determined based on value-in-use calculations. The calculations use cash flow projections based on actual operating results and a Companywide three-year business plan approved by management.
Notes to the Consolidated Financial Statements
Pre-tax discount rates Terminal growth rate
We believe that any reasonably possible change in any of the above key assumptions would not cause the carrying amount of our On-Premise Product segment or our On-Premise Services segment to exceed their respective recoverable amounts. Even an increase in discount rate of up to five percentage points (pp) or a reduction of estimated cash flows of up to 30% would not result in any additional impairment requirement for our On-Premise Product segment or On-Premise Services segments. Cloud Applications and Ariba The recoverable amounts of the Cloud Application and Ariba segments have been determined based upon fair values less costs of disposal. The fair value measurement was categorized as a level 3 fair value based on the inputs used in the valuation technique. The cash flow projections are based on actual operating results and specific estimates covering a 12-year period. The projected results were determined based on management’s estimates and are consistent with the assumptions that a market participant would make. Both segments operate in a relatively immature area with significant growth rates projected for the near future. They therefore require a longer detailed planning period relative to mature segments.
39
Assured The key assumptions (that a market participant would make) are set out below:
for a period longer than five years, we believe that the most appropriate valuation technique for both segments should be based upon fair value less cost of disposals in the current year.
Key Assumptions
The following table shows amounts by which the key assumptions would need to change individually for the recoverable amount to be equal to the carrying amount:
Percent Cloud Applications
Ariba
2013
2013
Budgeted revenue growth (average of the budgeted period)
14.5
14.5
Cloud Applications
Ariba
Pre-tax discount rates
13.6
14.2
2013
2013
3.5
3.5 Budgeted revenue growth (average of the budgeted period)
–1.7 pp
–0.5 pp
Pre-tax discount rates
+1.4 pp
+0.4 pp
Terminal growth rate
–2.7 pp
–0.6 pp
Terminal growth rate
We are using a target operating margin of 36% and 34%, respectively, for the Cloud Applications segment and the Ariba segment at the end of budgeted period as a key assumption, which is within the range of expectations of market participants (for example, industry analysts). The recoverable amounts for the Cloud Applications segment and the Ariba segment exceed the carrying amounts by €608 million (2012: €281 million) and €153 million (2012: €0 million) respectively.
Sensitivity to Change in Assumptions
The recoverable amount for the Cloud Applications segment would equal the carrying amount if an operating margin of only 27% were achieved from 2022, and the recoverable amount for the Ariba segment would equal the carrying amount if an operating margin of only 31% were achieved from 2024.
In the prior year, for the Cloud Applications segment, a valuein-use calculation was used based on an eight-year business plan with budgeted revenue growth rates in a range of 14% to 51% (with higher growth rates expected in the earlier years). The pre-tax discount rate applied was 13.1% and the terminal growth rate was 3.4%. The recoverable amount for the Ariba segment was estimated using the market approach in the prior year, which represented the best estimate of fair value because of the close proximity of the transaction date to year-end. Given available market data supporting revenue and operating margin growth rates exceeding terminal value growth rates
40
Notes to the Consolidated Financial Statements
Assured (16) Property, Plant, and Equipment
Property, Plant, and Equipment € millions Land and Buildings
Other Property, Plant, and Equipment
Advance Payments and Construction in Progress
Total
Historical cost January 1, 2012
1,360
1,551
7
2,918
Foreign currency exchange differences
−12
−16
−1
−29
Additions from business combinations
13
22
1
36
Other additions
55
397
20
472
−44
−236
−5
−285
1
3
−4
0
1,373
1,721
18
3,112
Foreign currency exchange differences
−34
−48
−3
−85
Additions from business combinations
1
7
0
8
65
430
50
545
−15
−201
−6
−222
12
3
−15
0
1,402
1,912
44
3,358
1,367
Retirements/disposals Transfers December 31, 2012
Other additions Retirements/disposals Transfers December 31, 2013 Accumulated depreciation January 1, 2012
460
907
0
Foreign currency exchange differences
−5
−12
0
−17
Additions depreciation
56
243
0
299
Retirements/disposals
−42
−203
0
−245
December 31, 2012
469
935
0
1,404
Foreign currency exchange differences
−15
−31
0
−46
Additions depreciation
59
289
0
348
Retirements/disposals
−14
−154
0
−168
December 31, 2013
499
1,039
0
1,538
Carrying value December 31, 2012
904
786
18
1,708
December 31, 2013
903
873
44
1,820
The additions and disposals in other property, plant, and equipment relate primarily to the replacement and purchase of computer hardware and vehicles acquired in the normal course of business.
Notes to the Consolidated Financial Statements
41
Assured (17) Trade and Other Payables, Financial Liabilities, and Other Non-Financial Liabilities
(17a) Trade and Other Payables Trade and other payables as at December 31 were as follows:
Trade and Other Payables € millions 2013
2012
Current
Non-Current
Total
Current
Non-Current
Total
640
0
640
684
0
684
80
0
80
81
0
81
Miscellaneous other liabilities
130
45
175
105
63
168
Trade and other payables
850
45
895
870
63
933
Miscellaneous other liabilities include mainly deferral amounts for free rent periods and liabilities related to government grants.
(17b) Financial Liabilities Financial liabilities as at December 31 were as follows:
Trade payables Advance payments received
Financial Liabilities € millions 2013 Nominal volume Current Non-Current Bonds
Carrying amount Current Non-Current
Total
2012 Nominal volume Current Non-Current
Carrying amount Current Non-Current
Total
500
1,800
500
1,791
2,291
600
2,300
600
2,287
2,887
86
1,922
86
1,891
1,977
0
2,094
0
2,088
2,088
Financial Debt
586
3,722
586
3,682
4,268
600
4,394
600
4,375
4,975
Other financial liabilities
NA
NA
162
76
238
NA
NA
202
71
273
748
3,758
4,506
802
4,446
5,248
Private placement transactions
Financial liabilities
Financial liabilities are unsecured, except for the retention of title and similar rights customary in our industry. Effective interest rates on our financial debt (including the effects from interest rate swaps) were 2.48% in 2013, 2.87% in 2012, and 2.98% in 2011.
42
Notes to the Consolidated Financial Statements
Assured For an analysis of the contractual cash flows of our financial liabilities based on maturity, see Note (24). For information on the risk associated with our financial liabilities, see Note (25). For information on fair values, see Note (26). Bonds As at December 31, we had outstanding bonds with the following terms:
Bonds Maturity
Issue Price
Coupon Rate
Effective Interest Rate
Nominal Volume (in € millions)
Balance on 12/31/2013 (in € millions)
Balance on 12/31/2012 (in € millions)
Eurobond 1 – 2010
2014
99.755%
2.50% (fix)
2.64%
500
500
499
Eurobond 2 – 2010
2017
99.780%
3.50% (fix)
3.58%
500
499
498
Eurobond 4 – 2010
2013
99.857%
2.25% (fix)
2.38%
600
0
600
Eurobond 5 – 2012
2015
99.791%
1.00% (fix)
1.17%
550
547
547
Eurobond 6 – 2012
2019
99.307%
2.125% (fix)
2.27%
750
Bonds
745
743
2,291
2,887
In September 2012, we arranged a debt issuance program with an initial renewable term of 12 months. The program enables us to issue bonds in a number of tranches in different currencies up to a volume of €2.4 billion. In November 2012, we issued bonds under the program as shown in the table above. In September 2013, our debt issuance program was extended by 12 months and the volume was increased to €4 billion, all of which is available for new bond issuances. All our Eurobonds are listed for trading on the Luxembourg Stock Exchange.
Notes to the Consolidated Financial Statements
43
Assured Private Placement Transactions Our private placement transactions have the following terms:
Private Placements Maturity
Coupon Rate
Effective Interest Rate
Nominal Volume (in respective currency in millions)
Balance on 12/31/2013 (in € millions)
Balance on 12/31/2012 (in € millions)
2014
4.92% (fix)
4.98%
€86
86
86
German promissory note Tranche 3 – 2009 U.S. private placements Tranche 1 – 2010
2015
2.34% (fix)
2.40%
US$300
216
227
Tranche 2 – 2010
2017
2.95% (fix)
3.03%
US$200
145
151
Tranche 3 – 2011
2016
2.77% (fix)
2.82%
US$600
434
454
Tranche 4 – 2011
2018
3.43% (fix)
3.50%
US$150
108
113
Tranche 5 – 2012
2017
2.13% (fix)
2.16%
US$242.5
175
183
Tranche 6 – 2012
2020
2.82% (fix)
2.86%
US$290
206
219
Tranche 7 – 2012
2022
3.18% (fix)
3.22%
US$444.5
313
336
Tranche 8 – 2012
2024
3.33% (fix)
3.37%
US$323
225
244
Tranche 9 – 2012
2027
3.53% (fix)
3.57%
US$100
Private placements
The U.S. private placement notes were issued by one of our subsidiaries that has the U.S. dollar as its functional currency.
69
75
1,977
2,088
Other Financial Liabilities Our other financial liabilities mainly comprise derivative liabilities and liabilities for accrued interest. (17c) Other Non-Financial Liabilities Other non-financial liabilities as at December 31 were as follows:
Other Non-Financial Liabilities € millions 2013
Other employee-related liabilities Other taxes Other non-financial liabilities
44
2012
Current
Non-Current
Total
Current
Non-Current
Total
1,775
112
1,887
1,768
98
1,866
488
0
488
436
0
436
2,263
112
2,375
2,204
98
2,302
Notes to the Consolidated Financial Statements
Assured Other employee-related liabilities mainly relate to vacation accruals, bonus and sales commission accruals, as well as employee-related social security obligations.
Other taxes comprise mainly payroll tax liabilities and value-added tax liabilities. (18) Provisions Provisions as at December 31 were as follows:
Provisions € millions 2013
2012
Current
Non-Current
Total
Current
Non-Current
2
62
64
3
69
72
Other provisions (see Note (18b))
643
215
858
840
278
1,118
Total
645
277
922
843
347
1,190
(18a) Pension Plans and Similar Obligations We maintain several defined benefit and defined contribution pension plans for our employees in Germany and at foreign subsidiaries, which provide for old age, disability, and survivors’ benefits. The measurement dates for the domestic and f oreign benefit plans are December 31. Individual benefit plans have also been established for members of our Executive Board. Furthermore, in certain countries we provide termination indemnity benefits to employees regardless of the cause for termination. These types of benefits are typically defined by law in these foreign countries.
defined contribution plans under IFRS and consequently, the pension liabilities and the respective insurance policies are included in domestic plan assets and plan liabilities respectively.
Pension plans and similar obligations (see Note (18a))
Our domestic defined benefit pension plans provide participants with pension benefits that are based on the length of service and compensation of employees.
Total
Foreign defined benefit pension plans provide participants with pension benefits that are based on compensation levels, age, and length of service. The pension plan in Switzerland accounted for €189 million of defined benefit obligation and €194 million of the plan assets. This plan consists of three benefits namely retirement benefits, disability benefits and spouse pension. These obligations are based on salary and age of the employees. Both employer and employee make contributions to the plan. Statutory minimum funding obligations exist.
There is also a domestic employee-financed pension plan which SAP funds through the purchase of qualifying insurance policies and where SAP guarantees a minimum return on investment which is equivalent to the return guaranteed by the insurer. Even though the risk that SAP would be liable for a return that cannot be met by the insurance company is very remote, these employee-financed plans do not qualify as
Notes to the Consolidated Financial Statements
45
Assured The following table shows the present value of the nature of the benefits provided by the defined benefit obligations:
Nature of the Benefits € millions Domestic Plans
Foreign Plans
Other PostEmployment Plans
Total
2013
2013
2013
2013
14
2
0
16
0
5
25
30
Present value of defined benefit obligation Benefits based on final salary Annuity Lump sum Benefits not based on final salary Annuity Lump sum Total
46
40
189
1
230
574
35
8
617
628
231
34
893
Notes to the Consolidated Financial Statements
Assured The following table shows the change in present values of the defined benefit obligations (DBOs) and the fair value of the plan assets with a reconciliation of the funded status to net amounts:
Change in the Present Value of the DBO and the Fair Value of the Plan Assets € millions Domestic Plans
Foreign Plans
Other PostEmployment Plans
Total
2013
2012
2013
2012
2013
2012
2013
2012
597
462
220
453
32
23
850
938
7
−2
15
15
3
3
25
16
19
21
4
8
1
1
24
30
Change in benefit obligation Benefit obligation at beginning of year Current service cost Interest expense Employee contributions Remeasurements loss (+)/gain (–) Benefits paid
28
26
5
5
0
0
33
31
−17
94
1
0
−1
6
−17
100 −10
−5
−5
−4
−3
−1
−2
−10
Acquisitions/divestitures
0
0
1
0
2
1
3
1
Curtailments/settlements
0
0
0
−257
0
0
0
−257
Past service cost
0
0
1
0
0
0
1
0
Foreign currency exchange rate changes
0
0
−12
−1
−2
0
−14
−1
Benefit obligation at year-end Thereof fully or partially funded plans Thereof unfunded plans
628
597
231
220
34
32
893
850
628
597
196
180
20
19
844
796
0
0
35
40
14
13
49
54
589
461
181
387
9
6
779
854
20
22
4
7
1
1
25
30
1
1
14
31
4
4
19
36
Change in plan assets Fair value of plan assets at beginning of year Interest income Employer contributions Employee contributions
28
26
5
5
0
0
33
31
Benefits paid
−5
−5
−4
−3
−1
−1
−10
−9
Acquisitions/divestitures
0
0
1
0
0
0
1
0
Curtailments/settlements
0
0
0
−257
0
0
0
−257
−10
84
5
8
0
0
−5
92
0
0
−3
3
−2
0
−5
3
623
589
201
181
11
9
835
779
Remeasurements loss (–)/gain (+) Foreign currency exchange rate changes Fair value of plan assets at year-end
(continued)
Notes to the Consolidated Financial Statements
47
Assured Change in the Present Value of the DBO and the Fair Value of the Plan Assets (continued) € millions Domestic Plans
Foreign Plans
Other PostEmployment Plans
Total
2013
2012
2013
2012
2013
2012
2013
2012
8
1
39
66
23
17
70
84 16
Reconciliation of net defined benefit liability (asset) Net defined benefit liability (asset) at beginning of year
7
−2
15
15
3
3
25
Interest expense (income)
Current service cost
−1
−1
0
1
0
0
−1
0
Employer contributions
−1
−1
−14
−31
−4
−4
−19
−36
Employee contributions Remeasurements loss (+)/gain (–)
0
0
0
0
0
0
0
0
−7
10
−4
−8
−1
6
−12
8 −1
Benefits paid
0
0
0
0
0
−1
0
Acquisitions/divestitures
0
0
0
0
2
1
2
1
Past service cost
0
0
1
0
0
0
1
0
Foreign currency exchange rate changes
0
0
−9
−4
0
0
−9
−4
Net defined benefit liability (asset) at year-end
5
8
30
39
23
23
58
71
Amounts recognized in the Consolidated Statement of Financial Position: Non-current pension assets
0
0
6
1
0
0
6
1
Accrued benefit liability (current)
0
0
−2
−3
0
0
−2
−3
Accrued benefit liability (non-current)
−5
−8
−34
−37
−23
−23
−62
−69
Total
−5
−8
−30
−39
−23
−23
−58
−71
48
Notes to the Consolidated Financial Statements
Assured The following weighted average assumptions were used for the actuarial valuation of our domestic and foreign pension liabilities as well as other post-employment benefit obligations as at the respective measurement date:
Actuarial Assumptions for Defined Benefit Liabilities Percent Domestic Plans
Foreign Plans
Other Post-Employment Plans
2013
2012
2011
2013
2012
2011
2013
2012
2011
Discount rate
3.6
3.3
4.6
2.1
1.9
3.2
5.2
4.8
5.5
Future salary increases
2.5
2.5
2.5
1.7
1.8
0.8
4.7
4.2
3.9
Future pension increases
2.0
2.0
2.0
0.0
0.0
0.0
0.0
0.0
0.0
Employee turnover
2.0
2.0
2.0
9.9
9.5
4.2
2.5
2.3
2.3
Inflation
0.0
0.0
0.0
1.3
1.3
0.5
1.1
1.1
1.2
The assumed discount rates are derived from rates available on high-quality corporate bonds and government bonds for which the timing and amounts of payments match the timing and the amounts of our projected pension payments.
The sensitivity analysis table shows how the present value of all defined benefit obligations would have been influenced by reasonable possible changes to above actuarial assumptions. The sensitivity analysis table presented below considers change in one actuarial assumption at a time, holding all other actuarial assumptions constant.
Sensitivity Analysis € millions Domestic Plans
Foreign Plans
Other PostEmployment Plans
Total
2013
2013
2013
2013
Present value of all defined benefit obligations if: Discount rate was 50 basis points higher
585
217
32
834
Discount rate was 50 basis points lower
675
246
36
957
Expected rate of future salary increases was 50 basis points higher
628
233
36
897
Expected rate of future salary increases was 50 basis points lower
628
228
32
888
Expected rate of future pension increases was 50 basis points higher
632
236
34
902
Expected rate of future pension increases was 50 basis points lower
625
226
34
885
Expected inflation was 50 basis points higher
628
233
36
897
Expected inflation was 50 basis points lower
628
229
32
889
Notes to the Consolidated Financial Statements
49
Assured The components of total expense of defined benefit pension plans for the years 2013, 2012, and 2011 recognized in operating expense were as follows:
Total Expense of Defined Benefit Pension Plans € millions Domestic Plans
Current service cost Interest expense Interest income
Foreign Plans
Other Post-Employment Plans
Total
2013
2012
2011
2013
2012
2011
2013
2012
2011
2013
2012
2011 20
7
−2
−1
15
15
18
3
3
3
25
16
19
21
20
4
8
13
1
1
1
24
30
34
−20
−22
−21
−4
−7
−12
−1
−1
0
−25
−30
−33
Past service cost
0
0
0
1
0
−2
0
0
0
1
0
−2
Total expense
6
−3
−2
16
16
17
4
3
4
26
16
19
10
106
28
9
15
5
1
1
0
20
122
33
Actual return on plan assets
Due to the fact that our domestic defined benefit pension plans primarily consist of an employee-financed post-retirement plan that is fully financed with qualifying insurance policies, current service cost may turn into a credit as a result of adjusting the defined benefit liability’s carrying amount to the fair value of the qualifying plan assets. Such adjustments are recorded in service cost.
50
Notes to the Consolidated Financial Statements
Assured We have recognized the following amounts as remeasurements for our defined benefit pension plans:
Remeasurements on Defined Benefit Pension Plans € millions Domestic Plans
Foreign Plans
Other Post-Employment Plans
Total
2013
2012
2011
2013
2012
2011
2013
2012
2011
2013
2012
2011
10
0
−4
−12
101
87
5
0
0
3
101
83
0
0
0
3
0
5
0
0
0
3
0
5
−28
106
14
−6
5
5
0
0
0
−34
111
19
11
−12
−3
6
−5
−9
0
5
0
17
−12
−12
10
−84
−7
−5
−3
12
0
0
0
5
−87
5
Settlement
0
0
0
0
−110
0
0
0
0
0
−110
0
Foreign currency exchange rate changes
0
0
0
−2
0
0
−1
0
0
−3
0
0
Ending balance of remeasurements on defined benefit plans (gains (–) and losses (+))
2
10
0
−17
−12
101
3
5
0
−12
3
101
Beginning balance of remeasurements on defined benefit plans (gains (–) and losses (+)) Remeasurements on defined benefit obligations: Actuarial gains (–) and losses (+) arising from change in demographic assumptions Actuarial gains (–) and losses (+) arising from change in financial assumptions Actuarial gains (–) and losses (+) arising from experience adjustments Remeasurements on plan assets: Actuarial gains (–) and losses (+) arising from experience adjustments
Notes to the Consolidated Financial Statements
51
Assured For the determination of the total expense for the years 2013, 2012, and 2011, the projection of the defined benefit obligation and the fair value of the plan assets as at December 31, 2013, 2012, and 2011, the following principal actuarial assumptions (expressed as weighted averages for our foreign and postemployment benefit plans) were used:
Actuarial Assumptions for Total Expense Percent Domestic Plans
Foreign Plans
Other Post-Employment Plans
2013
2012
2011
2013
2012
2011
2013
2012
2011
Discount rate
3.3
4.6
4.9
2.0
2.2
3.3
4.8
5.6
5.8
Future salary increases
2.5
2.5
2.5
1.7
1.8
1.3
4.2
3.9
3.4
Future pension increases
2.0
2.0
2.0
0.0
0.0
0.0
0.0
0.0
0.0
Employee turnover
2.0
2.0
2.0
9.8
10.2
4.2
2.0
1.9
2.0
Inflation
0.0
0.0
0.0
1.3
1.3
0.5
1.1
1.1
1.2
Our investment strategy on domestic benefit plans is to invest all contributions in stable insurance policies. Our investment strategies for foreign benefit plans vary according to the conditions in the country in which the respective benefit plans are situated. Generally, a long-term investment horizon has been adopted for all major foreign benefit plans. Although our policy is to invest in a riskdiversified portfolio consisting of a mix of assets, both the defined benefit obligation and plan assets can fluctuate overtime which exposes the Group to actuarial and market (investment) risks. Depending on the statutory requirements in each country, it might be necessary to reduce the
52
underfunding by addition of liquid assets. To minimize these actuarial and market fluctuations, SAP reviews relevant financial factors for appropriateness and reasonableness and makes modifications to eliminate certain effects when considered necessary.
Notes to the Consolidated Financial Statements
Assured Our plan asset allocation as at December 31, 2013, and December 31, 2012, was as follows:
Plan Asset Allocation € millions 2013
2012
Quoted in an Active Market
Not Quoted in an Active Market
Quoted in an Active Market
Not Quoted in an Active Market
Equity investments
48
0
42
0
Corporate bonds
65
0
63
0
Real estate
33
0
29
0
9
623
8
589
Cash and cash equivalents
34
0
31
0
Others
23
0
17
0
212
623
190
589
Asset category
Insurance policies
Total
Our expected contribution in 2014 is €1 million for domestic defined benefit pension plans and €15 million for foreign defined benefit pension plans, all of which is expected to be paid in cash. The weighted duration of our defined benefit plans amounted to 15 years as at December 31, 2013, and 14 years as at December 31, 2012. The table below presents the maturity analysis of the benefit payments:
Maturity Analysis € millions Domestic Plans
Foreign Plans
Other PostEmployment Plans
2013
2013
2013
Less than a year
8
20
1
Between 1 – 2 years
9
36
2
Between 2 – 5 years
58
53
5
989
205
64
1,064
314
72
Over 5 years Total
Notes to the Consolidated Financial Statements
53
Assured Defined Contribution Plan/State Plans We also maintain domestic and foreign defined contribution plans. Amounts contributed by us under such plans are based on a percentage of the employees’ salaries or the amount of contributions made by employees. Furthermore, in Germany and some other countries we make contributions to public pension plans that are operated by national or local government or a similar institution. The expenses of defined contribution plans and state plans for the years 2013, 2012, and 2011, were as follows:
Total Expense of Defined Contribution Plans and State Plans € millions 2013
2012
2011
Defined contribution plans
182
173
151
State plans
316
296
244
Total expense
498
469
395
(18b) Other Provisions Changes in other provisions over the reporting year were as follows:
Other Provisions € millions Additions from business combinations
Utilization
293
0
58
0
74
83
0
234
0
0
55
6
1
Restructuring provisions
12
74
0
Onerous contract provisions (other than from customer contracts)
53
3
0
Balance 1/1/2013
Addition
579 87
Release
Currency Impact
Balance 12/31/2013
−360
−54
−13
445
−80
−11
−2
52
−83
−36
−2
36
−1
0
−10
223
−11
−36
−3
12
−49
−4
0
33
−22
0
−1
33
Employee-related provisions Provisions for share-based payments Other employee-related provisions Customer-related provisions Litigation-related provisions TomorrowNow litigation Other litigation-related provisions
Other provisions Total other provisions
24
6
0
−3
−1
−2
24
1,118
523
1
−609
−142
−33
858
Thereof current
840
643
Thereof non-current
278
215
For more information about our share-based payments, see Note (27).
54
Other employee-related provisions primarily comprise obligations for time credits, severance payments, jubilee expenses, and semiretirement. While most of these employee-related provisions can be claimed within the next 12 months, we do not expect the related cash flows within this time period.
Notes to the Consolidated Financial Statements
Assured Customer-related provisions include performance obligations, as well as expected contract losses from contracts with customers. The associated cash outflows are substantially short-term in nature. Litigation-related provisions relate primarily to the litigation matters described in Note (23). They include the expenses related to the provision established for the related litigation as well as any related legal fees incurred to date and expected to be incurred in the future. We have established provisions taking into account the facts of each case. The timing of the cash outflows associated with legal claims cannot be reasonably determined in all cases. For more information, see Note (3c). Restructuring provisions comprise various restructuring activities that occurred in 2013 and 2012. During 2012 and 2013, we implemented organizational changes in sales and go-to-market in EMEA and North America. We made other changes to integrate Sybase employees into our global finance and administration organization and to integrate the business activities of Crossgate. In line with our new cloud integration strategy, we set up a plan to cover all cloudbusiness related organizational changes. The cash outflows for these restructuring programs are typically short-term in nature.
(19) Deferred Income Deferred income consists mainly of prepayments made by our customers for support services, cloud subscriptions, and professional services; fees from multiple element arrangements allocated to undelivered elements; and amounts recorded in purchase accounting at fair value for obligations to perform under acquired support contracts in connection with acquisitions. On December 31, 2013, current deferred income included a total of €443 million in deferred revenue (December 31, 2012: €317 million), which in future will be recognized as revenue from cloud subscriptions and support. (20) Total Equity Issued Capital As at December 31, 2013, SAP AG had issued 1,228,504,232 no-par value bearer shares (December 31, 2012: 1,228,504,232) with a calculated nominal value of €1 per share. All the shares issued are fully paid.
Non-customer contract-related onerous contract provisions have been recorded in connection with unused lease space and unfavorable acquired facility lease terms. The utilization of onerous leases depends on the terms of the underlying lease contract. Other provisions comprise warranty obligations and decommissioning, restoration, and similar liabilities associated with leased facilities. The related outflow for warranty obligations is short-term in nature. The associated cash outflows for decommissioning, restoration, and similar liabilities, which are typically long-term in nature, are generally expected to occur at the dates we exit the facilities to which they relate.
Notes to the Consolidated Financial Statements
55
Assured The following table shows the changes in the number and the value of issued shares and treasury shares in millions.
Change in Issued Capital and Treasury Shares Number of Shares in Millions
Value in € Millions
Issued Capital
Treasury Shares
Issued Capital
Treasury Shares
1,227
−39
1,227
−1,382
Issuing shares under share-based payments
1
0
1
0
Purchase of treasury shares
0
−6
0
−246
January 1, 2011
Reissuance of treasury shares under share-based payments December 31, 2011
0
7
0
251
1,228
−38
1,228
−1,377
Issuing shares under share-based payments
1
0
1
0
Purchase of treasury shares
0
−1
0
−53
Reissuance of treasury shares under share-based payments December 31, 2012 Reissuance of treasury shares under share-based payments December 31, 2013
Authorized Shares The Articles of Incorporation authorize the Executive Board to increase the issued capital: – �Up to a total amount of €250 million by issuing new no-par value bearer shares against contributions in cash until June 7, 2015 (Authorized Capital I). The issuance is subject to the statutory subscription rights of existing shareholders. – �Up to a total amount of €250 million by issuing new no-par value bearer shares against contributions in cash or in kind until June 7, 2015 (Authorized Capital II). Subject to the consent of the Supervisory Board, the Executive Board is authorized to exclude the shareholders’ statutory subscription rights in certain cases. – �Up to a total amount of approximately €30 million by issuing new no-par value bearer shares against contributions in cash or in kind until June 7, 2015 (Authorized Capital III). The new shares may only be used to grant shares to employees of SAP AG and its subsidiaries (employee shares). The shareholders’ subscription rights are excluded.
56
0
2
0
93
1,229
−37
1,229
−1,337
0
2
0
57
1,229
−35
1,229
−1,280
Contingent Shares SAP AG’s share capital is subject to a contingent capital increase which may be effected only to the extent that the holders or creditors of convertible bonds or stock options issued or guaranteed by SAP AG or any of its directly or indirectly controlled subsidiaries under certain share-based payments exercise their conversion or subscription rights, and no other methods for servicing these rights are used. As at December 31, 2013, €100 million, representing 100 million shares, was still available for issuance (2012: €100 million). Share Premium Share premium represents all capital contributed to SAP with the proceeds resulting from the issuance of issued capital in excess of their calculated par value. Share premium arises mainly from issuance of issued capital, treasury shares transactions, and share-based payments. Retained Earnings Retained earnings contain prior years’ undistributed profit after tax and unrecognized pension costs. Unrecognized pension costs comprise remeasurements relating to defined benefit pension plans and similar obligations.
Notes to the Consolidated Financial Statements
Assured Other Comprehensive Income The component of other comprehensive income before tax that will be reclassified to profit or loss in the future includes the following items:
Items Recognized in Other Comprehensive Income that will be Reclassified to Profit or Loss Before Tax € millions
Gains (losses) on exchange differences Gains (losses) on remeasuring available-for-sale financial assets Reclassification adjustments on available-for-sale financial assets
2013
2012
2011
−576
−214
106
79
33
−6
−19
−20
−1
Available-for-sale financial assets
60
13
−7
Gains (losses) on cash flow hedges
78
21
−23
Reclassification adjustments on cash flow hedges Cash flow hedges
Treasury Shares By resolution of SAP AG’s General Meeting of Shareholders held on June 4, 2013, the authorization granted by the General Meeting of Shareholders of June 8, 2010, regarding the acquisition of treasury shares was revoked to the extent it had not been exercised at that time, and replaced by a new authorization of the Executive Board of SAP AG to acquire, on or before June 3, 2018, shares of SAP AG representing a pro rata amount of capital stock of up to €120 million in aggregate, provided that the shares purchased under the authorization, together with any other shares in the Company previously acquired and held by, or attributable to, SAP AG do not account for more than 10% of SAP AG’s issued share capital. Although treasury shares are legally considered outstanding, there are no dividend or voting rights associated with shares held in treasury. We may redeem or resell shares held in treasury, or we may use treasury shares for the purpose of servicing option or conversion rights under the Company’s share-based payment plans. Also, we may use shares held in treasury as consideration in connection with mergers with, or acquisitions of, other companies.
Notes to the Consolidated Financial Statements
−78
42
22
0
63
−1
Miscellaneous Under the German Stock Corporation Act (Aktiengesetz), the total amount of dividends available for distribution to SAP AG’s shareholders is based on the profits of SAP AG as reported in its statutory financial statements, which are prepared under the accounting rules in the German Commercial Code (Handelsgesetzbuch). For the year ended December 31, 2013, the Executive Board of SAP AG intends to propose a dividend of €1.00 per share (that is, an estimated total dividend of €1,194 million), to be paid from the profits of SAP AG. Dividends per share for 2012 and 2011 were €0.85 and €1.10 respectively and were paid in the succeeding year. (21) Additional Capital Disclosures Capital Structure Management The primary objective of our capital structure management is to maintain a strong financial profile for investor, creditor, and customer confidence, and to support the growth of our business. We seek to maintain a capital structure that will allow us to cover our funding requirements through the capital markets at reasonable conditions, and in so doing, ensure a high level of independence, confidence, and financial flexibility.
57
Assured Based on our strong corporate financial profile and our excellent capital market reputation, we have so far successfully executed external financing transactions without an external rating. However, we will continue to closely monitor our financing situation to determine whether not having an external rating continues to be appropriate.
Capital Structure 2013
Equity Current liabilities Non-current liabilities
2012
Change (in %)
€ millions
% of Total equity and liabilities
€ millions
% of Total equity and liabilities
16,048
59
14,133
54
14
6,347
23
6,546
25
−3
4,699
17
5,627
21
−16
Liabilities
11,046
41
12,173
46
−9
Total equity and liabilities
27,094
100
26,306
100
3
Our financing activities improved our debt ratio (defined as the ratio of total liabilities to total equity and liabilities, expressed as a percentage) to 41% at the end of 2013 (as compared to 46% at the end of 2012). The ratio of total financial debt to total equity and liabilities decreased by 3% to 16% at the end of 2013 (19% as at December 31, 2012). Total financial debt consists of current and non-current bonds or private placements. For more information about our financial debt, see Note (17).
Looking ahead to financing activities in 2014, the Company intends to repay a €500 million Eurobond and an €86 million German promissory note when they both mature in April. While we monitor these ratios continuously, our main focus is on the management of our net liquidity position as outlined in the following table:
Group Liquidity of SAP Group € millions
Cash and cash equivalents Current investments Group liquidity Current financial debt Net liquidity 1 Non-current financial debt Net liquidity 2
58
2013
2012
Change
2,748
2,477
271
93
15
78
2,841
2,492
349
586
600
−14
2,255
1,892
363
3,722
4,394
−672
−1,467
−2,502
1,035
Notes to the Consolidated Financial Statements
Assured Net liquidity 1 is group liquidity minus current financial debt. In 2013 we paid back a €600 million Eurobond, which was almost fully compensated by reclassifications of €586 million from non-current financial debt to current financial debt due to changes in the respective maturity profile. Net liquidity 2 is net liquidity 1 minus non-current financial debt. Improvements of our net liquidity ratios since December 31, 2012 are mainly due to positive cash inflows from our operations, which were partly offset by cash outflows for acquisitions (such as hybris) and dividend payments. We intend to reduce our financial debt as and when the debt falls due. We will consider issuing new debt, such as bonds or U.S. private placements, on an as-needed basis only and if market conditions are advantageous. Distribution Policy Our general intention is to remain in a position to return excess liquidity to our shareholders by distributing annual dividends and repurchasing shares. The amount of future dividends and the extent of future repurchases of shares will be balanced with our effort to continue to maintain an adequate liquidity position. In 2013, we were able to distribute €1,013 million in dividends from our 2012 profit (as compared to €1,310 million in 2012 and €713 million in 2011 related to 2011 and 2010 profit, respectively), representing €0.85 per share. Aside from the distributed dividend, in 2013, 2012, and 2011 we also returned €0 million, €53 million, and €246 million respectively to our shareholders by repurchasing our own shares.
Notes to the Consolidated Financial Statements
As a result of our equity-settled share-based payments transactions (as described in Note (27)) we have commitments to grant SAP shares to employees. We intend to meet these commitments by reissuing treasury shares or issuing ordinary shares. For more information about contingent capital, see Note (20). (22) Other Financial Commitments and Contingent Liabilities Other Financial Commitments Our other financial commitments as at December 31, 2013, and 2012, were as follows:
Other Financial Commitments € millions 2013
2012
1,204
923
80
66
Other purchase obligations
424
522
Purchase obligations
504
588
1,708
1,511
Operating leases Contractual obligations for acquisition of property, plant, and equipment and intangible assets
Total
Our operating leases relate primarily to the lease of office space, hardware, and cars, with remaining non-cancelable lease terms between less than one and 35 years. On a limited scale, the operating lease contracts include escalation clauses (based, for example, on the consumer price index) and renewal options. The contractual obligations for acquisition of property, plant, and equipment and intangible assets relate primarily to the construction of new and existing facilities, hardware, software, patents, office equipment, and vehicle purchase obligations. The remaining obligations relate mainly to marketing, consulting, maintenance, license agreements, and other third-party agreements. Historically, the majority of such purchase obligations have been realized.
59
Assured Commitments under operating leasing contracts and purchase obligations as at December 31, 2013, were as follows:
Other Financial Commitments € millions Operating Leases
Purchase Obligations
Due 2014
235
282
Due 2015–2018
561
186
Due thereafter
408
36
1,204
504
Total
Our rental and operating lease expenses were €273 million, €277 million, and €241 million for the years 2013, 2012, and 2011, respectively. Contingent Liabilities In the normal course of business, we usually indemnify our customers against liabilities arising from a claim that our software products infringe a third party’s patent, copyright, trade secret, or other proprietary rights. In addition, we occasionally grant function or performance guarantees in routine consulting contracts or development arrangements. Also, our software license agreements generally include a clause guaranteeing that the software substantially conforms to the specifications as described in applicable documentation for a period of six to 12 months from delivery. Our product and service warranty liability, which is measured based on historical experience and evaluation, is included in other provisions (see Note (18b)). For contingent liabilities related to litigation matters, see Note (23).
60
(23) Litigation and Claims We are subject to a variety of claims and lawsuits that arise from time to time in the ordinary course of our business, including proceedings and claims that relate to companies we have acquired, claims that relate to customers demanding indemnification for proceedings initiated against them based on their use of SAP software, and claims that relate to customers’ being dissatisfied with the products and services that we have delivered to them. We will continue to vigorously defend against all claims and lawsuits against us. We record a provision for such matters when it is probable that we have a present obligation that results from a past event, is reliably estimable, and the settlement of which is probable to require an outflow of resources embodying economic benefits. For the TomorrowNow litigation, we have recorded a provision of US$306 million (US$306 million on December 31, 2012, US$272 million on December 31, 2011, US$1.3 billion on December 31, 2010). We currently believe that resolving all other claims and lawsuits against us, individually or in the aggregate, did not and will not have a material adverse effect on our business, financial position, profit, or cash flows. Consequently, the provisions currently recorded for these other claims and lawsuits are neither individually nor in aggregate material to SAP. However, the outcome of litigation and other claims or lawsuits is intrinsically subject to considerable uncertainty. Management’s view of the litigation may also change in the future. Actual outcomes of litigation and other claims or lawsuits may differ from the assessments made by management in prior periods, which could result in a material impact on our business, financial position, profit, cash flows, or reputation. Most of the litigations and claims are of a very individual nature and claims are either not quantified by the claimants or claim amounts quantified are, based on historical evidence, not expected to be a good proxy for the expenditure that would be required to settle the case concerned. The specifics of the jurisdictions where most of the claims are located further impair the
Notes to the Consolidated Financial Statements
Assured predictability of the outcome of the cases. Therefore, it is not practicable to reliably estimate the financial effect that these litigations and claims would have if SAP were to incur expenditure for these cases. For more information about the provisions recorded for litigation, see Note (18b). Among the claims and lawsuits are the following: Intellectual Property Litigation In March 2007, United States-based Oracle Corporation and certain of its subsidiaries (Oracle) instituted legal proceedings in the United States against TomorrowNow, Inc., its parent company SAP America, Inc. and SAP America’s parent company SAP AG (SAP). Oracle filed several amended complaints between 2007 and 2009. As amended, the lawsuit alleges copyright infringement, violations of the Federal Computer Fraud and Abuse Act and the California Computer Data Access and Fraud Act, unfair competition, intentional and negligent interference with prospective economic advantage, and civil conspiracy. The lawsuit alleges that SAP unlawfully copied and misappropriated proprietary, copyrighted software products and other confidential materials developed by Oracle to service its own customers. The lawsuit sought injunctive relief and monetary damages, including punitive damages, alleged by Oracle to be in the billions of U.S. dollars. The trial was held in November 2010. Prior to trial, SAP AG, SAP America and TomorrowNow stipulated to liability for certain claims and SAP agreed to pay Oracle US$120 million for attorneys’ fees. After the trial, the jury returned a damages verdict of US$1.3 billion. The judgment, which was issued on February 3, 2011, additionally provided for prejudgment interest of US$15 million. The judgment amount is also subject to post-judgment interest, which accrues from the time judgment is entered.
Notes to the Consolidated Financial Statements
The jury based its verdict on the theory of a hypothetical license, that is, the value of what TomorrowNow would have paid if it had negotiated with Oracle a license for the copyrights infringed by TomorrowNow. Before and during the course of the trial, various damages amounts had been presented by the parties to the litigation. They included the following: a) �Before the trial, Oracle had requested damages in excess of US$3.5 billion based on alleged “saved acquisition costs,” the court dismissed that damage claim based on a pretrial motion, but Oracle has the right to appeal that dismissal. b) �During the trial, Oracle’s damages experts presented an amount of US$408 million based on lost profits and disgorgement of infringer’s profit. c) D � uring the trial, members of Oracle management presented, as part of their testimonies, amounts of up to US$5 billion. Oracle’s damages expert presented a damages estimate of “at least” US$1.655 billion under a hypothetical license theory. Oracle’s counsel asked the jury to award “somewhere between US$1.65 and US$3 billion.” d) �During the trial, the damages expert for TomorrowNow and SAP presented an amount of US$28 million based on lost profits and infringer’s profits or, alternatively, US$40.6 million based on a hypothetical license theory. Counsel for SAP and TomorrowNow asked the jury to award US$28 million. We believed both before and during the trial and continue to believe that the hypothetical license theory is not an appropriate basis for calculating the damages. Instead, we believe that damages should be based on lost profits and infringer’s profits. As such, SAP filed post-trial motions asking the judge to overturn the judgment. A hearing on the post-trial motions was held in July 2011. On September 1, 2011, the trial judge issued an order which set aside the jury verdict and vacated that part of the judgment awarding US$1.3 billion in damages. The trial judge also gave Oracle the choice of accepting reduced damages of US$272 million or having a new trial based on lost profits and infringer's profits. Oracle filed a motion seeking an early appeal from the ruling vacating the jury's damages award,
61
Assured which was denied by the judge. Consequently, Oracle elected to proceed with a new trial. In lieu of a new trial, the parties stipulated to a judgment of US$306 million while each preserving all rights for appeal. Both parties have filed their respective notice of appeal. On appeal, Oracle is seeking three forms of relief: (1) reinstatement of the November 2010 US$1.3 billion verdict; (2) as a first alternative, a new trial at which Oracle may again seek hypothetical license damages (based in part on evidence of alleged saved development costs) plus SAP's alleged infringer's profits without any deduction of expenses (Oracle does not put a number on its claim for the requested new trial); and (3) as a second alternative, increase of the remittitur (alternative to new trial) to US$408.7 million (versus the US$272 million Oracle had previously rejected). SAP has dismissed its cross-appeal. The hearing is tentatively scheduled for May 13, 2014, though this is subject to change.
The retrial was held in May 2011. The jury returned a verdict in favor of Versata and awarded Versata US$345 million for past damages. In September 2011, the judge denied SAP’s posttrial motions with the exception of reducing the damages verdict by US$16 million to approximately US$329 million. The judge also ordered approximately US$60 million in pre-judgment interest. Additionally, the judge granted Versata’s request for a broad injunction which prohibits SAP from 1) selling products in the United States with the infringing functionality, 2) providing maintenance to or accepting maintenance revenue from existing customers in the United States until such customers disable the infringing functionality and verify such disablement, and 3) licensing additional users to existing customers in the United States until such customers disable the infringing functionality and verify such disablement. Finally, the judge stayed the injunction pending the outcome of an appeal.
Additionally, in June 2007, SAP became aware that the United States Department of Justice (U.S. DOJ) had opened an investigation concerning related issues and had issued subpoenas to SAP and TomorrowNow. The DOJ investigation has been resolved by way of a plea agreement which includes TomorrowNow pleading guilty to 11 counts of violations of the Computer Fraud and Abuse Act, one count of criminal copyright infringement, the payment of a US$20 million fine and three years’ probation. No charges were brought against SAP AG or subsidiaries thereof other than TomorrowNow.
Both parties appealed to the U.S. Court of Appeals for the Federal Circuit. The appeal hearing occurred in February 2013 and a decision was issued on May 1, 2013. The three-judge panel ruled in Versata’s favor on infringement and damages, leaving both fully intact. The past damages verdict currently stands at approximately US$390 million. Regarding the injunction, the court ruled that the injunction was too broad, stating that SAP should be able to provide maintenance or additional seats for prior customers of the infringing products, so long as the maintenance or the additional seat does not involve, or allow access to, the “enjoined capability” where enjoined capability is defined as the capability to execute a pricing procedure using hierarchical access of customer and product data. SAP filed a petition seeking rehearing by the three-judge panel that issued this decision and/or by the entire appeals court. The appeals court requested that Versata respond to SAP’s petition no later than July 29, 2013. In August 2013, the appeals court denied SAP’s request for rehearing and issued its mandate passing jurisdiction to the district court.
In April 2007, United States-based Versata Software, Inc. (formerly Trilogy Software, Inc.) (Versata) instituted legal proceedings in the United States District Court for the Eastern District of Texas against SAP. Versata alleged that SAP’s products infringe one or more of the claims in each of five patents held by Versata. In its complaint, Versata sought unspecified monetary damages and permanent injunctive relief. The first trial was held in August 2009. The jury returned a verdict in favor of Versata and awarded Versata US$138.6 million for past damages. In January 2011, the court vacated the jury’s damages award and ordered a new trial on damages.
62
Notes to the Consolidated Financial Statements
Assured Separately, SAP filed a petition with the United States Patent and Trademark Office (USPTO) challenging the validity of the asserted Versata patent. In January 2013, the USPTO granted SAP’s request to reconsider the validity of Versata’s patent and instituted the relevant procedure (transitional post grant review). A decision was issued in June 2013 rendering all challenged patent claims (including all the patent claims SAP was found to have infringed) unpatentable. Versata filed with the USPTO a request seeking reconsideration of the decision on six different grounds. The USPTO invited SAP to file an opposition responding to two of the six grounds. On September 13, 2013, the USPTO denied Versata’s request for reconsideration. In June 2013, following the determination of unpatentability, SAP filed a request with the appeals court to stay the litigation pending review of the USPTO decision. That request was denied in early July 2013. In December 2013, SAP filed with the United States Supreme Court a petition for a writ of certiorari to review the decisions of the appeals court. That petition was denied in January 2014. Immediately thereafter, Versata requested that the District Court dismiss its remaining claims for injunctive and equitable relief. The District Court granted that request and deemed the previously entered judgment final. On that same day, SAP requested that the District Court vacate the judgment or stay the litigation, based on the USPTO decision declaring Versata’s patent claims unpatentable. That request is pending. In August 2007, United States-based elcommerce.com, Inc. (elcommerce) instituted legal proceedings in the United States against SAP. elcommerce alleged that SAP’s products infringe one or more of the claims in one patent held by elcommerce. In its complaint, elcommerce sought unspecified monetary damages and permanent injunctive relief. The court in East Texas granted SAP’s request to transfer the litigation from East Texas to Pennsylvania. Subsequent to the Markman ruling by the court, the parties agreed to the entry of final judgment regarding non-infringement by SAP. elcommerce has appealed the court’s Markman ruling. The hearing for the appeal was
Notes to the Consolidated Financial Statements
held in May 2012, and we are awaiting the court’s decision. SAP also filed a reexamination request with the USPTO to invalidate elcommerce’s patent. On September 23, 2013, the USPTO issued a decision invalidating the patent. elcommerce has sought rehearing from the USPTO. In February 2010, United States-based TecSec, Inc. (TecSec) instituted legal proceedings in the United States against SAP, Sybase, IBM, and many other defendants. TecSec alleged that SAP’s products infringe one or more of the claims in five patents held by TecSec. In its complaint, TecSec seeks unspecified monetary damages and permanent injunctive relief. The trial has not yet been scheduled. The legal proceedings have been stayed against all defendants pending the outcome of an appeal by TecSec. The appeal hearing occurred in March 2013. The appellate court issued its decision in October 2013. That decision did not end the litigation and therefore we expect the lawsuit to resume at the district court in the coming months. In April 2010, SAP instituted legal proceedings (a Declaratory Judgment action) in the United States against Wellogix, Inc. and Wellogix Technology Licensing, LLC (Wellogix). The lawsuit seeks a declaratory judgment that five patents owned by Wellogix are invalid and/or not infringed by SAP. The trial has not yet been scheduled. The legal proceedings have been stayed pending the outcome of six reexaminations filed with the USPTO. In September 2013, the USPTO issued a decision on four of the six reexaminations, invalidating every claim of each of the four patents. SAP is awaiting a decision on the two remaining reexamination requests. Other Litigation In April 2008, South African-based Systems Applications Consultants (PTY) Limited (Securinfo) instituted legal proceedings in South Africa against SAP. Securinfo alleges that
63
Assured SAP has caused one of its subsidiaries to breach a software distribution agreement with Securinfo. In its complaint, Securinfo seeks damages of approximately €610 million plus interest. In September 2009, SAP filed a motion to dismiss which was rejected. A trial date which was scheduled for June 2011 has been postponed. In November 2012, SAP filed a motion to dismiss based on a procedural aspect of the case. The court followed SAP’s argument and dismissed the claim by Securinfo. Securinfo appealed against this decision on December 19, 2012. In March 2013, the court dismissed Securinfo’s appeal. Securinfo appealed against this decision to the Supreme Court of South Africa. The Supreme Court granted leave to appeal to the full bench of the court which had originally dismissed Securinfo’s appeals. Securinfo has applied for an appeal hearing date. The court has not yet provided a date. We are subject to ongoing audits by domestic and foreign tax authorities. Along with many other companies operating in Brazil, we are involved in various proceedings with Brazilian authorities regarding assessments and litigation matters on non-income taxes on intercompany royalty payments and intercompany services. The total potential amount related to these matters for all applicable years is approximately €76 million. We have not recorded a provision for these matters, as we believe that we will prevail on these matters. For more information about income tax risk-related litigation, see Note (10). (24) Financial Risk Factors We are exposed to various financial risks, such as market risks (including foreign currency exchange rate risk, interest rate risk, and equity price risk), credit risk, and liquidity risk.
64
Market Risk a) Foreign Currency Exchange Rate Risk Foreign currency exchange rate risk is the risk of loss due to adverse changes in foreign currency exchange rates. Under IFRS, foreign currency exchange rate risks arise on account of monetary financial instruments denominated in currencies other than the functional currency where the non-functional currency is the respective risk variable; translation risks are not taken into consideration. As a globally active enterprise, we are subject to risks associated with fluctuations in foreign currencies with regard to our ordinary operations. Since the Group’s entities mainly conduct their operating business in their own functional currencies, our risk of exchange rate fluctuations from ongoing ordinary operations is not considered significant. However, occasionally we generate foreign currency-denominated receivables, payables, and other monetary items by transacting in a currency other than the functional currency. To mitigate the extent of the associated foreign currency exchange rate risk, the majority of these transactions are hedged as described in Note (25). In rare circumstances, transacting in a currency other than the functional currency also leads to embedded foreign currency derivatives being separated and measured at fair value through profit or loss. In addition, the Intellectual Property (IP) holders in the SAP Group are exposed to risks associated with forecasted intercompany cash flows in foreign currencies. These cash flows arise out of royalty payments from subsidiaries to the respective IP holder. The royalties are linked to the subsidiaries’ external revenue. This arrangement leads to a concentration of the foreign currency exchange rate risk with the IP holders, as the royalties are mostly denominated in the subsidiaries’ local currencies, while the functional currency of the IP holders with the highest royalty volume is the euro. The highest foreign currency exchange rate exposure of this kind relates to the currencies of subsidiaries with significant operations, for example the U.S. dollar, the pound sterling, the Japanese yen, the Swiss franc, and the Australian dollar.
Notes to the Consolidated Financial Statements
Assured Generally, we are not exposed to any significant foreign currency exchange rate risk with regard to our investing and financing activities, as such activities are normally conducted in the functional currency of the investing or borrowing entity. However, we were exposed to a cash flow risk from the consideration to be paid in U.S. dollars for the acquisition of hybris in 2013 and of SuccessFactors and Ariba, Inc. in 2012 as the funds were provided through our free cash and acquisition term loans, both mostly generated in euros. For more information, see Note (25). b) Interest Rate Risk Interest rate risks result from changes in market interest rates, which can cause changes in the fair values of fixed rate instruments and in the interest to be paid or received for variable rate instruments. We are exposed to interest rate risk as a result of our investing and financing activities mainly in euros and U.S. dollars. As at December 31, 2013, our liquidity was mainly invested in time deposits and bonds with fixed yields, and money market instruments with variable yields, held as cash equivalents and current and non-current investments. Since the fixed yield time deposits held at year-end have short maturities, they do not expose us to a substantial fair value interest rate risk. However, a fair value interest rate exposure arises from the bonds classified as available for sale. Also, we are exposed to a cash flow risk from our cash held at banks spread across the world and the variable yield money market funds, mainly held in the United States. As at December 31, 2013, we were exposed to an interest rate risk from our financing activities (for more information about the individual instruments, see Note (17b)) as all our issued bonds, the U.S. private placement notes, and the remaining tranche of the German promissory notes pay fixed interest leading to a fair value risk.
Notes to the Consolidated Financial Statements
c) Equity Price Risk Equity price risk is the risk of loss due to adverse changes in equity markets. We are exposed to such risk with regard to our investments in listed equity securities (2013: €83 million; 2012: €52 million) and our share-based payments (for the exposure from these plans, see Note (27)). Credit Risk Credit risk is the risk of economic loss of principal or financial rewards stemming from a counterparty’s failure to repay or service debt according to the contractual obligations. To reduce the credit risk in investments, we arranged to receive rights to collateral for certain investing activities in the full amount of the investment volume, which we would be allowed to make use of only in the case of default of the counterparty to the investment. With the exception of these transactions, we have not executed significant agreements to reduce our overall credit risk exposure, such as master netting arrangements. Therefore, the total amounts recognized as cash and cash equivalents, current investments, loans and other financial receivables, and derivative financial assets represent our maximum exposure to credit risks, except for the agreements mentioned above. Liquidity Risk Liquidity risk results from the potential inability to meet financial obligations, such as payments to suppliers or employees. A maturity analysis that provides the remaining contractual maturities of all our financial liabilities held at December 31, 2013, is shown in the table below. Financial liabilities shown in the table below for which repayment can be requested by the contract partner at any time are assigned to the earliest possible period. Variable interest payments were calculated using the last relevant interest rate fixed as at December 31, 2013. As we settle our derivative contracts gross, we show the pay and receive legs separately for all our
65
Assured currency and interest rate derivatives, whether or not the fair value of the derivative is negative. The cash outflows for the currency derivatives are translated using the applicable forward rate.
The cash flows for unrecognized but contractually agreed financial commitments are shown in Note (22).
Contractual Maturities of Financial Liabilities and Financial Assets € millions Carrying Amount
Contractual Cash Flows
12/31/2013
2014
2015
2016
2017
2018 Thereafter
Non-derivative financial liabilities Trade payables
−640
−640
0
0
0
0
0
Financial liabilities
−4,336
−731
−863
−513
−891
−153
−1,730
Total of non-derivative financial liabilities
−4,976
−1,371
−863
−513
−891
−153
−1,730
−1,975
−9
−9
−8
−8
−15
1,885
0
0
0
0
0
−178
0
0
0
0
0
174
0
0
0
0
0
−12
−17
−27
−39
−37
−192
30
35
35
35
28
123
−76
9
−1
−12
−17
−84
−2,544
0
0
0
0
0
2,569
0
0
0
0
0
−391
0
0
0
0
0
419
0
0
0
0
0
−12
−25
−29
−36
−21
−24
19
33
33
33
16
16
61
60
8
4
−3
−5
−8
−109
−16
17
3
−15
−22
−92
Derivative financial liabilities and assets Derivative financial liabilities Currency derivatives without designated hedge relationship
−144
Cash outflows Cash inflows Currency derivatives with designated hedge relationship
−3
Cash outflows Cash inflows Interest rate derivatives with designated hedge relationship
−23
Cash outflows Cash inflows Total of derivative financial liabilities
−170
Derivative financial assets Currency derivatives without designated hedge relationship
26
Cash outflows Cash inflows Currency derivatives with designated hedge relationship
30
Cash outflows Cash inflows Interest rate derivatives with designated hedge relationship
5
Cash outflows Cash inflows Total of derivative financial assets Total of derivative financial liabilities and assets
66
Notes to the Consolidated Financial Statements
Assured Contractual Maturities of Financial Liabilities and Financial Assets € millions Carrying Amount
Contractual Cash Flows
12/31/2012
2013
2014
2015
2016
2017 Thereafter
Non-derivative financial liabilities Trade payables
−684
−684
0
0
0
0
0
Financial liabilities
−5,051
−757
−705
−874
−534
−904
−1,922
Total of non-derivative financial liabilities
−5,735
−1,441
−705
−874
−534
−904
−1,922
−2,996
−10
−10
−10
−9
−26
2,875
0
0
0
0
0
−157
0
0
0
0
0
154
0
0
0
0
0
Cash outflows
0
0
0
0
0
0
Cash inflows
0
0
0
0
0
0
−124
−10
−10
−10
−9
−26
−2,690
0
0
0
0
0
2,735
0
0
0
0
0
−460
0
0
0
0
0
485
0
0
0
0
0
Cash outflows
0
0
0
0
0
0
Cash inflows
0
0
0
0
0
0
75
70
0
0
0
0
0
−122
−54
−10
−10
−10
−9
−26
Derivative financial liabilities and assets Derivative financial liabilities Currency derivatives without designated hedge relationship
−195
Cash outflows Cash inflows Currency derivatives with designated hedge relationship
−2
Cash outflows Cash inflows Interest rate derivatives with designated hedge relationship
Total of derivative financial liabilities
0
−197
Derivative financial assets Currency derivatives without designated hedge relationship
46
Cash outflows Cash inflows Currency derivatives with designated hedge relationship
29
Cash outflows Cash inflows Interest rate derivatives with designated hedge relationship
Total of derivative financial assets Total of derivative financial liabilities and assets
0
The change in our non-derivative financial liabilities which is due to scheduled repayments will lead to an overall decrease in cash outflows compared to the end of 2012. For more information, see Note (17b).
Notes to the Consolidated Financial Statements
67
Assured (25) Financial Risk Management We manage market risks (including foreign currency exchange rate risk, interest rate risk, and equity price risk), credit risk, and liquidity risk on a Group-wide basis through our global treasury department. Our risk management and hedging strategy is set by our treasury guideline and other internal guidelines, and is subject to continuous internal risk analysis. Derivative financial instruments are only purchased to reduce risks and not for speculation, which is defined as entering into derivative instruments without a corresponding underlying transaction. In the following sections we provide details on the management of each respective financial risk and our related risk exposure. In the sensitivity analyses that show the effects of hypothetical changes of relevant risk variables on profit or other comprehensive income, we determine the periodic effects by relating the hypothetical changes in the risk variables to the balance of financial instruments at the reporting date. Foreign Currency Exchange Rate Risk Management We continually monitor our exposure to currency fluctuation risks based on monetary items and forecasted transactions and pursue a Group-wide strategy to manage foreign currency exchange rate risk, using derivative financial instruments, primarily foreign exchange forward contracts, as appropriate, with the primary aim of reducing profit or loss volatility. Currency Hedges Without Designated Hedge Relationship The foreign exchange forward contracts we enter into to offset exposure relating to foreign currency denominated monetary assets and liabilities are not designated as being in a hedge accounting relationship, because the realized currency gains and losses from the underlying items are recognized in profit or loss in the same periods as the gains and losses from the derivatives.
68
Currency hedges without a designated hedge relationship also include foreign currency derivatives embedded in nonderivative host contracts that are separated and accounted for as derivatives according to the requirements of IAS 39. In addition, during 2012 we held foreign currency options and deal-contingent forward contracts to partially hedge the cash flow risk from the consideration paid in U.S. dollars for the acquisitions of SuccessFactors and Ariba. Currency Hedges with Designated Hedge Relationship (Cash Flow Hedges) We enter into derivative financial instruments, primarily foreign exchange forward contracts, to hedge significant forecasted cash flows (royalties) from foreign subsidiaries denominated in foreign currencies with a defined set of hedge ratios and a hedge horizon of up to 12 months. Specifically, we exclude the interest component and only designate the spot rate of the foreign exchange forward contracts as the hedging instrument to offset anticipated cash flows relating to the subsidiaries with significant operations, including the United States, the United Kingdom, Japan, Switzerland, and Australia. We generally use foreign exchange derivatives that have maturities of 12 months or less, which may be rolled over to provide continuous coverage until the applicable royalties are received. In 2013, net gains totaling €57 million (2012: net gains of €17 million; 2011: net losses of €14 million) resulting from the change in the component of the derivatives designated as hedging instruments were recorded in other comprehensive income. For the years ended December 31, 2013 and 2012, no previously highly probable transaction designated as a hedged item in a foreign currency cash flow hedge relationship ceased to be probable. Therefore, we did not discontinue any of our cash flow hedge relationships. Also, we identified no ineffectiveness in all years reported. In 2013, we reclassified net gains of €57 million (2012: net losses of €24 million; 2011: net losses of €13 million) from other comprehensive income to profit or loss due to the hedged items affecting income. Generally, the cash flows of the hedged forecasted transactions are expected to occur
Notes to the Consolidated Financial Statements
Assured and to be recognized in profit or loss monthly within a time frame of 12 months from the date of the statement of financial position. It is estimated that €20 million of the net gains recognized in other comprehensive income in 2013, will be reclassified from other comprehensive income to profit or loss during fiscal year 2014. Foreign Currency Exchange Rate Exposure In line with our internal risk reporting process, we use the cash flow-at-risk method to quantify our risk positions with regard to our forecasted intercompany transactions and value-at-risk for our foreign currency denominated financial instruments. In order not to provide two different methodologies, we have opted to disclose our risk exposure based on a sensitivity analysis considering the following: – �Since the SAP Group’s entities generally operate in their functional currencies, the majority of our non-derivative monetary financial instruments, such as cash and cash equivalents, trade receivables, trade payables, loans to employees and third parties, bank liabilities, and other financial liabilities, are denominated in the respective entities’ functional currency. Thus, a foreign currency exchange rate risk in these transactions is nearly non-existent. In exceptional cases and limited economic environments, operating and financing transactions are denominated in currencies other than the functional currency, leading to a foreign currency exchange rate risk for the related monetary instruments. Where we hedge against currency impacts on cash flows, these foreign currency-denominated financial instruments are economically converted into the functional currency by the use of forward exchange contracts or options. Therefore, fluctuations in foreign currency exchange rates neither have a significant impact on profit nor on other comprehensive income with regard to our non-derivative monetary financial instruments. – �Income or expenses recorded in connection with the nonderivative monetary financial instruments discussed above are mainly recognized in the relevant entity’s functional currency. Therefore, fluctuations in foreign currency exchange rates neither have a significant impact on profit nor on other comprehensive income in this regard.
Notes to the Consolidated Financial Statements
– �Our free-standing derivatives designed for hedging foreigncurrency exchange rate risks almost completely balance the changes in the fair values of the hedged item attributable to exchange rate movements in the Consolidated Income Statements in the same period. As a consequence, the hedged items and the hedging instruments are not exposed to foreign currency exchange rate risks, and thereby have no effect on profit. Consequently, we are only exposed to significant foreign currency exchange rate fluctuations with regard to: – �Derivatives held within a designated cash flow hedge relationship (excluding the interest element, which is not part of the assigned cash flow hedge relationships) – �Foreign currency embedded derivatives – �The foreign currency options held as at December 31, 2011, in connection with the acquisition of SuccessFactors. Where we do not have a significant exposure towards a single currency, we disclose our sensitivity to our major foreign currencies (as described in Note (24)) in total.
69
Assured Foreign Currency Sensitivity € millions Effects on Other Non-Operating Expense, Net 2013
2012
2011
Effects on Other Comprehensive Income 2013
2012
2011
Derivatives held within a designated cash flow hedge relationship All major currencies –10%
57
60
70
All major currencies +10%
−57
−60
–70
Embedded derivatives Swiss franc –10%
32
38
41
Swiss franc +10%
−32
–38
–41
other currencies –10%
3
3
0
other currencies +10%
−3
–3
0
U.S. dollar –10%
0
0
6
U.S. dollar +10%
0
0
–50
Freestanding foreign currency options related to SuccessFactors acquisition
Our foreign currency exposure as at December 31 (and if year-end exposure is not representative, also our average/ high/low exposure) was as follows:
Foreign Currency Exposure € billions 2013
2012
Year-end exposure towards all our major currencies
0.9
1.0
Average exposure
1.0
2.4
Highest exposure
1.1
3.7
Lowest exposure
0.9
1.0
During 2013, our sensitivity to foreign currency exchange rate fluctuations remained fairly stable compared to the year ended December 31, 2012.
70
Interest Rate Risk Management The aim of our interest rate risk management is to reduce profit or loss volatility and optimize our interest result by creating a balanced structure of fixed and variable cash flows. We therefore manage interest rate risks by adding interest rate-related derivative instruments to a given portfolio of investments and debt financing. As at December 31, 2013, a cash flow interest rate risk existed with regard to our cash at banks of €1.2 billion and our investing activities in money market instruments with variable yields in the amount of €487 million. A fair value interest rate risk arises from the fixed yield bonds classified as available-forsale and accounted for at fair value as well as the fixed rate financing transactions held at amortized cost. 100% (2012: 100%) of our total interest-bearing financial liabilities outstanding as at December 31, 2013, had a fixed interest rate whereas 40% (2012: 29%) of our interest-bearing cash, cash equivalents, time deposits, and available-for-sale financial assets had a fixed interest rate.
Notes to the Consolidated Financial Statements
Assured Derivatives with Designated Hedge Relationship (Fair Value Hedges) The majority of our investments are based on variable rates and/or short maturities while all our financing transactions are based on fixed rates and long maturities. To match the interestrate risk from our financing transactions to our investments we use receiver interest rate swaps to convert certain of our fixed rate financial liabilities to floating and by this means secure the fair value of the swapped financing transactions. The desired fix-floating mix of our net debt is set by the Treasury Committee. Interest rate swaps included, 44% (2012: 100%) of our total interest-bearing financial liabilities outstanding as at December 31, 2013, had a fixed interest rate. None of the fair value adjustment from the receiver swaps, the basis adjustment on the underlying hedged items held in fair value hedge relationships, and the difference between the two recognized in Financial Income, net is material in any of the years presented. Interest Rate Exposure A sensitivity analysis is provided to show the impact of our interest rate risk exposure on profit or loss and equity in accordance with IFRS 7, considering the following: – �Changes in interest rates only affect the accounting for nonderivative fixed rate financial instruments if they are recognized at fair value. Therefore, such interest rate changes do not change the carrying amounts of our non-derivative financial liabilities as we account for them at amortized cost. On December 31 of each year-end reported, we had fixed rate bonds classified as available-for-sale as described in Note (24). We therefore consider interest rate changes relating to the fair value measurement of such fixed rate non-derivative financial assets classified as available-for-sale in the equityrelated sensitivity calculation. – �Income or expenses recorded in connection with nonderivative financial instruments with variable interest rates are subject to interest rate risk if they are not hedged items in an effective hedge relationship. Thus, we take into consideration interest rate changes relating to our variablerate financing and our investments in money market instruments in the profit-related sensitivity calculation.
Notes to the Consolidated Financial Statements
– �Due to the designation of interest rate payer swaps in a cash flow hedge relationship, the interest rate changes affect the respective amounts recorded in other comprehensive income. The movements related to the interest rate swaps’ variable leg were not reflected in the sensitivity calculation, as they offset the variable interest rate payments for the German private placement (SSD). We therefore only considered interest rate sensitivity in discounting the interest rate swaps’ fixed leg cash flows in the equity-related sensitivity calculation. – �The designation of interest rate receiver swaps in a fair value hedge relationship leads to interest rate changes affecting Financial Income, net. The fair value movements related to the interest rate swaps are not reflected in the sensitivity calculation, as they offset the fixed interest rate payments for the bonds and private placements as hedged items. However, changes in market interest rates affect the amount of interest payments from the interest rate swap. As a consequence, they are included in the in the profit-related sensitivity calculation. Due to the current low interest rate level we base our sensitivity analyses on a yield curve shift of +100/–20 basis points to avoid negative interest rates. If, on December 31, 2013, 2012, and 2011, interest rates had been 100 basis points higher (20 basis points lower), this would not have had a material effect on the following: – �The gains/losses on available-for-sale financial assets in other comprehensive income – �Financial income, net for our variable interest rate investments and financial debt – �The effective portion of the interest rate cash flow hedge in other comprehensive income – �The variable interest payments from the receiver swaps.
71
Assured Our interest rate exposure as at December 31 (and if year-end exposure is not representative, also our average/high/low exposure) was as follows:
Interest rate risk exposure € billions 2013
2012
Year-End
Average
High
Low
Year-End
Average
High
Low
0.04
0.06
0.13
0.04
0.03
0.10
0.30
0 1.80
Fair value interest rate risk From investments Cash flow interest rate risk From investments (incl. cash) From financing From interest rate swaps
1.73
2.23
2.71
1.73
1.80
2.41
3.03
0
0.31
1.00
0
0
1.10
3.20
0
2.39
0.60
2.40
0
0
0
0
0
Equity Price Risk Management Our investments in equity instruments with quoted market prices in active markets (2013: €83 million; 2012: €52 million) are monitored based on the current market value that is affected by the fluctuations in the volatile stock markets worldwide. An assumed 20% increase (decrease) in equity prices as at December 31, 2013 (2012), would not have a material impact on the value of our investments in marketable equity securities and the corresponding entries in other comprehensive income. We are exposed to equity price risk with regard to our sharebased payments. In order to reduce resulting profit or loss volatility, we hedge certain cash flow exposures associated with these plans through the purchase of derivative instruments, but do not establish a designated hedge relationship. In our sensitivity analysis we include the underlying share-based payments and the hedging instruments. Thus, we base the calculation on our net exposure to equity prices as we believe taking only the derivative instrument into account would not properly reflect our equity price risk exposure. An assumed 20% increase (decrease) in equity prices as at December 31,
72
2013, would have increased (decreased) our share-based payment expenses by €126 million (€90 million) (2012: increased by €139 million (decreased by €117 million); 2011: increased by €27 million (decreased by €25 million)). Credit Risk Management To mitigate the credit risk from our investing activities and derivative financial assets, we conduct all our activities only with approved major financial institutions and issuers that carry high external ratings, as required by our internal treasury guideline. Among its stipulations, the guideline requires that we invest only in assets from issuers with a minimum rating of at least BBB. We only make investments in issuers with a lower rating in exceptional cases. Such investments were not material in 2013. The weighted average rating of our financial assets is in the range A to A–. We pursue a policy of cautious investments characterized by predominantly current investments, standard investment instruments, as well as a wide portfolio diversification by doing business with a variety of counterparties.
Notes to the Consolidated Financial Statements
Assured To further reduce our credit risk, we require collateral for certain investments in the full amount of the investment volume which we would be allowed to make use of in the case of default of the counterparty to the investment. As such collateral, we only accept bonds of non-financial corporations with at least investment grade rating level. In addition, the concentration of credit risk that exists when counterparties are involved in similar activities by instrument, sector, or geographic area is further mitigated by diversification of counterparties throughout the world and adherence to an internal limit system for each counterparty. This internal limit system stipulates that the business volume with individual counterparties is restricted to a defined limit, which depends on the lowest official long-term credit rating available by at least one of the major rating agencies, the Tier 1 capital of the respective financial institution, or participation in the German Depositors’ Guarantee Fund or similar protection schemes. We continuously monitor strict compliance with these counterparty limits. As the premium for credit default swaps mainly depends on market participants’ assessments of the creditworthiness of a debtor, we also closely observe the development of credit default swap spreads in the market to evaluate probable risk developments to timely react to changes if these should manifest. The default risk of our trade receivables is managed separately, mainly based on assessing the creditworthiness of customers through external ratings and our historical experience with respective customers. Outstanding receivables are continuously monitored locally. Credit risks are accounted for through individual and portfolio allowances. For more information, see Note (3). The impact of default on our trade receivables from individual customers is mitigated by our large customer base and its distribution across many different industries, company sizes, and countries worldwide. For more information about our trade receivables, see Note (13). For information about the maximum exposure to credit risk, see Note (24).
Notes to the Consolidated Financial Statements
Liquidity Risk Management Our liquidity is managed by our global treasury department with the primary aim of maintaining liquidity at a level that is adequate to meet our financial obligations. Our primary source of liquidity is funds generated from our business operations, which have historically been the primary source of the liquid funds needed to maintain our investing and financing strategy. The majority of our subsidiaries pool their cash surplus to our global treasury department, which then arranges to fund other subsidiaries’ requirements or invest any net surplus in the market, seeking to optimize yields, while ensuring liquidity, by investing only with counterparties and issuers of high credit quality, as explained above. Hence, high levels of liquid assets and marketable securities provide a strategic reserve, helping keep SAP flexible, sound, and independent. Apart from effective working capital and cash management, we have reduced the liquidity risk inherent in managing our dayto-day operations and meeting our financing responsibilities by arranging an adequate volume of available credit facilities with various financial institutions on which we can draw if necessary. In order to retain high financial flexibility, on November 13, 2013, SAP AG entered into a €2.0 billion syndicated credit facility agreement with an initial term of five years ending in December 2018, effectively replacing the €1.5 billion credit facility from 2010. The use of the facility is not restricted by any financial covenants. Borrowings under the facility bear interest of EURIBOR or LIBOR for the respective currency plus a margin of 22.5 basis points. We are also required to pay a commitment fee of 7.88 basis points per annum on the unused available credit. We have never drawn on the facility. Additionally, as at December 31, 2013, and 2012, SAP AG had available lines of credit totaling €487 million and €489 million, respectively. As at December 31, 2013, and 2012, there were no borrowings outstanding under these lines of credit. As at December 31, 2013, and 2012, certain subsidiaries had lines of credit available that allowed them to borrow in local currencies at prevailing interest rates up to €36 million and €48 million,
73
Assured respectively. There were no borrowings outstanding under these credit facilities from any of our foreign subsidiaries as at December 31, 2013, and 2012.
Fair Values of Financial Instruments € millions
(26) Additional Fair Value Disclosures on Financial Instruments Fair Value of Financial Instruments We use various types of financial instruments in the ordinary course of business which are grouped into the following categories: loans and receivables (L&R), available-for-sale (AFS), held-for-trading (HFT), and amortized cost (AC). The table below shows the carrying amounts and fair values of financial assets and liabilities by category of financial instrument as well as by category of IAS 39. Where financial assets and liabilities are shown as measured at fair value this is done on a recurring basis. Since the line items trade receivables, trade payables, and other financial assets contain both financial and non-financial assets or liabilities (such as other taxes or advance payments), the non-financial assets or liabilities are shown in the column headed “Not in Scope of IFRS 7” to allow a reconciliation to the corresponding line items in the Consolidated Statements of Financial Position. The carrying amounts and fair values of our financial instruments as at December 31 were as follows:
Category Assets Cash and cash equivalents
L&R
Trade receivables
L&R
Other financial assets Debt investments
L&R/AFS
Equity investments
AFS/–
Other non-derivative financial assets
L&R
Derivative assets With hedging relationship
–
Without hedging relationship
HFT
Liabilities Trade payables
AC
Financial liabilities Non-derivative financial liabilities
AC
Derivatives With hedging relationship
–
Without hedging relationship
HFT
Total financial instruments, net Aggregation according to IAS 39 Financial assets At fair value through profit or loss
HFT
Available-for-sale
AFS
Loans and receivables
L&R
Financial liabilities At fair value through profit or loss
HFT
At amortized cost
AC
Outside scope of IAS 39 Financial instruments related to employee benefit plans Investment in associates Derivatives with hedging relationship Total financial instruments, net
74
Notes to the Consolidated Financial Statements
Assured
2013 Book Value 12/31/2013
Measurement Categories
At Amortized Cost
At Cost
Fair Value 12/31/2013
Not in Scope of IFRS 7
2,748
2,748
3,816
3,816
147
858 38
38
322
322
36
214
119
214
Not in Scope of IFRS 7
At Fair Value
2,477
2,477
2,477
4,005
3,837
3,837 29 149
52
168
159
29 52
46
159
84
35
35
29
29
94
94
115
115
−640
−640
−255
−4,506
−933
−684
−684
−5,051
−5,228
−249
−5,248 −4,336
1,802
−4,439 −26
−26
−2
−2
−144
−144
−195
−195
0
319
2,018
28
589
94
94
115
115
115
0
360
360
230
94 360 6,778
6,778
−144 −5,231
At Cost
Fair Value 12/31/2012
663 0
6,925
Measurement Categories
At Amortized Cost
3,963
2,168
Book Value 12/31/2012
At Fair Value
2,748
−895
2012
−144 −4,976
47
147
6,641
−255
−5,984
−144 −5,079
964
738
149
149
81
6,473
81 6,473
−195
−195 −5,735
49
168
−195 −5,912
−249
119
119
84
84
36
36
46
46
47
964
9 2,168
1,802
0
9
9
319
2,018
Notes to the Consolidated Financial Statements
27 738
149
27
27
28
589
49
75
Assured Determination of Fair Values IFRS 13 defines fair value as the price that would be received to sell an asset or paid to transfer a liability in an orderly transaction between market participants on the measurement date. Accordingly, best evidence of fair value provides quoted prices in an active market. Where market prices are not readily available, valuation techniques have to be used to establish fair value. Depending on the inputs used for determining fair value and their significance for the valuation techniques, we have categorized our financial instruments at fair value into a threelevel fair value hierarchy as mandated by IFRS 13. The fair value hierarchy gives the highest priority to quoted prices in active markets for identical assets or liabilities (Level 1) and the lowest priority to unobservable inputs (Level 3). The inputs used to measure fair value for one single instrument may fall into different levels of the fair value hierarchy. In such cases, the level in the fair value hierarchy within which the fair value measurement in its entirety falls has been determined based on the lowest level input that is significant to the fair value measurement in its entirety. Our assessment of the significance of a particular input to the fair value measurement in its entirety requires judgment, and considers factors specific to the asset or liability.
76
The levels of the fair value hierarchy, its application to our financial assets and liabilities, and the respective determination of fair value are described below – differentiating between those that are measured at fair value and those that are measured at cost or amortized cost where fair value is only disclosed: – �Level 1: Quoted prices in active markets for identical assets or liabilities. – �Level 2: Inputs other than those that can be observed, either directly or indirectly, such as quoted prices in active markets for similar assets or liabilities, quoted prices for identical or similar assets or liabilities in markets that are not active, or other inputs that are observable or can be corroborated by observable market data for substantially the full term of the assets or liabilities. – �Level 3: Unobservable inputs that are supported by little or no market activity and that are significant to the fair value of the assets or liabilities. It is our policy to recognize transfers at the beginning of the period of the event or change in circumstances that caused the transfer.
Notes to the Consolidated Financial Statements
Assured Financial Instruments Measured at Fair Value on a Recurring Basis Type
Fair Value Hierarchy
Determination of Fair Value/ Valuation Technique
Significant Unobservable Inputs Interrelationship Between Significant Unobservable Inputs and Fair Value Measurement
Other financial assets Debt investments
Level 1
Quoted prices in an active market
NA
NA
Listed equity investments
Level 1
Quoted prices in an active market
NA
NA
Listed equity investments with sale Level 2 restriction
Quoted prices in an active market deducting a discount for the disposal restriction derived from the premium for a respective put option.
NA
NA
Unlisted equity investments
Level 3
Market approach. Comparable company valu- �– �Peer companies used (revenue multiples range ation using revenue multiples derived from from 2.3-8.5) companies comparable to the investee. – �Revenues of investees – �Discounts for lack of marketability (20% – 30%)
The estimated fair value would increase (decrease) if: – �the revenue multiples were higher (lower) – �the investees’ revenues were higher (lower) – �the liquidity discounts were lower (higher).
Unlisted equity investments
Level 3
Market approach. Venture capital method evaluating a variety of quantitative and qualitative factors like actual and forecasted results, cash position, recent or planned trans actions, and market comparable companies.
NA
NA
Unlisted equity investments
Level 3
Discounted cash flow.
– �Revenue growth rate (6% – 9%) – �Weighted average cost of capital (13.3%)
The estimated fair value would increase (decrease) if: – �the revenue growth was higher (lower) – �the weighted average cost of capital was lower (higher)
Unlisted equity investments
Level 3
Last financing round valuations
NA
NA
Unlisted equity investments
Level 3
Liquidation preferences
NA
NA
(continued)
Notes to the Consolidated Financial Statements
77
Assured Financial Instruments Measured at Fair Value on a Recurring Basis (continued) Type
Fair Value Hierarchy
Determination of Fair Value/ Valuation Technique
Significant Unobservable Inputs Interrelationship Between Significant Unobservable Inputs and Fair Value Measurement
Private equity funds
Level 3
Net asset value/Fair market value as reported NA by the respective funds
NA
Interest rate swaps
Level 2
Discounted cash flow. Expected future cash flows are estimated based on forward interest rates from observable yield curves and contract interest rates, discounted at a rate that reflects the credit risk of the counterparty.
NA
NA
Call options for share-based payments plans
Level 2
Monte Carlo Model. NA Calculated considering risk-free interest rates, the remaining term of the derivatives, the dividend yields, the stock price, and the volatility of our share.
NA
Level 2
Discounted cash flow using Par-Method. Expected future cash flows based on forward exchange rates are discounted over the respective remaining term of the contracts using the respective deposit interest rates and spot rates.
NA
Other financial assets (continued)
Other financial assets/ Financial liabilities Foreign exchange (FX) forward contracts
78
NA
Notes to the Consolidated Financial Statements
Assured Financial Instruments not Measured at Fair Value Type
Fair Value Hierarchy
Determination of Fair Value/ Valuation Technique
Level 1
Quoted prices in an active market
Financial liabilities Fixed rate bonds (financial liabilities)
Fixed rate private placements/ Level 2 loans (financial liabilities)
For cash and cash equivalents, trade receivable, other nonderivative financial assets/liabilities, accounts payable and variable rate financial debt it is assumed that their carrying value reasonably approximates their fair values.
Discounted cash flows. Future cash outflows for fixed interest and principal are discounted over the respective term of the contracts using the respec tive market interest rates as of the reporting date.
Notes to the Consolidated Financial Statements
79
Assured The following table allocates those financial assets and liabilities that are measured at fair value in accordance with IAS 39 either through profit or loss or other comprehensive income or for which fair value must be disclosed in accordance with IFRS 7 as at December 31, 2013, to the three levels of the fair value hierarchy according to IFRS 13.
Classification of Financial Instruments € millions 2013 Level 1
Level 2
2012
Level 3
Total
Level 1
Level 2
Level 3
Total 27
Financial assets 29
0
0
29
27
0
0
Government securities
Corporate bonds
2
0
0
2
0
0
0
0
Municipal bonds
7
0
0
7
2
0
0
2
Debt investments Software industry Equity investments
38
0
0
38
29
0
0
29
52
31
239
322
52
0
0
52
52
31
239
322
52
0
0
52
90
31
239
360
81
0
0
81
FX forward contracts
0
56
0
56
0
76
0
76
Interest rate swaps
0
5
0
5
0
0
0
0
Call options for share-based payments
0
68
0
68
0
68
0
68
Available-for-sale financial assets
Derivative financial assets
0
129
0
129
0
144
0
144
90
160
239
489
81
144
0
225
FX forward contracts
0
147
0
147
0
197
0
197
Interest rate swaps
0
23
0
23
0
0
0
0
Derivative financial liabilities
0
170
0
170
0
197
0
197
Total
0
170
0
170
0
197
0
197
Total Financial liabilities
80
Notes to the Consolidated Financial Statements
Assured Transfers between Level 1 and 2 Transfers of available-for-sale equity investments from Level 2 to Level 1 which occurred because disposal restrictions lapsed and deducting a discount for such restriction was no longer necessary were not material in all years presented, while transfers from Level 1 to Level 2 did not occur at all. Level 3 disclosures The following table shows the reconciliation from the opening to the closing balances for our Level 3 fair values:
Reconciliation of Level 3 Fair Values € millions 2013 Unlisted Equity Investments and Private Equity Funds Opening balance
0
Transfers into Level 3
162
out of Level 3
−30
Purchases Sales
79 −16
Gains/losses included in financial income, net in profit and loss
7
included in available-for-sale financial assets in other comprehensive income
46
included in exchange differences in other comprehensive income
−9
Closing balance Change in unrealized gains/losses in profit and loss for investments held at the end of the reporting period
Notes to the Consolidated Financial Statements
The transfers into and out of Level 3 relate to unlisted equity investments. Changing the unobservable inputs to reflect reasonably possible alternative assumptions would not have a material impact on the fair values of our unlisted equity investments held as available-for-sale as of the reporting date. (27) Share-Based Payments SAP has granted awards under various cash-settled and equitysettled share-based payments to its directors and employees. Most of these awards are described in detail below. SAP has other share-based payments, which are, individually and in aggregate, immaterial to our Consolidated Financial Statements. a) Cash-Settled Share-Based Payments SAP’s cash-settled share-based payments include the following programs: Employee Participation Plan (EPP) and Long-Term Incentive Plan (LTI Plan for the Global Managing Board) 2015, SOP Performance Plan 2009 (SOP PP), Stock Option Plan 2010 (SOP 2010 (2010–2013 tranches)), Restricted Stock Unit Plan 2013 (RSU 2013), acquired SFSF Rights (former SuccessFactors awards assumed in connection with the SuccessFactors acquisition in 2012), acquired Ariba Rights (former Ariba awards assumed in connection with the Ariba acquisition in 2012).
239 0
81
Assured As at December 31, 2013, the valuation of our outstanding cash-settled plans was based on the following parameters and assumptions:
Fair Value and Parameters Used at Year-End 2013 for Cash-Settled Plans
Option pricing model used Range of grant dates
LTI Plan 2015 (2012/2013 Tranche)
EPP 2015 (2013 Tranche)
RSU 2013
SOP PP
SOP 2010 (2010 – 2013 Tranche)
Other1)
Other1)
Other1)
Monte-Carlo
Monte-Carlo
NA
NA
2/7/2012
3/20/2013
1/16/2013
5/6/2009
9/9/2010
2/21/2012
10/1/2012
7/1/2013 Quantity of awards issued (in thousands)
12/16/2013
SFSF Rights
Ariba Rights
9/13/2013
661
2,087
1,559
10,321
26,341
4,534
4,091
Weighted average fair value as at December 31, 2013
€59.80
€62.31
€61.55
€0.74
€15.71
€29.00
€32.63
Weighted average intrinsic value as at December 31, 2013
€62.31
€62.31
€63.19
€0.00
€10.98
€29.00
€32.63
2.4
0.1
1.2
0.2
3.3
0.8
0.7
0.26% to 0.46%
0.01%
0.01% to 0.44%
0.02%
0.08% to 0.92%
NA
NA
NA
NA
NA
19.7%
21.3 % to 27.6%
NA
NA
Expected remaining life as at December 31, 2013 (in years) Risk-free interest rate (depending on maturity) Expected volatility SAP shares
1.67%
NA
1.65%
1.67%
1.67%
NA
NA
Share price of reference index
Expected dividend yield SAP shares
NA
NA
NA
€230.94
NA
NA
NA
Expected volatility reference index
NA
NA
NA
10.6%
NA
NA
NA
Expected dividend yield reference index
NA
NA
NA
2.15%
NA
NA
NA
Expected correlation SAP share/ reference index
NA
NA
NA
17.4%
NA
NA
NA
1)
�For these awards the fair value is calculated by subtracting the net present value of expected future dividend payments, if any, until maturity of the respective award from the prevailing share price as of the valuation date.
82
Notes to the Consolidated Financial Statements
Assured As at December 31, 2012, the valuation of our outstanding cash-settled plans was based on the following parameters and assumptions:
Fair Value and Parameters Used at Year-End 2012 for Cash-Settled Plans LTI Plan 2015 (2012 Tranche)
EPP 2015 (2012 Tranche)
SOP PP
SOP 2010 (2010 – 2012 Tranche)
Other1)
Other1)
Monte-Carlo
Monte-Carlo
NA
NA
2/7/2012
4/5/2012
5/6/2009
9/9/2010
2/21/2012
10/1/2012
349
2,752
10,321
18,920
4,534
4,091
Weighted average fair value as at December 31, 2012
€57.79
€60.69
€7.36
€17.06
€30.32
€34.11
Weighted average intrinsic value as at December 31, 2012
€60.69
€60.69
€4.76
€14.79
€30.32
€34.11
3.1
0.1
1.2
4.1
1.3
1.1
0.06%
0.00%
−0.04%
0.03% to 0.41%
NA
NA
NA
NA
19.8%
25.8% to 29.6%
NA
NA
Option pricing model used Range of grant dates
9/1/2012 Quantity of awards issued (in thousands)
Expected remaining life as at December 31, 2012 (in years) Risk-free interest rate (depending on maturity) Expected volatility SAP shares Expected dividend yield SAP shares
SFSF Rights
Ariba Rights
6/8/2012
1.55%
NA
1.55%
1.55%
NA
NA
Share price of reference index
NA
NA
€192.95
NA
NA
NA
Expected volatility reference index
NA
NA
5.5%
NA
NA
NA
Expected dividend yield reference index
NA
NA
1.39%
NA
NA
NA
Expected correlation SAP share/reference index
NA
NA
42.1%
NA
NA
NA
1)
�For these awards the fair value is calculated by subtracting the net present value of expected future dividend payments, if any, until maturity of the respective award from the prevailing share price as of the valuation date.
Expected volatility of the SAP share price is based on a mixture of implied volatility from traded options with corresponding lifetimes and exercise prices as well as historical volatility with the same expected life as the options granted. For the SOP PP valuation, the expected volatility of the Technology Peer Group Index (ISIN DE000A0YKR94) (TechPGI) is based on the historical volatility derived from the index price history.
Notes to the Consolidated Financial Statements
Expected remaining life of the options reflects both the contractual term and the expected, or historical, exercise behavior. The risk-free interest rate is derived from German government bonds with a similar duration. Dividend yield is based on expectations of future dividends. The number of awards under our cash-settled plans developed as follows in the years ended December 31, 2013, 2012, and 2011:
83
Assured Changes in Numbers of Outstanding Awards Under Our Cash-Settled Plans thousands LTI Plan 2015 (2012/2013 Tranche)
EPP 2015 (2012/2013 Tranche)
RSU 2013
Outstanding as at 12/31/2010
NA
NA
NA
Granted in 2011
NA
NA
NA
Exercised in 2011
NA
NA
NA
Expired in 2011
NA
NA
NA
Forfeited in 2011
NA
NA
NA
Outstanding as at 12/31/2011
NA
NA
NA
Granted in 2012
349
2,752
NA
Adjustment based upon KPI target achievement in 2012
117
880
NA
Exercised in 2012
0
0
NA
Expired in 2012
0
0
NA
Forfeited in 2012
0
−130
NA
Outstanding as at 12/31/2012
466
3,502
NA
Granted in 2013
311
2,087
1,559
Adjustment based upon KPI target achievement in 2013
−18
−139
0
−196
−3,495
0
0
−7
0
Forfeited in 2013
−48
−103
−96
Outstanding as at 12/31/2013
515
1,845
1,463
Awards exercisable as at 12/31/2011
NA
NA
NA
Awards exercisable as at 12/31/2012
0
0
NA
Awards exercisable as at 12/31/2013
0
0
0
Exercised in 2013 Expired in 2013
Additional information
Aggregate intrinsic value of vested awards (in € millions), as at 12/31/2011
NA
NA
NA
Aggregate intrinsic value of vested awards (in € millions), as at 12/31/2012
28
213
NA
Aggregate intrinsic value of vested awards (in € millions), as at 12/31/2013
43
115
0
Weighted average share price (in €) for share options exercised in 2011
NA
NA
NA
Weighted average share price (in €) for share options exercised in 2012
NA
NA
NA
54.96
59.90
NA
Provision as at 12/31/2012 (in € millions)
53
212
NA
Provision as at 12/31/2013 (in € millions)
41
115
32
Expense recognized in 2011 (in € millions)
NA
NA
NA
Expense recognized in 2012 (in € millions)
53
216
NA
Expense recognized in 2013 (in € millions)
−11
118
34
Weighted average share price (in €) for share options exercised in 2013
84
Notes to the Consolidated Financial Statements
Assured Cash-settled plans granted to SAP employees (except for employees of SFSF and Ariba) SOP PP
SOP 2010 (2010–2013 Tranche)
SFSF Rights
Ariba Rights
9,575
5,373
NA
NA
0
5,192
NA
NA
0
0
NA
NA
0
0
NA
NA
−632
−515
NA
NA
8,943
10,050
NA
NA
0
8,331
4,534
4,091
NA
NA
NA
NA
−3,294
0
−1,826
−1,587
0
0
0
0
−805
−954
−305
−144
4,844
17,427
2,403
2,360
0
7,421
NA
NA
NA
NA
NA
NA
−992
−2,215
−797
−1,362
0
0
0
0
−385
−967
−531
−90
3,467
21,666
1,075
908
8,943
0
NA
NA
4,844
0
0
0
3,467
1,609
0
0
0
0
NA
NA
23
0
3
3
0
37
0
0
NA
NA
NA
NA
60.40
NA
30.32
34.11
61.38
55.47
29.00
32.63
36
137
39
51
3
183
20
24
−8
28
NA
NA
20
74
38
21
−28
83
10
21
Notes to the Consolidated Financial Statements
a.1) Employee Participation Plan (EPP) and Long-Term Incentive Plan (LTI Plan) 2015 SAP implemented two new share-based payments in 2012: an Employee Participation Plan (EPP) 2015 for employees and a Long-Term Incentive (LTI) Plan 2015 for members of the Global Managing Board. The plans are focused on SAP’s share price and the achievement of two financial key performance indicators (KPIs): nonIFRS total revenue and non-IFRS operating profit, which are derived from the Company’s 2015 financial KPIs. Under these plans, virtual shares, called restricted share units (RSUs), are granted to participants. Participants are paid out in cash based on the number of RSUs that vest. The RSUs were granted and allocated at the beginning of each year through 2015, with EPP 2015 RSUs subject to annual Executive Board approval. Participants in the LTI Plan 2015 have already been granted a budget for the years 2012 to 2015 (2013 to 2015 for new plan participants in 2013). All participants in the LTI Plan 2015 are members of the Global Managing Board. The RSU allocation process will take place at the beginning of each year based on SAP’s share price after the publication of its preliminary annual results for the last financial year prior to the performance period. At the end of the given year, the number of RSUs that finally vest with plan participants depends on SAP’s actual performance for the given year, and might be higher or lower than the number of RSUs originally granted. If performance against both KPI targets reaches at least the defined 80% threshold, the RSUs vest. Depending on performance, the vesting can reach a maximum of 150% of the budgeted amount. If performance against either or both of those KPI targets does not reach the defined threshold of 80%, no RSUs vest and RSUs granted for that year will be forfeited. For the year 2013, the RSUs granted at the beginning of the year vested with 92.97% (2012: 133.55%) achievement of the KPI targets.
85
Assured Under the EPP 2015, the RSUs are paid out in the first quarter of the year after the one-year performance period, whereas the RSUs for members of the Global Managing Board under the LTI Plan 2015 are subject to a three-year-holding period before payout, which occurs starting in 2016. The plans include a “look-back” provision, due to the fact that these plans are based on reaching certain KPI levels in 2015. If the overall achievement in 2015 is higher or lower than represented by the number of RSUs vested from 2012 to 2014, the number of RSUs granted in 2015 can increase or decrease accordingly. However, RSUs that were already fully vested in prior years cannot be forfeited. For the EPP, the application of the “look-back”-provision is subject to approval by the Executive Board in 2015. The final financial effect of each tranche of the EPP 2015 and the LTI Plan 2015 will depend on the number of vested RSUs and the SAP share price, which is set directly after the announcement of the preliminary fourth quarter and fullyear results for the last financial year under the EPP 2015 (of the respective three-year holding period under the LTI Plan 2015), and thus may be significantly above or below the budgeted amounts. a.2) SOP Performance Plan 2009 (SOP PP) Under the SOP Performance Plan 2009, we granted to top executives and top performers cash-based virtual stock options, the value of which depends on the multi-year performance of the SAP share relative to an industry-specific share price index, the TechPGI. The future payout at the exercise date will be based on the outperformance of the SAP share price over the TechPGI. Exercise is only possible if the SAP share price has outperformed the TechPGI. For that purpose, the SOP PP 2009 agreement defines the initial value of the TechPGI (€97.54) as well as the SAP initial exercise price (€28.00 per share). After a vesting period of two years, the plan provides for 4 predetermined exercise dates every calendar year until the rights lapse five years after the grant date. The latest possible exercise day for eligible employees will be in March 2014.
86
Monetary benefits are capped at 110% of the grant price (€30.80). The dynamic exercise price at valuation date is €66.29. a.3) SAP Stock Option Plan 2010 (SOP 2010 (2010 – 2013 Tranches)) Under the SAP Stock Option Plan 2010, we granted members of the Senior Leadership Team / Global Executives, SAP’s Top Rewards (employees with an exceptional rating / high potentials) between 2010 and 2013 and only in 2010 and 2011 members of the Executive Board cash-based virtual stock options, the value of which depends on the multi-year performance of the SAP share. The grant-base value is based on the average fair market value of one ordinary share over the five business days prior to the Executive Board resolution date. The virtual stock options granted under the SOP 2010 give the employees the right to receive a certain amount of money by exercising the options under the terms and conditions of this plan. After a three-year vesting period (four years for members of the Executive Board), the plan provides for 11 predetermined exercise dates every calendar year (one date per month except in April) until the rights lapse six years after the grant date (seven years for members of the Executive Board). Employees can exercise their virtual stock options only if they are employed by SAP; if they leave the Company, they forfeit them. Executive Board members’ options are non-forfeitable once granted – if the service agreement ends in the grant year, the number of options is reduced pro rata temporis. Any options not exercised at the end of their term expire. The exercise price is 110% of the grant base value (115% for members of the Executive Board) which is €39.03 (€40.80) for the 2010 tranche, €46.23 (€48.33) for the 2011 tranche, €49.28 for the 2012 tranche, and €59.85 for the 2013 tranche. Monetary benefits will be capped at 100% of the exercise price (150% for members of the Executive Board).
Notes to the Consolidated Financial Statements
Assured Cash-settled plans granted to employees of SFSF and Ariba a.4) Restricted Stock Unit Plan 2013 (RSU 2013) We maintain share-based payment plans that allow for the issuance of restricted stock units (RSU) to retain and motivate executives and certain employees of the SuccessFactors and Ariba businesses, which we acquired in 2012. Under the RSU 2013 Plan, we granted a certain number of RSUs throughout 2013 representing a contingent right to receive a cash payment determined by the market value of the same number of SAP AG American Depository Receipts on the New York Stock Exchange and the number of RSUs that ultimately vest. Granted RSUs will vest in different tranches, either: – �Over a one-to-three year service period only, or – �Over a one-to-three year service period and upon meeting certain key performance indicators (KPIs). The number of RSUs that could vest for SuccessFactors employees under the performance-based grants was contingent upon a weighted achievement of performance milestones for the fiscal year ended December 31, 2013 related to: – �Specific indicators of cloud subscriptions and support revenue (80%) and – �Profit contribution of such specific indicators of cloud subscriptions and support revenue (20%). Depending on performance, the number of RSUs vesting could have ranged between 80% and 140% of the number initially granted. Performance against the KPI targets was set at 100% in fiscal year 2013.
the number of RSUs that can vest is capped at 200% of the number originally granted. Performance against the KPI targets was 100% in fiscal year 2013. The RSUs are paid out in cash upon vesting. a.5) SuccessFactors Cash-Settled Awards Replacing Pre-Acquisition SuccessFactors Awards (SFSF Rights) In conjunction with the acquisition of SuccessFactors in 2012, under the terms of the acquisition agreement, SAP exchanged unvested Restricted Stock Awards (RSAs), Restricted Stock Units (RSUs), and Performance Stock Units (PSUs) held by employees of SuccessFactors for cash-settled share-based payment awards of SAP (SFSF Rights). RSAs, RSUs, and PSUs unvested at the closing of the acquisition were converted into the right to receive, at the originally agreed vesting dates, an amount in cash equal to the number of RSAs and RSUs held at the vesting date multiplied by US$40.00 per share. There were 4.5 million unvested RSAs, RSUs, and PSUs at the acquisition date, representing a fair value of €128 million after considering forfeitures dependent on grant dates and remaining vesting periods. Of the total fair value, €59 million was allocated to consideration transferred and €68 million was allocated to future services to be provided and will be recognized as post-acquisition compensation expense as the awards vest over the remainder of the original vesting terms – the remaining vesting period for such SuccessFactors Rights are in a range of up to four years from the acquisition date. From January 1, 2013, to December 31, 2013, 0.8 million SFSF Rights vested. The unrecognized expense related to SFSF Rights was €11 million as at December 31, 2013, and will be recognized over a remaining vesting period of up to 2.0 years.
The number of RSUs that could vest for Ariba employees under the performance-based grants was contingent upon achievement of performance milestones for the fiscal year ended December 31, 2013 related to specific indicators of growth in cloud subscriptions and support revenue. The KPI targets included a minimum threshold for at least 50% vesting. If performance against the KPI targets had not exceeded the minimum threshold, no RSUs would have vested. Additionally,
Notes to the Consolidated Financial Statements
87
Assured a.6) Ariba Cash-Settled Awards Replacing Pre-Acquisition Ariba Awards (Ariba Rights) The terms of the acquisition agreement under which SAP acquired Ariba in 2012 required SAP to exchange unvested Restricted Stock Awards (RSAs) and Restricted Stock Units (RSUs) held by employees of Ariba for cash-settled sharebased payment awards of SAP (Ariba Rights). RSAs and RSUs unvested at the closing of the acquisition were converted into the right to receive an amount in cash equal to the number of RSAs and RSUs held at the vesting date multiplied by US$45.00 per share in accordance with the respective vesting terms. There were 4.1 million unvested RSAs and RSUs at the acquisition date, representing a fair value of €138 million after considering forfeitures dependent on grant dates and remaining vesting periods. Of the total fair value, €86 million was allocated to consideration transferred and €52 million was allocated to future services to be provided and will be recognized as post-acquisition compensation expense as the awards vest over the remainder of the vesting terms – the remaining vesting period for such Ariba Rights are in a range of up to 3.5 years at acquisition date (in accordance with the originally agreed vesting dates). From January 1, 2013, to December 31, 2013, 1.4 million Ariba Rights vested. The unrecognized expense related to Ariba Rights was €7 million as at December 31, 2013, and will be recognized over a remaining vesting period of up to 1.75 years.
88
b) Equity-Settled Share-Based Payments Equity-settled plans include primarily the Share Matching Plan (SMP). Under the Share Matching Plan (SMP) implemented in 2010, SAP offers its employees the opportunity to purchase SAP AG shares at a discount of 40%. The number of SAP shares an eligible employee may purchase through the SMP is limited to a percentage of the employee’s annual base salary. After a three-year holding period, such plan participants will receive one (in 2012: five) free matching share of SAP for every three SAP shares acquired. The terms for the members of the Senior Leadership Team / Global Executives are slightly different than those for the other employees. They do not receive a discount when purchasing the shares. However, after a three-year holding period, they receive two (in 2012: five) free matching SAP shares for every three SAP shares acquired. This plan is not open to members of the SAP Executive Board.
Notes to the Consolidated Financial Statements
Assured The following table shows the parameters and assumptions used at grant date to determine the fair value of free matching shares, as well as the quantity of shares purchased and free matching shares granted through this program in 2013, 2012, and 2011:
Fair Value and Parameters at Grant Date for SMP
Grant date
2013
2012
2011 6/8/2011
9/4/2013
6/6/2012
Share price at grant date
€54.20
€45.43
€41.73
Purchase price set by the Executive Board
€56.20
€48.23
€44.07
Risk-free interest rate
0.43%
0.12%
1.95%
Expected dividend yield of SAP shares
1.92%
2.13%
1.70%
3.0
3.0
3.0
€51.09
€42.54
€39.69
1,559
1,926
1,334
573
3,210
481
2013
2012
2011
Expense recognized relating to discount
32
34
22
Expense recognized relating to vesting of free matching shares
51
34
9
Total expense relating to SMP
83
68
31
Unrecognized expense as at December 31
80
107
22
Average remaining vesting period (in years) as at December 31
1.6
2.2
2.2
Expected life of free matching shares (in years) Free matching share fair value at grant date Number of shares purchased (in thousands) Free matching shares granted (in thousands)
The following table shows the breakdown of the expense recognized for this program in 2013, 2012, and 2011 and the unrecognized expense at year-end in € millions:
Recognized and Unrecognized Expense at Year-End for SMP € millions, unless otherwise stated
Notes to the Consolidated Financial Statements
89
Assured (28) Segment and Geographic Information General Information Our internal reporting system produces reports in which business activities are presented in a variety of ways, for example, by line of business, geography, and areas of responsibility of the individual Board members. Based on these reports, the Executive Board, which is responsible for assessing the performance of various company components and making resource allocation decisions as our Chief Operating Decision Maker (CODM), evaluates business activities in a number of different ways. SAP has two divisions – On-Premise and Cloud, which are further divided into operating segments. Our On-Premise division is comprised of two operating segments: On-Premise Products and On-Premise Services, and our Cloud division is comprised of two operating segments: Cloud Applications and Ariba. All operating segments are reportable segments. On August 1, 2013, SAP acquired hybris AG. Since the majority of hybris’ activities are currently delivered in an on-premise model, the majority of hybris’ activities are correspondingly reflected in the On-Premise segments.
The On-Premise division derives its revenues primarily from the sale of on-premise software (that is, software designed for use on hardware on the customer’s premises), mobile software (that is, software designed for use on mobile devices), and services relating to such software. Within the On-Premise division, the On-Premise Products segment is primarily engaged in marketing and licensing our on-premise and mobile software products and providing support services for these software products. The On-Premise Services segment primarily performs various professional services, mainly implementation services of our software products and educational services on the use of our software products. The Cloud division derives its revenues primarily from the sale of cloud software (that is, software designed for delivery through the cloud) and services relating to such software (including support services, professional services, and educational services). Within the Cloud division, the Cloud Applications segment is primarily engaged in marketing and selling subscriptions to the cloud software offerings developed by SAP and SuccessFactors. The Ariba segment primarily markets and sells the cloud software offerings developed by Ariba and derives revenue from its cloud-based collaborative business network.
The most important factors we use to identify operating segments are distinctions among our product and service offerings, notably: – �Between divisions, the software delivery model (software to be installed on the customer’s hardware (on-premise software), as distinct from software for delivery in the cloud) – �Within the On-Premise division, the types of services offered – �Within the Cloud division, the fields in which the cloud applications are used
90
Notes to the Consolidated Financial Statements
Assured Information About Profit or Loss, Assets, and Liabilities
Operating Segments Revenue and Profit or Loss € millions On-Premise Division
Cloud Division Cloud Applications
Ariba
Total
On-Premise Products
On-Premise Services
Division Total
Division Total
4,517
0
4,517
1
0
1
0
0
0
412
344
757
757
4,517
0
4,517
413
345
758
5,275
2013 Software Cloud subscriptions and support Software and cloud subscriptions Support Software and software-related service revenue Professional services and other service revenue Total revenue Cost of revenue
4,518
8,710
0
8,710
16
30
46
8,756
13,227
0
13,227
429
375
804
14,032
0
2,695
2,695
85
85
170
2,865
13,227
2,695
15,923
514
461
975
16,897
−2,020
−2,134
−4,154
−178
−180
−358
−4,512
Gross profit
11,207
562
11,769
336
281
617
12,385
Cost of sales and marketing
−3,447
0
−3,447
−328
−151
−479
−3,926
7,760
562
8,322
8
130
138
8,460
4,656
0
4,656
2
0
2
4,658
0
0
0
257
86
343
343
4,656
0
4,656
259
86
345
5,001
Reportable segment profit/loss 2012 Software Cloud subscriptions and support Software and cloud subscriptions Support Software and software-related service revenue Professional services and other service revenue Total revenue Cost of revenue
8,226
0
8,226
10
10
20
8,246
12,881
0
12,881
269
96
365
13,246
0
2,967
2,967
67
25
91
3,058
12,881
2,967
15,848
336
120
456
16,304
−1,994
−2,306
−4,300
−163
−72
−234
−4,533
Gross profit
10,887
661
11,549
173
49
222
11,771
Cost of sales and marketing
−3,414
0
−3,414
−231
−43
−275
−3,689
7,473
661
8,134
−59
5
−53
8,082
4,105
0
4,105
0
2
2
4,107
0
0
0
18
0
18
18
4,105
0
4,105
18
2
20
4,125
7,220
0
7,220
0
0
1
7,220
11,325
0
11,325
18
2
20
11,346
Reportable segment profit/loss 2011 Software Cloud subscriptions and support Software and cloud subscriptions Support Software and software-related service revenue
0
2,901
2,901
12
1
13
2,914
Total revenue
Professional services and other service revenue
11,325
2,901
14,226
29
4
33
14,260
Cost of revenue
−1,762
−2,201
−3,963
−66
−9
−75
−4,038
9,564
700
10,264
−37
−5
−42
10,222
−2,919
0
−2,919
−32
−2
−34
−2,954
6,644
700
7,344
−69
−7
−76
7,268
Gross profit Cost of sales and marketing Reportable segment profit/loss
Notes to the Consolidated Financial Statements
91
Assured Segment asset/liability information is not regularly provided to our CODM. Goodwill by operating segment is disclosed in Note (15). Measurement and Presentation Our management reporting system reports our intersegment services as cost reductions and does not track them as internal revenue. Intersegment services mainly represent utilization of human resources of one segment by another segment on a project-by-project basis. Intersegment services are charged based on internal cost rates including certain indirect overhead costs, excluding a profit margin. Most of our depreciation and amortization expense affecting operating segment profits is allocated to the segments as part of broader infrastructure allocations and is thus not tracked separately on the operating segment level. Depreciation and amortization expense that is directly allocated to the operating segments is immaterial in all operating segments presented. The accounting policies applied in the measurements of the operating segments’ revenues and profits differ from IFRS accounting principles described in Note (3) as follows: – �The measurements of the operating segments revenues and profits generally attribute revenue to the segment based on the nature of the business regardless of revenue classification in our income statement. Thus, for example, the Cloud Applications segment’s revenue may include certain amounts classified as software revenue in our Consolidated Income Statements. – �The measurements of the operating segments’ revenues and profits includes the recurring revenues that would have been reflected by acquired entities had it remained a stand-alone entity but which are not reflected as revenue under IFRS as a result of purchase accounting for customer contracts in effect at the time of an acquisition.
92
– �The measurements of the operating segments’ profits excludes share-based payment expense, and restructuring costs as well as research and development expense and general and administration expense at segment level. These expenses are managed and reviewed at the Group level only. – �The measurements of the operating segments’ profits exclude the following acquisition-related charges: �Amortization expense/impairment charges of intangibles acquired in business combinations and certain stand-alone acquisitions of intellectual property ��Expenses from purchased in-process research and development �Restructuring expenses and settlements of pre-existing relationships �Acquisition-related third-party costs that are required to be expensed – �The measurements of the operating segments’ profits excludes results of the discontinued operations that qualify as such under IFRS in all respects except if they do not represent a major line of business. For all periods presented this relates exclusively to the operations of TomorrowNow. Cost of revenue for our On-Premise Services segment also includes sales and marketing expenses related to professional services and other services that result from sales and marketing efforts that cannot be clearly separated from providing the services. For this reason, no sales and marketing expenses as such have been allocated to this segment.
Notes to the Consolidated Financial Statements
Assured Reconciliation of Revenues and Segment Results € millions 2013
2012
2011
16,897
16,304
14,260
−2
0
0
Adjustment recurring cloud subscriptions and support revenues
−61
−73
0
Adjustment recurring support revenues
−19
−9
−27
Total revenues for reportable segments Adjustment recurring software revenues
Adjustment recurring revenues Total revenue Total profit for reportable segments Adjustment recurring revenues Research and development expense General and administration expense Other operating income/expense, net
−82
−81
−27
16,815
16,223
14,233
8,460
8,082
7,268
−82
−81
−27
−2,162
−2,132
−1,894
−796
−784
−685
12
23
25
−70
−8
−4
−327
−522
−68
0
0
717
Acquisition-related charges
−555
−537
−448
Operating profit
4,479
4,041
4,884
−17
−173
−75
Restructuring Share-based payments TomorrowNow litigation / Loss from discontinued operations
Other non-operating income/ expense, net Financial income, net Profit before tax
−66
−72
−42
4,396
3,796
4,767
Geographic Information The tables below show the geographical breakdown of revenue according to specific criteria: – �The management view is the geographic revenue breakdown that the SAP Executive Board, SAP's chief operating decisionmaker, uses primarily when reviewing revenue by sales destination. Under this view, the software revenue from a software contract is attributed to the country in which the contract was negotiated. Such reporting presumes that the software contract was negotiated in the country in which the customer is domiciled. The only circumstances in which this presumption is not applied is where there is objective evidence that all contract negotiations took place in a country other than the domicile of the legal entity contracting on the customer’s behalf. Software revenue from a given software contract is always attributed to a single geographical region; in other words, the software revenue is not split between geographical regions. Because cloud subscriptions and support revenue is earned largely from contracts that were negotiated in various periods in the past, it is allocated without exception to the country in which the customer is domiciled. – �In the presentation by customer location, all revenue is attributed to the country in which the customer is domiciled. Revenue by Region Revenue by Region – Management View
Software Revenue by Region € millions 2013
The research and development expense and general and administration expense presented in the reconciliation differ from the corresponding expenses in the consolidated income statement because the portions of share-based payments-related expenses, restructuring expenses, and acquisition-related expenses that are included in the research and development line item respectively the general and administration expense line item in the income statement, are presented as separate items in the reconciliation.
Notes to the Consolidated Financial Statements
2012
2011
EMEA
2,095
2,005
1,852
Americas
1,620
1,774
1,534
APJ SAP Group
802
879
722
4,516
4,658
4,107
93
Assured Software Revenue by Location of Negotiation and Cloud Subscription Revenue by Region
Software and Cloud Subscription Revenue by Region € millions
€ millions
2013 2013
2012
2011
EMEA
2,212
2,071
1,865
Americas
2,164
1,961
1,539
837
896
722
5,212
4,928
4,125
APJ SAP Group
2012
2011
EMEA
2,233
2,107
1,864
Americas
2,130
1,920
1,540
APJ SAP Group
849
901
722
5,212
4,928
4,125
Software and Software-Related Service Revenue by Region
Revenue by Region – Location of Customers
€ millions 2013
Software Revenue by Region € millions 2013
2012
2011
EMEA
2,116
2,041
1,851
Americas
1,586
1,733
1,534
814
884
722
4,516
4,658
4,107
APJ SAP Group
2012
2011
Germany
1,984
1,821
1,726
Rest of EMEA
4,566
4,285
3,803 5,529
Total EMEA
6,549
6,106
United States
3,788
3,537
2,870
Rest of Americas
1,408
1,283
1,088
Total Americas
5,196
4,820
3,958
556
699
579
1,647
1,540
1,253
Japan Rest of APJ APJ SAP Group
2,204
2,239
1,832
13,950
13,165
11,319
2013
2012
2011
Cloud Subscriptions and Support Revenue by Region € millions 2013
2012
2011
EMEA
117
66
13
Americas
544
187
5
APJ SAP Group
35
17
0
696
270
18
Total Revenue by Region € millions
Germany
2,505
2,380
2,347
Rest of EMEA
5,381
5,106
4,644 6,991
Total EMEA
7,885
7,486
United States
4,661
4,461
3,699
Rest of Americas
1,705
1,639
1,392
Total Americas
6,366
6,100
5,091
624
789
652
1,939
1,848
1,499
Japan Rest of APJ APJ SAP Group
94
2,563
2,637
2,151
16,815
16,223
14,233
Notes to the Consolidated Financial Statements
Assured Non-Current Assets € millions 2013
2012
Germany
2,337
2,318
France
2,112
2,120
Rest of EMEA
4,161
3,251
EMEA
8,610
7,689
United States
9,823
10,395
Rest of Americas Americas Japan
123
97
9,946
10,492
19
22
Rest of APJ
204
216
APJ
223
238
18,779
18,418
SAP Group
Non-current assets as presented in the table above follow the requirements of IFRS 8 for a geographical breakdown of non-current assets excluding financial instruments, deferred tax assets, post-employment benefits, and rights arising under insurance contracts.
Bill McDermott Co-Chief Executive Officer Strategy, Governance, Business Development, Corporate Development, Sales and Ecosystem Activities Communications and Marketing Board of Directors, ANSYS, Inc., Canonsburg, Pennsylvania, United States Board of Directors, Under Armour, Inc., Baltimore, Maryland, United States
Jim Hagemann Snabe Co-Chief Executive Officer Strategy, Governance, Business Development, Corporate Development, Communications and Marketing Board of Directors, Bang & Olufsen a/s, Stuer, Denmark Board of Directors, The Danske Bank Group, Copenhagen, Denmark (from March 18, 2013) Supervisory Board, Siemens AG, Munich, Germany (from October 1, 2013)
For information about the breakdown of our full-time equivalent employee numbers by region, see Note (7). (29) Board of Directors Executive Board Memberships on supervisory boards and other comparable governing bodies of enterprises, other than subsidiaries of SAP on December 31, 2013
Dr. Werner Brandt Chief Financial Officer, Labor Relations Director Finance and Administration including Investor Relations and Data Protection & Privacy Human Resources Supervisory Board, Deutsche Lufthansa AG, Frankfurt am Main, Germany Supervisory Board, QIAGEN N.V., Venlo, the Netherlands Supervisory Board, RWE AG, Essen, Germany (from April 18, 2013)
Gerhard Oswald Board Area Scale Quality & Support SAP Active Global Support, SAP HANA Enterprise Cloud, Cloud Delivery, Quality Governance & Production, Solution & Knowledge Packaging, SAP Labs Network (joint leadership with Vishal Sikka) Notes to the Consolidated Financial Statements
95
Assured Dr. Vishal Sikka Products & Innovation Global Product Development including SAP HANA, Custom Development, Design & User Experience, Global Research, SAP Labs Network (joint leadership with Gerhard Oswald)
Chairman of the Board of Directors, Blyk International Ltd., London, UK Chairman of the Board of Directors, Huhtamäki Oyj, Espoo, Finland
Panagiotis Bissiritsas 1), 2), 6) Support Expert Board Members Who Left During 2013 Lars Dalgaard (until May 31, 2013) Luisa Deplazes Delgado (until June 30, 2013)
Supervisory Board Memberships on supervisory boards and other comparable governing bodies of enterprises, other than subsidiaries of SAP on December 31, 2013
Prof. Anja Feldmann 5), 9) Professor at the Electrical Engineering and Computer Science Faculty at the Technische Universität Berlin
Prof. Dr. Wilhelm Haarmann 2), 6), 8), 9) Attorney-at-law, certified public auditor, certified tax advisor Linklaters LLP, Rechtsanwälte, Notare, Steuerberater, Frankfurt am Main, Germany
Prof. Dr. h. c. mult. Hasso Plattner 2), 4), 5), 7), 8), 9) Chairman
Chairman of the Supervisory Board, CinemaxX AG, Hamburg, Germany
Board of Directors, Bramasol, Inc., San Francisco, California, USA (until July 1, 2013) Supervisory Board, Oligo Lichttechnik GmbH, Hennef, Germany
Margret Klein-Magar 1), 2), 5), 8) Vice President, Head of People Principles
Christiane Kuntz-Mayr 1), 4), 5), 9) Deputy Chairperson Deputy Chairperson of the Works Council at SAP AG
Lars Lamadé 1), 2), 8), 9) Project Manager OPD COO Deputy Chairman of the Supervisory Board, Rhein-Neckar-Loewen GmbH, Kronau, Germany
Pekka Ala-Pietilä 5), 7), 8) Chairman of the Board of Directors, Solidium Oy, Helsinki, Finland
Bernard Liautaud 2), 5), 7) General Partner Balderton Capital, London, UK
Board of Directors, Pöyry Plc, Vantaa, Finland Chairman of the Board of Directors, CVON Group Limited, London, UK Board of Directors, CVON Limited, London, UK Chairman of the Board of Directors, CVON Innovation Services Oy, Turku, Finland Board of Directors, CVON Future Limited, London, UK
Board of Directors, nlyte Software Ltd., London, UK Board of Directors, Talend SA, Suresnes, France Board of Directors, Cap Gemini, Paris, France (until October 8, 2013) Board of Directors, Quickbridge (UK) Ltd., London, UK Board of Directors, SCYTL Secure Electronic Voting SA, Barcelona, Spain
96
Notes to the Consolidated Financial Statements
Assured Board of Directors, Abiquo Group Inc., Redwood City, California, United States Board of Directors, Vestiaire Collective SA, Levallois-Perret, France Board of Directors, Dashlane, Inc., New York, New York, United States Board of Directors, Recorded Future, Inc., Cambridge, Massachusetts, United States Board of Directors, eWise Group, Inc., Redwood City, California, United States Board of Directors, Qubit Digital Ltd., London, UK
Dr. h. c. Hartmut Mehdorn 4), 6), 9) CEO of FBB, Flughafen Berlin-Brandenburg GmbH, Berlin, Germany Board of Directors, Air Berlin PLC & Co. Luftverkehrs KG, Berlin (until January 7, 2013) Advisory Board, Fiege-Gruppe, Greven, Germany Board of Directors, RZD – Russian Railways, Moscow, Russia
Dr. Kurt Reiner 1), 5), 6) Development Expert
Stefan Schulz 1), 3), 5), 9) Vice President, IP at HANA Enterprise Cloud Supervisory Board, ORTEC International Beheer B.V., Zoetermeer, the Netherlands (from June 17, 2013)
Inga Wiele 1), 3), 5) Senior Internal Strategic Consultant
Prof. Dr.-Ing. Dr.-Ing. E. h. Klaus Wucherer 3), 5) Managing Director of Dr. Klaus Wucherer Innovations- und Technologieberatung GmbH, Erlangen, Germany Deputy Chairman of the Supervisory Board, HEITEC AG, Erlangen, Germany Supervisory Board, Dürr AG, Bietigheim-Bissingen, Germany Supervisory Board, LEONI AG, Nuremberg, Germany Chairman of the Supervisory Board, Festo AG & Co. KG, Esslingen, Germany
Information as at December 31, 2013 Elected by the employees Member of the Company’s General and Compensation Committee 3) Member of the Company’s Audit Committee 4) Member of the Company’s Mediation Committee 5) Member of the Company’s Technology and Strategy Committee 6) Member of the Company’s Finance and Investment Committee 7) Member of the Company’s Nomination Committee 8) Member of the Company’s Special Committee 9) Member of the Company’s People and Organization Committee 1)
2)
Mario Rosa-Bian 1), 4), 9) Project Principal Consultant
Dr. Erhard Schipporeit 3), 8) Independent Management Consultant Supervisory Board, Talanx AG, Hanover, Germany Supervisory Board, Deutsche Börse AG, Frankfurt am Main, Germany Supervisory Board, HDI V.a.G., Hanover, Germany Supervisory Board, Hannover Rückversicherung SE, Hanover, Germany Supervisory Board, Fuchs Petrolub SE, Mannheim, Germany Supervisory Board, BDO AG, Hamburg, Germany Board of Directors, TUI Travel PLC, London, UK Board of Directors, Fidelity Funds SICAV, Luxembourg
Notes to the Consolidated Financial Statements
97
Assured The total compensation of the Executive Board members for the years 2013, 2012, and 2011 was as follows:
Executive Board Compensation € thousands
Short-term employee benefits Share-based payment1) Subtotal1)
2013
2012
2011
24,728
17,054
20,197
8,603
14,855
4,016
33,331
31,909
24,213
(2012: €72,138 thousands) and the total Executive Board compensation amounts to €25,434 thousands (2012: €75,401 thousands). These amounts differ from the amounts shown in the table above, since the amounts in the table above are based on the LTI tranches that were allocated to each of the respective years, rather than are based on the grant date as defined under section 314 of the German Commercial Code (HGB).
Share-Based Payment for Executive Board Members
Post-employment benefits
1,324
3,263
1,547
thereof defined-benefit
189
1,711
696
1,135
1,552
850
0
0
4,125
Number of stock options granted Total expense in € thousands
thereof defined-contribution Termination benefits Other long-term benefits Total1) 1)
0
0
4,031
34,655
35,172
33,915
Number of RSUs granted
2013
2012
152,159
326,432
0
0
0
475,227
−8,596
57,429
4,420
2011
Portion of total executive compensation allocated to the respective year
The share-based payment amounts disclosed above are based on the grant date fair value of the restricted share units (RSUs) issued to Executive Board members during the year. The Executive Board members already received, in 2012, the LTI grants for the years 2012 to 2015 subject to continuous service as member of the Executive Board in the respective years. Although these grants are linked to and thus, economically, compensation for the Executive Board members in the respective years, section 314 of the German Commercial Code (HGB) requires them to be included in the total compensation number for the year of grant. Due to the contract extension for Gerhard Oswald in 2013, an additional grant was triggered during 2013, which relates to the allocations of 2014 and 2015. Vesting of the LTI grants is dependent on the respective Executive Board member’s continuous service for the Company.
In the table above, the share-based payment expense is the amount recorded in profit or loss under IFRS 2 in the respective period. The projected benefit obligation (PBO) for pensions to Executive Board members and the annual pension entitlement of the members of the Executive Board on reaching age 60 based on entitlements from performance-based and salary-linked plans were as follows:
Retirement Pension Plan for Executive Board Members € thousands
PBO December 31 Annual pension entitlement
2013
2012
2011
9,077
8,889
7,291
452
429
437
The share-based payment as defined in section 314 of the German Commercial Code (HGB) amounts to €3,150 thousands (2012: €55,085 thousands) based on the allocations for 2014 and 2015 for Gerhard Oswald which were granted in 2013 in line with the extension of his Executive Board contract. Including this amount, the subtotal Executive Board compensation amounts to €24,110 thousands 98
Notes to the Consolidated Financial Statements
Assured Subject to the adoption of the dividend resolution by the shareholders at the Annual General Meeting of Shareholders on May 21, 2014, the total annual compensation of the Supervisory Board members for 2013 is as follows:
SAP did not grant any compensation advance or credit to, or enter into any commitment for the benefit of, any member of the Executive Board or Supervisory Board in 2013, 2012, or 2011.
Supervisory Board Compensation
On December 31, 2013, the shareholdings of SAP’s board members were as follows:
€ thousands 2013
2012
2011
2,966
2,981
3,028
thereof fixed compensation
870
901
874
thereof committee remuneration
416
340
465
1,680
1,741
1,688
Total compensation
thereof variable compensation
Shareholdings of Executive and Supervisory Board Members Number of SAP shares 2013 Executive Board Supervisory Board
The Supervisory Board members do not receive any sharebased payment for their services. As far as members who are employee representatives on the Supervisory Board receive share-based payment such compensation is for their services as employees only and is unrelated to their status as members of the Supervisory Board.
2012
2011
30,201
35,271
20,569
119,316,444
121,363,858
121,524,139
Detailed information about the different elements of the compensation as well as the number of shares owned by members of the Executive Board and the Supervisory Board are disclosed in the Compensation Report which is part of our Management Report and of our Annual Report on Form 20-F, both of which are available on SAP’s Web site.
The total compensation of all Supervisory Board members in 2013 for work for SAP excluding compensation relating to the office of Supervisory Board member was €1,176 thousands (2012: €1,084 thousands; 2011: €1,688 thousands). During the fiscal year 2013, payments to and PBO for former Executive Board members were as follows:
Payments to / PBO for Former Executive Board Members € thousands 2013 Pension benefits PBO
2012
2011
1,387
1,360
1,346
29,181
30,551
25,267
Notes to the Consolidated Financial Statements
99
Assured (30) Related Party Transactions Certain Executive Board and Supervisory Board members of SAP AG currently hold, or held within the last year, positions of significant responsibility with other entities, as presented in Note (29). We have relationships with certain of these entities in the ordinary course of business, whereby we buy and sell a wide variety of products and services at prices believed to be consistent with those negotiated at arm’s length between unrelated parties.
All amounts related to the above mentioned transactions were immaterial to SAP in all periods presented. For information about the compensation of our Executive Board and Supervisory Board members, see Note (29).
Companies controlled by Hasso Plattner, chairman of our Supervisory Board and Chief Software Advisor of SAP, engaged in the following transactions with SAP: providing consulting services to SAP, selling a piece of land to SAP, receiving sport sponsoring from SAP, making purchases of SAP products and services. In the prior year, this also included purchasing an entity through an asset deal from a company indirectly held by him. Christiane Kuntz-Mayr, vice chairperson of the SAP Supervisory Board, acts as a manager of family & kids @ work gemeinnützige UG ("family & kids @ work"). Family & kids @ work is supported financially by SAP. Wilhelm Haarmann practiced as a partner in the law firm HAARMANN Partnerschaftsgesellschaft in Frankfurt am Main, Germany, until February 2013. In February 2013, he became a partner in Linklaters LLP. SAP occasionally purchased and purchases legal and similar services from both of these firms.
100
Notes to the Consolidated Financial Statements
Assured (31) Principal Accountant Fees and Services At the Annual General Meeting of Shareholders held on June 4, 2013, our shareholders elected KPMG AG Wirtschaftsprüfungsgesellschaft as SAP’s independent auditor for 2013. KPMG AG Wirtschaftsprüfungsgesellschaft and other firms in the global KPMG network charged the following fees to SAP for audit and other professional services related to 2013 and the previous years:
Fees for Audit and Other Professional Services € millions 2013 KPMG AG (Germany)
Foreign KPMG Firms
Total
2012 KPMG AG (Germany)
Foreign KPMG Firms
Total
2011 KPMG AG (Germany)
Foreign KPMG Firms
Total
Audit fees
2
7
9
2
8
10
2
7
9
Audit-related fees
1
0
1
2
0
2
0
0
0
Tax fees
0
0
0
0
0
0
0
0
0
All other fees
0
0
0
0
0
0
0
0
0
Total
3
7
10
4
8
12
2
7
9
Audit fees are the aggregate fees charged by KPMG for the audit of our Consolidated Financial Statements as well as audits of statutory financial statements of SAP AG and its subsidiaries. Audit-related fees are fees charged by KPMG for assurance and related services that are reasonably related to the performance of the audit or review of our financial statements and are not reported under audit fees. Tax fees are fees for professional services rendered by KPMG for tax advice on transfer pricing, restructuring, and tax compliance on current, past, or contemplated transactions. The all other fees category includes other support services, such as training and advisory services on issues unrelated to accounting and taxes. (32) German Code of Corporate Governance The German federal government published the German Code of Corporate Governance in February 2002. The Code contains statutory requirements and a number of recommendations and suggestions. Only the legal requirements are
Notes to the Consolidated Financial Statements
binding for German companies. With regard to the recommendations, the German Stock Corporation Act, section 161, requires that every year listed companies publicly state the extent to which they have implemented them. Companies can deviate from the suggestions without having to make any public statements. In 2013 and 2012, our Executive Board and Supervisory Board issued the required declarations of implementation. These statements are available on our Web site: www.sap.com/corporate-en/investors/governance. (33) Subsequent Events No events that have occurred since December 31, 2013, have a material impact on the Company’s Consolidated Financial Statements.
101
Assured (34) Subsidiaries, Associates, and Other Equity Investments As at December 31, 2013
Name and Location of Company
Ownership3)
Total Revenue in 20131)
Profit/ Loss (–) after Tax for 20131)
Total Equity as at 12/31/20131)
%
€(000)
€(000)
€(000)
Number of Employees as at 12/31/20132)
I. Fully Consolidated Subsidiaries GERMANY Ariba Deutschland GmbH, Frankfurt am Main
100.0
4,280
103
1,202
22
hybris GmbH, Munich5)
100.0
26,330
3,007
32,234
217
OutlookSoft Deutschland GmbH, Walldorf
100.0
–
0
3
–
SAP Beteiligungs GmbH, Walldorf
100.0
3
3
53
–
SAP Business Compliance Services GmbH, Siegen
100.0
4,797
363
1,089
38
SAP Deutschland AG & Co. KG, Walldorf8),10)
100.0
3,050,364
516,247
1,321,646
4,716
SAP Dritte Beteiligungs- und Vermögensverwaltungs GmbH, Walldorf9),10)
100.0
–
−20,479
541,342
–
SAP Erste Beteiligungs- und Vermögensverwaltungs GmbH, Walldorf9),10)
100.0
–
−3
804,844
–
SAP Foreign Holdings GmbH, Walldorf
100.0
–
−193
88
–
SAP Fünfte Beteiligungs- und Vermögensverwaltungs GmbH, Walldorf10)
100.0
–
2,849
2,325,861
–
SAP Hosting Beteiligungs GmbH, St. Leon-Rot
100.0
–
0
26
–
SAP Portals Europe GmbH, Walldorf
100.0
–
−8
124,191
– –
SAP Portals Holding Beteiligungs GmbH, Walldorf
100.0
–
−46
930,081
SAP Projektverwaltungs- und Beteiligungs GmbH, Walldorf9),10)
100.0
–
−949
323,875
–
SAP Puerto Rico GmbH, Walldorf
100.0
34,127
−2,779
−5,773
20
SAP Retail Solutions Beteiligungsgesellschaft mbH, Walldorf
100.0
–
−4,339
9,516
–
SAP Sechste Beteiligungs- und Vermögensverwaltungs GmbH, Walldorf10)
100.0
–
0
25
–
SAP Ventures Investment GmbH, Walldorf
100.0
–
1
58,030
–
SAP Vierte Beteiligungs- und Vermögensverwaltungs GmbH, Walldorf
100.0
–
0
24
–
SAP Zweite Beteiligungs- und Vermögensverwaltungs GmbH, Walldorf9),10)
100.0
–
−101,699
−126,334
–
SuccessFactors Germany GmbH, Garching
100.0
17,663
306
812
78
TechniData GmbH, Markdorf
100.0
117
639
29,703
–
REST OF EUROPE, MIDDLE EAST, AFRICA Ambin Properties (Proprietary) Limited, Johannesburg, South Africa
100.0
–
261
1,306
–
Ariba Belgium N.V., Heverlee, Belgium
100.0
1,653
68
1,405
8
Ariba Czech s.r.o., Prague, Czech Republic
100.0
8,294
210
1,666
158
Ariba France, SAS, Paris, France
100.0
11,228
602
3,436
53
Ariba Iberia, S.L., Madrid, Spain
100.0
1,778
74
716
12
Ariba International Sweden AB, Stockholm, Sweden
100.0
2,025
86
340
7
Ariba Italia SRL, Rome, Italy
100.0
1,589
12
−726
10
Ariba Middle East & North Africa FZ-LLC, Dubai, United Arab Emirates
100.0
550
31
53
2
Ariba Slovak Republic s.r.o., Kosice, Slovakia
100.0
1,601
62
396
36
Ariba Switzerland GmbH, Zurich, Switzerland
100.0
1,039
49
1,059
6
Ariba Technologies Ireland Ltd., Dublin, Ireland
100.0
986
41
−56
11
102
Notes to the Consolidated Financial Statements
Assured As at December 31, 2013
Name and Location of Company
Ownership3)
Total Revenue in 20131)
Profit/ Loss (–) after Tax for 20131)
Total Equity as at 12/31/20131)
%
€(000)
€(000)
€(000)
Number of Employees as at 12/31/20132)
Ariba Technologies Netherlands B.V., Amsterdam, the Netherlands
100.0
1,262
70
6,228
5
Ariba UK Limited, Egham, United Kingdom11)
100.0
14,567
604
6,400
63
b-process, Paris, France
100.0
12,538
−1,204
−4,556
46
Business Objects (UK) Limited, London, United Kingdom11)
100.0
–
−29,936
319
–
Business Objects Holding B.V., ’s-Hertogenbosch, the Netherlands
100.0
–
59
4,284
–
Business Objects Software Limited, Dublin, Ireland
100.0
902,168
499,289
4,774,388
245 –
Christie Partners Holding C.V., Rotterdam, the Netherlands
100.0
–
−2
−21,828
Crossgate UK Ltd., Slough, United Kingdom11)
100.0
–
–
–
–
Crystal Decisions (Ireland) Limited, Dublin, Ireland
100.0
–
0
44,543
– –
Crystal Decisions Holdings Limited, Dublin, Ireland
100.0
–
−4
77,725
Crystal Decisions UK Limited, London, United Kingdom11)
100.0
–
0
2,206
–
Epista Software A/S, Copenhagen, Denmark
100.0
3,040
871
5,849
12
EssCubed Procurement Pty. Ltd., Johannesburg, South Africa
100.0
−13
3
−786
–
hybris AG, Rotkreuz, Switzerland5)
100.0
51,536
−22,800
1,057,690
24
hybris Austria GmbH, Vienna, Austria5)
100.0
718
−116
−167
4
hybris France SAS, Levallois-Perret, France5)
100.0
5,418
−1,048
1,506
24
hybris Netherlands BV, Amsterdam, the Netherlands5)
100.0
1,575
−121
5,750
9
hybris Software AB, Västerås, Sweden5)
100.0
1,239
−598
8,716
9
hybris Sp.z.o.o., Gliwice, Poland5)
100.0
2,870
576
540
121
hybris UK Ltd., London, United Kingdom5)
100.0
11,281
−31
20,878
60
Joe D Partners C.V., Utrecht, the Netherlands
100.0
160,869
3,084
454,937
–
KXEN Ltd., London, United Kingdom5)
100.0
34
−200
−1,247
3
KXEN SAS, Suresnes, France5)
100.0
1,170
−443
−530
42
Limited Liability Company “SAP Labs”, Moscow, Russia
100.0
9,616
38
976
114
Limited Liability Company “SAP CIS”, Moscow, Russia
100.0
445,093
14,227
81,046
834
Limited Liability Company SAP Kazakhstan, Almaty, Kazakhstan
100.0
20,234
−1,122
3,814
23
Limited Liability Company SAP Ukraine, Kiev, Ukraine
100.0
35,415
−1,012
−3,669
96
Merlin Systems Oy, Espoo, Finland
100.0
9,967
230
3,300
31
NL Quotaholder 1 B.V., Amsterdam, the Netherlands
100.0
–
–
–
–
NL Quotaholder 2 B.V., Amsterdam, the Netherlands
100.0
–
–
–
–
OOO hybris Software, Moscow, Russia5)
100.0
290
11
193
4
Plateau Systems UK Ltd., Guildford, United Kingdom
100.0
–
−6
−7,163
–
Quadrem Africa Pty. Ltd., Johannesburg, South Africa4)
100.0
1,026
−236
−747
99 4
Quadrem Netherlands B.V., Amsterdam, the Netherlands
100.0
35,580
−2,479
51,819
Quadrem Overseas Cooperatief U.A., Amsterdam, the Netherlands
100.0
–
–
–
–
SAP Nederland B.V., ’s-Hertogenbosch, the Netherlands
100.0
461,938
30,690
444,768
447
SAP - NOVABASE, A.C.E., Porto Salvo, Portugal
66.7
–
–
–
–
SAP (Schweiz) AG, Biel, Switzerland
100.0
646,567
84,175
189,327
615
SAP (UK) Limited, Feltham, United Kingdom
100.0
817,002
71,681
53,687
1,266
Notes to the Consolidated Financial Statements
103
Assured As at December 31, 2013
Name and Location of Company
Ownership3)
Total Revenue in 20131)
Profit/ Loss (–) after Tax for 20131)
Total Equity as at 12/31/20131)
%
€(000)
€(000)
€(000)
Number of Employees as at 12/31/20132)
SAP Belgium NV/SA, Brussels, Belgium
100.0
205,283
5,751
125,761
SAP Bulgaria EOOD, Sofia, Bulgaria
100.0
2,991
349
1,228
248 1
SAP Business Services Center Europe s.r.o., Prague, Czech Republic
100.0
28,629
428
7,408
454
SAP Business Services Center Nederland B.V., Utrecht, the Netherlands
100.0
226,727
7,581
47,565
20
SAP Commercial Services Ltd., Valletta, Malta
100.0
–
0
−17
–
SAP ČR, spol. s r.o., Prague, Czech Republic
100.0
77,415
4,342
12,912
255
SAP Cyprus Ltd, Nicosia, Cyprus
100.0
3,045
−191
−2,274
2
SAP d.o.o., Zagreb, Croatia
100.0
7,251
194
−574
13
SAP Danmark A/S, Copenhagen, Denmark
100.0
165,362
12,769
22,120
164
SAP East Africa Limited, Nairobi, Kenya5)
100.0
–
6
2,502
–
SAP Egypt LLC, Cairo, Egypt
100.0
10,362
−3,475
−10,554
57
SAP EMEA Inside Sales S.L., Barcelona, Spain
100.0
14,020
285
3,119
97
SAP España – Sistemas, Aplicaciones y Productos en la Informática, S.A., Madrid, Spain
100.0
257,656
14,090
224,996
407
SAP Estonia OÜ, Tallinn, Estonia
100.0
2,216
−67
289
1
SAP Finland Oy, Espoo, Finland
100.0
114,921
6,413
63,879
109
SAP France Holding, Paris, France
100.0
873
36,109
5,169,074
3
SAP France, Paris, France
100.0
866,137
173,827
1,508,230
1,413
SAP Hellas S.A., Athens, Greece
100.0
27,699
1,191
11,208
51
SAP Holdings (UK) Limited, Feltham, United Kingdom5)
100.0
–
−15,993
731,275
–
SAP Hungary Rendszerek, Alkalmazások és Termékek az Adatfeldolgozásban Informatikai Kft., Budapest, Hungary
100.0
45,664
1,462
15,049
411
SAP Ireland Limited, Dublin, Ireland
100.0
702
41
9,725
–
SAP Ireland US-Financial Services Ltd., Dublin, Ireland
100.0
200
353,089
4,766,140
3
SAP Israel Ltd., Ra'anana, Israel
100.0
36,288
1,843
3,516
56
SAP Italia Sistemi Applicazioni Prodotti in Data Processing S.p.A., Milan, Italy
100.0
372,780
16,071
297,860
537 475
SAP Labs Bulgaria EOOD, Sofia, Bulgaria
100.0
24,595
775
4,947
SAP Labs Finland Oy, Espoo, Finland
100.0
6,515
160
41,517
45
SAP Labs France SAS, Mougins, France
100.0
57,194
2,861
18,638
350
SAP Labs Israel Ltd., Ra'anana, Israel
100.0
52,368
2,021
17,495
338
SAP Latvia SIA, Riga, Latvia
100.0
2,229
38
−185
3
SAP Malta Investments Ltd., Valletta, Malta
100.0
–
0
−17
–
49.0
167,892
−36,717
−55,309
337
SAP Middle East and North Africa L.L.C., Dubai, United Arab Emirates6) SAP Nederland Holding B.V., ’s-Hertogenbosch, the Netherlands
100.0
–
2
521,916
–
SAP Norge AS, Lysaker, Norway
100.0
89,951
3,523
22,322
89
SAP Österreich GmbH, Vienna, Austria
100.0
192,649
19,746
25,229
347
SAP Polska Sp. z o.o., Warsaw, Poland
100.0
63,228
3,985
22,358
107
SAP Portals Israel Ltd., Ra'anana, Israel
100.0
61,812
21,101
75,890
214
SAP Portugal – Sistemas, Aplicações e Produtos Informáticos, Sociedade Unipessoal, Lda., Porto Salvo, Portugal
100.0
70,026
7,327
18,136
207
104
Notes to the Consolidated Financial Statements
Assured As at December 31, 2013
Name and Location of Company
Ownership3)
Total Revenue in 20131)
Profit/ Loss (–) after Tax for 20131)
Total Equity as at 12/31/20131)
%
€(000)
€(000)
€(000)
Number of Employees as at 12/31/20132)
SAP Public Services Hungary Kft., Budapest, Hungary
100.0
4,284
549
1,306
7
SAP Romania SRL, Bucharest, Romania
100.0
27,044
2,298
5,311
270
SAP Saudi Arabia Software Services Ltd, Riyadh, Kingdom of Saudi Arabia
100.0
44,426
3,561
37,416
50
75.0
36,862
−25,350
−24,698
81
SAP Service and Support Centre (Ireland) Limited, Dublin, Ireland
100.0
80,598
2,899
34,430
884
SAP sistemi, aplikacije in produkti za obdelavo podatkov d.o.o., Ljubljana, Slovenia
100.0
13,920
844
3,561
22
SAP Slovensko s.r.o., Bratislava, Slovakia
100.0
37,036
2,532
15,373
180
SAP Svenska Aktiebolag, Stockholm, Sweden
100.0
166,507
7,525
15,933
154
SAP Training and Development Institute FZCO, Dubai, United Arab Emirates
100.0
4,532
−254
−437
36
SAP Türkiye Yazilim Üretim ve Ticaret A.S., Istanbul, Turkey
100.0
78,245
−10,007
10,138
155
SAP UAB (Lithuania), Vilnius, Lithuania
100.0
2,491
106
−58
3
0
–
258
22,932
–
100.0
16,177
2,389
7,595
29 100
SAP Saudi Arabia Software Trading Ltd, Riyadh, Kingdom of Saudi Arabia
SAPV (Mauritius), Ebene, Mauritius7) SAP West Balkans d.o.o., Belgrade, Serbia SuccessFactors (UK) Limited, London, United Kingdom
100.0
20,662
1,610
2,255
SuccessFactors Denmark ApS, Copenhagen, Denmark
100.0
1,687
171
279
4
SuccessFactors France SAS, Paris, France
100.0
9,109
290
573
45
SuccessFactors Ireland Limited, Dublin, Ireland
100.0
773
32
77
6
SuccessFactors Italy SRL, Milan, Italy
100.0
1,507
44
71
5
SuccessFactors Netherlands B.V., Amsterdam, the Netherlands
100.0
5,071
359
16,926
22
SuccessFactors Schweiz GmbH, Zurich, Switzerland
100.0
3,620
−257
−388
7
Sybase (UK) Limited, Maidenhead, United Kingdom11)
100.0
0
−4
327
–
Sybase France SARL, Paris, France
100.0
46,272
4,754
12,919
–
Sybase Iberia S.L., Madrid, Spain
100.0
–
2
65,920
–
89.5
–
38
75
–
Syclo International Limited, Leatherhead, United Kingdom 11)
100.0
510
977
0
–
Systems Applications Products Africa Region (Proprietary) Limited, Johannesburg, South Africa
100.0
81,563
10,920
23,403
39
Sybase South Africa (Proprietary) Limited, Johannesburg, South Africa
Systems Applications Products Africa (Proprietary) Limited, Johannesburg, South Africa
100.0
–
3,146
62,455
–
Systems Applications Products Nigeria Limited, Abuja, Nigeria
100.0
16,604
−907
2,953
43
89.5
227,424
−12,240
−5,707
455 –
Systems Applications Products South Africa (Proprietary) Limited, Johannesburg, South Africa The Infohrm Group Ltd., London, United Kingdom
100.0
88
223
−245
TomorrowNow (UK) Limited, Feltham, United Kingdom11)
100.0
–
0
0
–
TomorrowNow Nederland B.V., Amsterdam, the Netherlands
100.0
–
−9
−3,301
–
Notes to the Consolidated Financial Statements
105
Assured As at December 31, 2013
Name and Location of Company
Ownership3)
Total Revenue in 20131)
Profit/ Loss (–) after Tax for 20131)
Total Equity as at 12/31/20131)
%
€(000)
€(000)
€(000)
Number of Employees as at 12/31/20132)
AMERICAS 110405, Inc., Newtown Square, Pennsylvania, USA
100.0
–
0
15,150
Alliente, Inc., Pittsburgh, Pennsylvania, USA
100.0
–
–
–
– –
Ariba Canada, Inc., Mississauga, Canada
100.0
3,094
129
1,214
21
Ariba Holdings, Inc., Grand Cayman, Cayman Islands
100.0
–
–
–
–
Ariba, Inc., Sunnyvale, California, USA
100.0
299,460
−92,369
3,093,731
1,245
Ariba International Holdings, Inc., Wilmington, Delaware, USA
100.0
–
–
–
–
Ariba International, Inc., Wilmington, Delaware, USA
100.0
7,405
301
−1,722
43 –
Ariba Investment Company, Inc., Wilmington, Delaware, USA
100.0
–
2,638
210,474
Business Objects Argentina S.R.L., Buenos Aires, Argentina
100.0
–
0
49
–
Business Objects Option LLC, Wilmington, Delaware, USA
100.0
−33
2,032
63,668
–
Camilion Solutions, Inc., Markham, Canada5)
100.0
9,364
−3,017
31,701
114
Cube Tree LLC, San Mateo, California, USA
100.0
505
492
680
–
Extended Systems, Inc., Boise, Idaho, USA
99.0
–
32
16,513
–
Financial Fusion, Inc., Concord, Massachusetts, USA
100.0
–
–
–
–
FreeMarkets International Holdings Inc. de Mexico, de S. de R.L. de C.V., Mexico City, Mexico
100.0
–
–
−60
–
FreeMarkets Ltda., São Paulo, Brazil
100.0
52
−376
−464
–
hybris Canada, Inc., Montréal, Canada5)
100.0
13,492
723
254
244
hybris Software Brasil Ltda., Morumbi, Brazil5)
100.0
23
−389
−821
4
hybris (US) Corp., Wilmington, Delaware, USA5)
100.0
28,138
1,400
25,043
125
iAnywhere Solutions, Inc., Dublin, California, USA
99.0
75,212
36,253
172,933
43
Inxight Federal Systems Group, Inc., Wilmington, Delaware, USA
100.0
–
0
66
–
Jam Acquisition II LLC, San Mateo, California, USA
100.0
200
200
178
–
Jobs2Web, Inc., Minnetonka, Minnesota, USA
100.0
2,897
2,637
2,482
–
KXEN, Inc., San Francisco, California USA5)
100.0
531
−651
21,199
11
Plateau Systems LLC, Arlington, Virginia, USA
100.0
4,564
3,972
5,603
–
Quadrem Brazil Ltda., Rio de Janeiro, Brazil
100.0
23,672
2,001
7,370
175
Quadrem Canada Ltd., Mississauga, Canada
100.0
923
102
506
8
Quadrem Chile Ltda., Santiago de Chile, Chile
100.0
13,566
−677
1,732
187 3
Quadrem Colombia SAS, Bogotá, Colombia
100.0
240
−26
−33
Quadrem International Ltd., Hamilton, Bermuda
100.0
–
826
69,569
–
Quadrem Mexico S. de R. de C.V., Mexico City, Mexico
100.0
360
2
−38
3
Quadrem Peru S.A.C., Lima, Peru
100.0
2,803
−1,346
−2,105
89
Quadrem U.S., Inc., Plano, Texas, USA
100.0
–
–
–
–
SAP America, Inc., Newtown Square, Pennsylvania, USA
100.0
3,530,473
114,589
4,992,376
5,819
SAP Andina y del Caribe C.A., Caracas, Venezuela
100.0
14,481
−53,041
−35,312
26
SAP Argentina S.A., Buenos Aires, Argentina
100.0
172,462
−14,424
4,773
618
SAP Brasil Ltda, São Paulo, Brazil
100.0
553,602
−12,986
43,000
1,441
106
Notes to the Consolidated Financial Statements
Assured As at December 31, 2013
Ownership3)
Total Revenue in 20131)
Profit/ Loss (–) after Tax for 20131)
Total Equity as at 12/31/20131)
%
€(000)
€(000)
€(000)
SAP Canada, Inc., Toronto, Canada
100.0
708,115
50,265
470,548
SAP Chile Limitada, Santiago, Chile
100.0
–
1,015
13,618
–
SAP Colombia SAS, Bogotá, Colombia
100.0
129,544
−5,209
−15,589
216 13
Name and Location of Company
Number of Employees as at 12/31/20132)
2,201
SAP Costa Rica, S.A., San José, Costa Rica
100.0
14,550
−4,394
−4,404
SAP Financial, Inc., Toronto, Canada
100.0
–
25,202
6,738
–
SAP Global Marketing, Inc., New York, New York, USA
100.0
276,915
1,148
24,311
543
SAP HANA Real Time Fund, Wilmington, Delaware, USA7)
0
–
−904
−1,292
–
SAP Industries, Inc., Newtown Square, Pennsylvania, USA
100.0
468,227
40,420
396,489
446
SAP International, Inc., Miami, Florida, USA
100.0
29,221
−3,806
8,615
65
SAP International PANAMA S.A., Panama City, Panama5)
100.0
234
−30
334
2
SAP Investments, Inc., Wilmington, Delaware, USA
100.0
–
25,169
666,458
–
SAP LABS, LLC, Palo Alto, California, USA
100.0
545,498
10,662
221,018
2,184
SAP México S.A. de C.V., Mexico City, Mexico
100.0
306,180
8,737
−18,242
569
SAP National Security Services, Inc., Newtown Square, Pennsylvania, USA
100.0
178,593
35,723
173,364
268
SAP PERU S.A.C., Lima, Peru
100.0
29,648
−3,248
4,846
55
SAP Public Services, Inc., Washington, D.C., USA
100.0
288,791
13,780
256,245
202
SAP Technologies Inc., Palo Alto, California, USA
100.0
–
–
–
–
0
–
31,690
110,261
–
SAP Ventures Fund I, L.P., Wilmington, Delaware, USA7) SAP Ventures Fund II, L.P., Wilmington, Delaware, USA5), 7)
0
–
−2,630
−2,584
–
SuccessFactors, Inc., San Mateo, California, USA
100.0
413,455
−173,389
2,406,889
1,373
SuccessFactors Brasil Consultoria e Assistência em Vendas Limitada, São Paulo, Brazil
100.0
6,571
−332
−272
28
SuccessFactors Canada Inc., Ottawa, Canada
100.0
8,564
254
580
33
SuccessFactors Cayman, Ltd., Grand Cayman, Cayman Islands
100.0
–
–
208
–
SuccessFactors de México, S. de R.L. de C.V., Mexico City, Mexico
100.0
4,175
138
155
19
SuccessFactors International Holdings, LLC, San Mateo, California, USA
100.0
–
–
102
–
SuccessFactors International Services, Inc., San Mateo, California, USA
100.0
3,486
168
286
7
SuccessFactors Middle East Holdings, LLC, San Mateo, California, USA
100.0
–
–
–
–
Surplus Record, Inc., Chicago, Illinois, USA
100.0
3,006
755
7,757
–
Sybase 365 LLC, Dublin, California, USA
100.0
101,570
1,192
57,218
116
Sybase 365 Ltd., Tortola, British Virgin Islands
100.0
–
0
−908
–
Sybase Argentina S.A., Buenos Aires, Argentina
100.0
–
−112
703
–
Sybase Global LLC, Dublin, California, USA
100.0
–
–
7,064
–
Sybase Intl Holdings LLC, Dublin, California, USA
100.0
–
0
11,346
–
Sybase, Inc., Dublin, California, USA
100.0
547,633
252,904
4,375,352
1,031
The Inforhrm Group, Inc., Washington, Columbia, USA
100.0
34
−6
−24
–
TomorrowNow, Inc., Bryan, Texas, USA
100.0
–
−1,454
−179,441
3
YouCalc, Inc., San Mateo, California, USA
100.0
–
–
–
–
Notes to the Consolidated Financial Statements
107
Assured As at December 31, 2013
Ownership3)
Total Revenue in 20131)
Profit/ Loss (–) after Tax for 20131)
Total Equity as at 12/31/20131)
%
€(000)
€(000)
€(000)
Ariba (China) Limited, Hong Kong, China
100.0
–
–
–
Ariba Australia Pty Ltd., Sydney, Australia
100.0
–
−21
−1
–
Ariba India Pvt. Ltd., Gurgaon, India
100.0
4,707
708
2,299
42
Ariba International Singapore Pte. Ltd., Singapore, Singapore
100.0
4,125
63
−4,894
19
Ariba Software Technology Services (Shanghai) Co. Ltd., Shanghai, China
100.0
828
10
592
2
Ariba Technologies India Pvt. Ltd., Bangalore, India
100.0
18,948
1,716
6,233
561 7
Name and Location of Company
Number of Employees as at 12/31/20132)
ASIA PACIFIC JAPAN
Beijing Zhang Zhong Hu Dong Information Technology Co. Ltd., Beijing, China6)
–
0
1,032
−2
849
Business Objects Malaysia Sdn. Bhd., Kuala Lumpur, Malaysia
100.0
–
−2
238
–
Business Objects Software (Shanghai) Co. Ltd., Shanghai, China
100.0
6,746
354
7,846
84
hybris Australia Pty Limited, Surry Hills, Australia5)
100.0
2,638
199
232
18
hybris Hong Kong Ltd., Hong Kong, China5)
100.0
1,579
528
510
8
hybris Japan K.K., Tokyo, Japan5)
100.0
972
195
−111
7
hybris Korea Ltd., Seoul, South Korea5)
100.0
545
−1,148
−292
3
Nihon Ariba K.K., Tokyo, Japan
100.0
2,332
136
1,426
13
Plateau Systems Australia Ltd, Brisbane, Australia
100.0
–
–
−710
–
Plateau Systems Pte. Ltd., Singapore, Singapore
100.0
–
–
−469
–
PT SAP Indonesia, Jakarta, Indonesia
99.0
50,527
3,289
2,690
55
PT Sybase 365 Indonesia, Jakarta, Indonesia
100.0
0
−44
278
–
Quadrem Asia Pte. Ltd., Singapore, Singapore
100.0
63
7
119
–
Quadrem Australia Pty Ltd., Brisbane, Australia
100.0
3,754
315
971
21
Quadrem China Ltd., Hong Kong, China
100.0
–
–
13
–
Right Hemisphere Ltd., Auckland, New Zealand
100.0
1,538
1,647
5,739
–
Ruan Lian Technologies (Beijing) Co. Ltd., Beijing, China
100.0
81
7
−921
1
SAP (Beijing) Software System Co. Ltd., Beijing, China
100.0
544,297
−10,691
24,902
3,697
SAP Asia Pte Ltd, Singapore, Singapore
100.0
360,926
7,880
84,461
1,023
SAP Asia (Vietnam) Co. Ltd., Ho Chi Minh City, Vietnam
100.0
1,449
24
538
42
SAP Australia Pty Ltd, Sydney, Australia
100.0
479,267
25,552
243,608
770
SAP Hong Kong Co. Limited, Hong Kong, China
100.0
55,271
−905
−1,276
87
SAP India (Holding) Pte Ltd, Singapore, Singapore
100.0
–
−7
275
–
SAP India Private Limited, Bangalore, India
100.0
383,854
36,544
212,004
1,892
SAP Japan Co. Ltd., Tokyo, Japan
100.0
620,435
32,575
412,555
1,050
SAP Korea Ltd., Seoul, South Korea
100.0
202,190
7,879
25,871
313
SAP Labs India Private Limited, Bangalore, India
100.0
184,569
3,010
711
4,632
SAP Labs Korea, Inc., Seoul, South Korea
100.0
13,968
439
17,388
125
SAP Malaysia Sdn. Bhd., Kuala Lumpur, Malaysia
100.0
92,273
4,885
25,849
117
SAP New Zealand Limited, Auckland, New Zealand
100.0
73,758
6,272
41,068
97
SAP Philippines, Inc., Makati, Philippines
100.0
34,754
−705
1,816
44
108
Notes to the Consolidated Financial Statements
Assured As at December 31, 2013
Ownership3)
Total Revenue in 20131)
Profit/ Loss (–) after Tax for 20131)
Total Equity as at 12/31/20131)
%
€(000)
€(000)
€(000)
SAP SYSTEMS, APPLICATIONS AND PRODUCTS IN DATA PROCESSING (THAILAND) LTD., Bangkok, Thailand4)
100.0
68,015
−275
11,303
SAP Taiwan Co. Ltd., Taipei, Taiwan
100.0
59,114
4,723
34,776
84
Shanghai SuccessFactors Software Technology Co., Ltd., Shanghai, China
100.0
11,418
288
1,038
166
SuccessFactors (Philippines), Inc., Pasig City, Philippines
100.0
2,100
−60
56
82
SuccessFactors Asia Pacific Limited, Hong Kong, China
100.0
5
0
212
–
SuccessFactors Australia Holdings Pty Ltd., Brisbane, Australia
100.0
–
−4,795
9,592
–
SuccessFactors Australia Pty Limited, Brisbane, Australia
100.0
20,413
2,475
36,112
94
SuccessFactors Business Solutions India Private Limited, Bangalore, India
100.0
7,798
353
636
167
SuccessFactors Hong Kong Limited, Hong Kong, China
100.0
2,755
105
184
11
SuccessFactors Japan K.K., Tokyo, Japan
100.0
3,001
−143
−15
14
SuccessFactors Korea Ltd., Seoul, South Korea
100.0
23
1
35
–
SuccessFactors Singapore Pte. Ltd., Singapore, Singapore
100.0
3,150
141
217
11
Sybase Australia Pty Ltd, Sydney, Australia
100.0
–
−17,015
107
–
Sybase Hong Kong Ltd, Hong Kong, China
100.0
–
74
422
–
Sybase India Ltd., Mumbai, India
100.0
–
−9
2,112
–
Sybase Philippines, Inc., Makati City, Philippines
100.0
–
15
−8
–
Sybase Software (China) Co. Ltd., Beijing, China
100.0
33,119
1,026
17,265
331
Sybase Software (India) Private Ltd, Mumbai, India
100.0
17,269
1,110
8,382
219
TomorrowNow Australia Pty Ltd, Sydney, Australia
100.0
–
−1
–
–
TomorrowNow Singapore Pte Ltd, Singapore, Singapore
100.0
–
−7
–
–
Name and Location of Company
Notes to the Consolidated Financial Statements
Number of Employees as at 12/31/20132)
60
109
Assured As at December 31, 2013
Name and Location of Company
Ownership3)
Total Revenue in 20131)
Profit/ Loss (–) after Tax for 20131)
Total Equity as at 12/31/20131)
%
€(000)
€(000)
€(000)
Number of Employees as at 12/31/20132)
II. INVESTMENTS IN ASSOCIATES Alteryx, Inc., Irvine, California, USA
15.42
21,168
−4,781
−728
171
China DataCom Corporation Limited, Guangzhou, China
28.30
47,689
4,456
37,361
1,049 –
Greater Pacific Capital (Cayman) L.P., Grand Cayman, Cayman Islands12)
5.35
497
−822
285,845
Original1 GmbH, Frankfurt am Main, Germany13)
40.00
–
–
–
–
Procurement Negócios Eletrônicos S/A, Rio de Janeiro, Brazil
17.00
23,033
1,063
12,655
–
�These figures are based on our local IFRS financial statements prior to eliminations resulting from consolidation and therefore do not reflect the contribution of these companies included in the Consolidated Financial Statements. The translation of the equity into Group currency is based on period-end closing exchange rates, and on average exchange rates for revenue and net income/loss. 2) �As at December 31, 2013, including managing directors, in FTE. 3) �No changes in ownership percentage unless otherwise specified in the footnotes. 4) �During the year 2013, SAP's ownership of the following subsidiary changed: SAP SYSTEMS, APPLICATIONS AND PRODUCTS IN DATA PROCESSING (THAILAND) LTD., Bangkok, Thailand (2012: 49%); Quadrem Africa Pty. Ltd., Johannesburg, South Africa (2012: 49%). 5) �Consolidated for the first time in 2013. 6) �Agreements with the other shareholders provide that SAP AG fully controls the entity. 7) �SAP AG does not hold any ownership interests in four structured entities, SAPV (Mauritius), SAP HANA Real Time Fund, SAP Ventures Fund I, L.P. and SAP Ventures Fund II, L.P. However, based on the terms of limited partnership agreements under which these entities were established, SAP AG is exposed to the majority of the returns related to their operations and has the current ability to direct these entities' activities that affect these returns, in accordance with IFRS 10. Accordingly, the results of operations are included in SAP’s consolidated financial statements. 8) �Entity whose personally liable partner is SAP AG. 9) �Entity with profit and loss transfer agreement. 10) �Pursuant to HGB, section 264 (3) or section 264b, the subsidiary is exempt from applying certain legal requirements to their statutory stand-alone financial statements including the requirement to prepare notes to the financial statements and a review of operations, the requirement of independent audit and the requirement of public disclosure. 11) �Pursuant to sections 479A to 479C of the UK Companies Act 2006 the subsidiaries are exempt from having their financial statements audited on the basis that SAP AG has provided a guarantee of these subsidiaries' liabilities in respect of their financial year ended 31 December 2013. 12) �Greater Pacific Capital (Cayman) is part of a fund-of-funds concept acting as one of the feeder-funds to the partnership. There are neither financial statements for the year ended December 31, 2013 nor budget or forecast available hence the information provided is based on the audited financial statements for the year ended December 31, 2012. 13) �Original1 GmbH is in liquidation and it has not been deregistered from the commercial register yet. 1)
110
Notes to the Consolidated Financial Statements
Assured As at December 31, 2013
Name and Location of Company III. OTHER EQUITY INVESTMENTS (ownership of 5% or more) Alchemist Accelerator Fund I LLC, San Francisco, California, USA All Tax Platform - Solucoes Tributarias S.A., São Paulo, Brazil Amplify Partners L.P., Cambridge, Massachusetts, USA ArisGlobal Holdings LLC, Stamford, Connecticut, USA Connectiva Systems, Inc., New York, New York, USA Convercent, Inc., Denver, Colorado, USA Data Collective II L.P., San Francisco, California, USA EIT ICT Labs GmbH, Berlin, Germany Five 9, Inc., San Ramon, California, USA Follow Analytics, Inc., San Francisco, California, USA GK Software AG, Schöneck, Germany InnovationLab GmbH, Heidelberg, Germany iTAC Software AG, Dernbach, Germany iYogi Holdings Pvt. Ltd., Port Louis, Mauritius JasperSoft Corporation, San Francisco, California, USA Lavante, Inc., San José, California, USA MuleSoft, Inc., San Francisco, California, USA MVP Strategic Partnership Fund GmbH & Co. KG, Grünwald, Germany Narrative Science, Inc., Chicago, Illinois, USA On Deck Capital, Inc., New York, New York, USA Onventis GmbH, Stuttgart, Germany Patent Quality, Inc., Bellevue, Washington, USA PayScale, Inc., Seattle, Washington, USA Point Nine Capital Fund II GmbH & Co. KG, Berlin, Germany Post for Systems, Cairo, Egypt Realize Corporation, Tokyo, Japan Retail Solutions, Inc. (legal name: T3C, Inc.), Mountain View, California, USA Return Path, Inc., New York, New York, USA RIB Software AG, Stuttgart, Germany Smart City Planning, Inc., Tokyo, Japan SV Angel IV L.P., San Francisco, California, USA Technologie- und Gründerzentrum Walldorf Stiftung GmbH, Walldorf, Germany The SAVO Group Ltd., Chicago, Illinois, USA Ticketfly, Inc., San Francisco, California, USA Vendavo, Inc., Mountain View, California, USA
Notes to the Consolidated Financial Statements
111