CIRP – Life Cycle Seminar 2002
Life Cycle Management for Improving Product Service Quality Fumihiko Kimura and Satoru Kato The University of Tokyo Hongo 7-3-1, Bunkyo-ku, Tokyo 113-8656, Japan Emai:
[email protected]
Abstract For achieving better environmental performance of products or product systems, it is essential to manage total product life cycle. This paper describes a method for supporting product life cycle management by comprehensive product life cycle simulation, which is a basis for designing and evaluating total product life cycle. For life cycle evaluation, it is important to seek for the better product services, at the same time to seek for lower environmental burden and life cycle management costing. For this purpose, a product usage model is proposed, where customer satisfaction is measured by offered product functionality. The same level of customer satisfaction can be achieved by various different life cycle management options, for instance, long-life maintenance centered products or short-life maintenance-free products. By taking examples of technologically immature short-life products, like mobile phones, effect of difference of required product service quality is investigated, and appropriate product management strategy is discussed for improving product service quality. Keywords: Life Cycle Management, Life Cycle Simulation, Reuse, Take-Back, Eco-design, 1
Introduction In order to be competitive in the global market of consumers’ products, it is now essentially important to be technologically advanced with respect to product functionality and service providing capability, and at the same to be environmentally conscious in product manufacturing and life cycle operations. It is difficult to achieve this target only by optimising an individual product. It is rather essential to design the total product life cycle as a whole from product planning, throughout product design and manufacturing, to product usage, maintenance and reuse/recycling/disposal[1,2]. A sound strategy for product maintenance and improvement during product usage should be established, and all the life cycle processes are to be well controlled. By such approach, reuse/recycling activities are also rationalized. A whole product life cycle can be made visible and controllable. We have called such approach as Inverse Manufacturing by stressing the controllability of reuse/recycling processes, where closed product life cycles, including maintenance, are pre-planned and controlled [3]. It is essentially important to realize a pre-designed closed product life cycle, and to manage it for less products and energy flow without excessive overhead load. This concept has been well implemented for large scale industrial products and facilities, but not for mass-1-
CIRP – Life Cycle Seminar 2002
produced consumers' goods. For improving this situation, we have proposed a methodology for design and management of a closed product life cycle, based on the following idea: promoting the information sharing among manufacturers and users, motivating users to participate in design and management activities, incorporating product take-back processes into product basic functionality, and innovating a concept and structure of products and their life cycle. In this paper, our approach and a method for environmentally better life cycle management is summarized. And a possibility is investigated, based on life cycle simulation, for improving product service quality while keeping the environmental efficiency by use of unusual life cycle management options. 2
Coordination of Product Life Cycle with Product Usage Mode For environmentally conscious manufacturing, it is not enough to close a life cycle, but it is strongly necessary to really make such closed product cycle as efficient as possible from the standpoint of the reduction of energy and other resource consumption. For achieving this objective, it is effective to reduce the total physical product flow in this cycle, and to minimize the required management overhead for used product flow. At the same time, it is important to keep the level of services of products for customers. The idea of service engineering has come up from such general consideration, where customers actually want to buy "services" instead of "physical products". Physical products are merely media for conveying required services.
Major sources of inefficiency of closed product life cycle are considered as follows:(1) unexpected early disposal of products, (2) non-use or idle products in users' hands, (3) longterm use of old and inefficient products, (4) life cycle management overhead, particularly maintenance and take-back cycles. These inefficiencies cannot be diminished by just improving individual product performance. Even if product performance is satisfactory, people dispose products if they find attractive new products. People continue to use old and inefficient products with no particular reason but just due to no product failure. All such inefficiencies can be understood to occur due to the incompatibility of the planned product life cycle and actual product usage style of customers. Here we shall call such product usage style of customers as product usage modes. Today manufacturers normally do not explicitly explain the pre-planned product life cycle, or feasible/ appropriate product usage modes for products. Therefore customers are forced to make arbitrary decision how to select appropriate products for their particular needs. For instance, it is fairly difficult to determine an optimal air-conditioner for specific family life style, or to make proper decision when to buy new mobile phones with changing functionality. Traditionally commodity durable goods are mass-produced products sold to customers, and with no maintenance or other life cycle care. Due to the cost reason, such life cycle care cannot be considered realistic with traditional technology. However it is now feasible to connect all such household appliances, information devices, commodity products and cars via communication network and some kind of remote ID tags, and to efficiently manage their total life cycle. With such possibility in mind, we shall consider a top-down iterative
-2-
CIRP – Life Cycle Seminar 2002
methodology to design better products by appropriate life cycle management, that is, coordination of manufacturers' product life cycle with customers' product usage modes. 3
A Method for Design and Management of Product Life Cycle The proposed top-down iterative design method consists of the following four steps:
(1)
Proposal of product usage modes and associated life cycle scenarios based on manufacturers' capability and customers' requirements.
(2)
Design and evaluation of proposed product life cycle by simulation of product flow and services in the life cycle.
(3)
Design of product modular structure and individual components adapted to the proposed life cycle and usage modes.
(4)
More detailed evaluation of product usage support by maintenance during product operation.
Steps (1) to (4) are repeatedly performed to achieve satisfactory design results. For realizing enough computer support for the above steps, it is mandatory to implement comprehensive product life cycle modeling and associated life cycle simulation. Current product modeling technology can deal with design and manufacturing preparation processes, but it is very weak for coping with product usage phases and recycling/disposal phases. For instance, it still requires extensive study how to represent product deterioration and its effect on total product life cycle performance. In the following sections, steps (1) and (2) are explained with some examples. 4
Product Usage Modes and Life Cycle Scenario The first important step of life cycle design is to identify characteristics and differences of product usage modes of customers. There seems to be very different usage modes for the same products. Characteristic factors are: - Long use or short use, - Heavy use or light use, - High functionality or common functionality, - Aesthetics or non-functional appeal, - Initial investment or operational cost, - Expensive(high-quality) or cheap, etc. Traditionally those factors are considered trivially seen from products. But, for today's products, those factors are not so easy to identify for normal customers. Associated with those product usage modes, appropriate product life cycles should be proposed by manufacturers. Particular pattern of product life cycle is called as life cycle scenario. Life cycle scenario is characterized by the following factors: -
Closed loop shape: simple or complicated take-back loop,
-
Speed and volume of product flow,
-
Re-use, recycle or disposal, -3-
CIRP – Life Cycle Seminar 2002
-
Maintenance-free or heavy maintenance,
-
Purchase or rental/lease,
-
With or without upgrade, etc.
It is often considered that long life products are generally good for reducing environmental burden. It is true, if those products are on proper operational condition, and coincide with product usage modes. If products are not fitted with customers' usage modes, they are simply left idle, and eventually inappropriately disposed. In this sense, it is not simple to determine appropriate life cycle scenario according to the required usage modes. 5
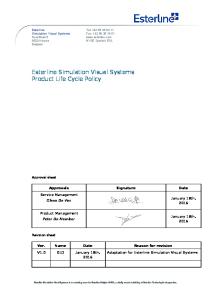
Improving Life Cycle Scenario by Life Cycle Simulation For designing appropriate product life cycle with respect to the intended usage mode, it is necessary to perform a computer simulation of total product life cycle behaviour under the supposed usage mode and market situations. The basic method for life cycle simulation was discussed in our previous papers[4,5]. Primarily the long term planning of life cycle management for durable goods has been investigated. In this paper, as an example of life cycle simulation, short term life cycle management issues are considered for technologically immature products, such as mobile phones[6]. The main objective of this life cycle simulation is to show the possibility to improve product service quality without damaging the environmental consciousness by adopting rather unusual life cycle management options, such as forced short term product take-back. It is clear that such unusual options are not valid under the today’s market and production conditions. The aim of this simulation is to see whether there could be some possibility of market and production conditions by which such unusual options are really valid in economical and product service viewpoint. Here we consider the following cases. Mobile phone market is simulated over 5 years. 7 different kinds of phones(Phone#1 to Phone#7) appear during this period. Phnone#1 is simple and cheap. Phone#7 is functionally powerful and expensive. As shown in Fig.1, those phones consist of 4 major modules, liquid crystal displays(5 different types), printed circuit boards(3 different types), an exterior case and a battery. By assembling different modules, 7 different types of phones are produced. We assume that liquid crystal displays and printed circuit boards can be reused for new product manufacturing under certain quality condition. If appropriate, whole products are reused, after quality check, by replacing exterior cases and battery. According to users’ behaviour and market/logistics conditions, used phones are just disposed, or taken back and recycled/reused. In this life cycle simulation, the following product usage modes and life cycle scenarios are considered: Scenario1: 40% of used phones are taken back, and recycled. The rest of used phones are disposed. This is a current situation in Japan. Scenario2: The higher take-back rate is assumed from 40 % to 100%. Used phones are simply recycled, or reused as parts or products, based on production and logistics conditions.
-4-
CIRP – Life Cycle Seminar 2002
PARTS - Liquid Crystal Display (5 types) - Printed Circuit Board (3 types)
PRODUCTS
USAGE
Mobile Phone (7 types)
Usage Mode (3 types)
- Disposal - TakeBack Recycle Disassembly Reuse (Parts) (Product)
- Case (1 type) - Battery (1 type)
Fig.1: Life cycle of mobile phones Scenario3: After pre-determined usage period, such as half a year or two years, compulsory tack-back is performed. Comprehensive pre-planned reuse/recycle can be done. We assume two kinds of users: User1(users who like to posses always new and functionally powerful phones) and User2(users who try to use the same phones as long as possible). Here assumed that 60% of users belongs to User1, and 40% to User2. The criteria for evaluating environmental efficiency is as follows: amount of disposed materials, parts and products reuse rate, manufacturers’ and users’ cost, etc. Under the above assumptions, simulation is performed based on an event-driven method. Users’ buying and disposing actions occur every week based on certain statistical models. Phones under usage have some deterioration and defects, and users make decision whether to buy new ones or to keep using the same ones. According to the logistics and production situations, taken-back phones are disassembled for parts reuse or simply disposed. The whole simulation process is complicated and computationally time-consuming. The results of simulation shall be interpreted macroscopically and qualitatively to evaluate comparatively the possible merit of different life cycle options. Some of the results of simulation are shown in Fig.2 and Fig.3. Here no detailed explanation is given, but Fig.2 shows that higher take-back rate tends to reduce possible reuse rate. Therefore appropriate logistics and production scheduling is important. Fig.3 shows possible merits of Scenario2 and Scenario3 compared with Scenario1. In Scenario2 and Scenario3, product price is kept constant. Scenario2’ and Scenario3’ mean that manufacturers profit is kept constant. The numerals along the horizontal axis mean % value of take-back rate. This figure indicates there could be a possibility for better life cycle scenarios with a certain unusual life cycle management method. Conclusions An approach to life cycle design and management is discussed, and an example of life cycle simulation is shown for demonstrating the possibility to improve product service quality by rather unusual life cycle management options. The simulation is performed for short-life technologically immature products. The result can be generalized for various kinds of durable consumers goods. Further consideration is necessary how to extend the concept of product
-5-
CIRP – Life Cycle Seminar 2002
service quality for separating the real contents of services and the service careers which are normally physical objects and environmentally sensitive. Acknowledgments The result of this paper is based on the thesis work by Mr.T.Hata and Mr.N.Mitsumune. Their contribution is highly appreciated. References [1] [2]
Alting, L., Legarth, J.B., 1995, Life Cycle Engineering and Design, Annals of CIRP, 44/2:569-580. Westkaemper, E., Alting, L., Arndt, G., 2000, Life Cycle Management and Assessment: Approaches and Vision Towards Sustainable Manufacturing, Annals of CIRP, 49/2:501-522. Kimura, F., 1999, Life Cycle Design for Inverse Manufacturing, Proc. EcoDesign'99, IEEE, Tokyo, 995-999. Hata, T., Kato, S., Sakamoto, H., Kimura, F., Suzuki, H., 2000, Product Life Cycle Simulation with Quality Model, Proc.7th CIRP Int. Seminar on Life Cycle Engineering, Tokyo, 60-67. Hata, T., 2002, A Method for Life Cycle Design to Improve Service Quality Management, Thesis, The University of Tokyo. Mitsumune, N., 2002, Life Cycle Simulation for Planning Reuse Strategy, Thesis, The University of Tokyo.
[3] [4] [5] [6]
100.0% P#7
90.0%
Product Reuse Rate
P#3
80.0%
P#2
70.0%
P#4
60.0%
P#6
50.0%
P#1 P#5
40.0% 30.0% 20.0%
P#i: Phone#i
10.0% 0.0% 40
50
60
70
80
90
100
Used Product Take-Back Rate (%)
Fig.2: Product reuse rate according to product take-back rate
Comparison with Scenario1
300%
Cost for User2 200% Amount of Disposal Manufacturers' Cost User Cost 100%
0% 40
100 Scenario2
40
100 Scenario2'
25
50 Scenario3
Fig.3: Comparative evaluation of different scenarios -6-
25
50 Scenario3'


![Product Life cycle. Product life cycle and the Product Life Cycle Curve [PLC]](https://kipdf.com/img/300x300/product-life-cycle-product-life-cycle-and-the-prod_5ac29f511723dd94208541f2.jpg)