APPLIED AND ENVIRONMENTAL MICROBIOLOGY, Nov. 1997, p. 4485–4493 0099-2240/97/$04.0010 Copyright © 1997, American Society for Microbiology
Vol. 63, No. 11
Biodiversity of a Burkholderia cepacia Population Isolated from the Maize Rhizosphere at Different Plant Growth Stages F. DI CELLO,1† A. BEVIVINO,1 L. CHIARINI,1 R. FANI,2 D. PAFFETTI,2 S. TABACCHIONI,1 1 AND C. DALMASTRI * Dipartimento Innovazione, ENEA (Ente Nazionale per le Nuove Tecnologie, l’Energia e l’Ambiente) C. R. Casaccia, ` degli 00060 Rome,1 and Dipartimento di Biologia Animale e Genetica, Universita Studi di Firenze, 50125 Florence,2 Italy Received 27 March 1997/Accepted 31 August 1997
A Burkholderia cepacia population naturally occurring in the rhizosphere of Zea mays was investigated in order to assess the degree of root association and microbial biodiversity at five stages of plant growth. The bacterial strains isolated on semiselective PCAT medium were mostly assigned to the species B. cepacia by an analysis of the restriction patterns produced by amplified DNA coding for 16S rRNA (16S rDNA) (ARDRA) with the enzyme AluI. Partial 16S rDNA nucleotide sequences of some randomly chosen isolates confirmed the ARDRA results. Throughout the study, B. cepacia was strictly associated with maize roots, ranging from 0.6 to 3.6% of the total cultivable microflora. Biodiversity among 83 B. cepacia isolates was analyzed by the random amplified polymorphic DNA (RAPD) technique with two 10-mer primers. An analysis of RAPD patterns by the analysis of molecular variance method revealed a high level of intraspecific genetic diversity in this B. cepacia population. Moreover, the genetic diversity was related to divergences among maize root samplings, with microbial genetic variability markedly higher in the first stages of plant growth; in other words, the biodiversity of this rhizosphere bacterial population decreased over time. Microbial populations can undergo temporary variations in genetic structure due to selective pressure exerted by the environment, which causes genetic exchanges within a local population and migrations between distinct populations. The knowledge of the genetic structure of a bacterial population in the rhizosphere can help in relating its changes to environmental variations over time (39, 51). For example, it is well-known that production and diffusion of root exudates, which represent nutritional sources for rhizosphere microorganisms (4, 36), are affected by plant development (20). Thus, the composition and activity of rhizosphere microflora are likely to be altered as a function of time because of changes that occur in the exudation patterns of roots as plants age. As a consequence, the development of more adapted microorganisms may be favored, thus resulting in genotype selection. An understanding of the mutual influence between rhizosphere environment and genetic diversity patterns of local microbial populations seems to be a requirement for evaluating the impact produced by a microbial inoculum which could affect a preexisting balance among indigenous populations. Therefore, an analysis of the genetic structure of a microbial population has practical importance; the results can be used to assess the fate of released strains and their impact on resident microbial communities. The aim of this work was to analyze the genetic diversity of Burkholderia cepacia, a bacterial species which seems to be closely associated with Zea mays roots, representing over 4% of the total culturable rhizobacteria (21). B. cepacia strains have previously been reported to promote plant growth (21, 41) and to antagonize and repress soilborne maize pathogens, such as those belonging to the genus Fusarium (6). These properties make B. cepacia an attractive subject for studies of plant-microbe interactions. As B. cepacia is also known as an opportunist pathogen in patients with cystic fibrosis, preliminary studies have been made to provide evidence of differences among clinical and environmental isolates and to assess the risk associated with the use of rhizosphere isolates. A comparison of phenotypic traits among B. cepacia strains of different
The study of the genetic structures of microbial populations is important not only for understanding their ecological role in natural environments but also any biotechnological application, in which it is necessary to predict the fate of genetically engineered microorganisms released into the environment and to identify the source of epidemic outbreaks of pathogenic bacteria (52). In recent years, the interest in soil microorganisms has increased, as they are a key factor in nutrient cycling and the maintenance of soil fertility. Moreover, rhizobacteria which establish positive interactions with plant roots, plant growth-promoting rhizobacteria (PGPR), play a key role in agricultural environments and are promising for their potential use in sustainable agriculture (7). Bacterial root colonization is affected by biotic and abiotic factors, such as dynamics of microbial populations in the rhizosphere, plant characteristics, and soil types. An analysis of genotypic and phenotypic characteristics of indigenous rhizobacteria can help to clarify the mechanisms of interaction between them and plant roots. This comprehension may represent the basis for the utilization of PGPR as inoculants because successful establishment in the rhizosphere depends on their ability to colonize roots and to compete with indigenous microflora (27). Furthermore, any microbial utilization in agriculture requires an evaluation of the environmental risks associated with the introduction of indigenous or nonindigenous microorganisms into the plant rhizosphere (24) as well as an assessment of the most suitable conditions for effective and successful establishment of the PGPR inoculum in the rhizosphere of the host plant (8, 9). The approach to both problems is based on an accurate characterization of bacterial populations naturally associated with roots. * Corresponding author. Mailing address: ENEA-C.R. Casaccia, Dipartimento Innovazione-Divisione Biotecnologie e Agricoltura, Via Anguillarese 301, 00060 S. Maria di Galeria, Rome, Italy. Phone: 39 6 30483196. Fax: 39 6 30484808. E-mail:
[email protected]. † Present address: Dipartimento di Biologia Animale e Genetica, Universita` degli Studi di Firenze, 50125 Florence, Italy. 4485
4486
DI CELLO ET AL.
origins (1) and an investigation of their genetic diversity (41) showed important differences among rhizospheric and clinical strains. Further studies are necessary to elucidate the mechanisms involved in root association and in human pathogenicity and to better type different B. cepacia isolates. Furthermore, B. cepacia is characterized not only by an extraordinary nutritional versatility but also by an unusual genomic organization (29). In fact, the B. cepacia genome contains multiple chromosomes, each regulated by a separate control system and whose number and size vary among isolates. B. cepacia also harbors an extensive array of insertion sequences (IS elements), which contribute significantly to determining the genomic plasticity which plays an important role in the capacity of this species to evolve new functions and to adapt to different environments. Therefore, it is very interesting to investigate the influences of various conditions and environmental stress on genetic rearrangements and variability to provide insights into the high metabolic versatility of B. cepacia species. In this work, we investigated the root colonization and genetic diversity of a B. cepacia population associated with maize roots during plant development in one growing season. Analyses of B. cepacia strains were carried out at various stages of maize growth with the following three objectives: (i) to assess the degree of association between the indigenous B. cepacia population and maize roots throughout plant development, (ii) to investigate the genetic variability of this B. cepacia population, and (iii) to evaluate the influence of plant development on bacterial biodiversity. Several classical and/or molecular techniques are available for identifying and analyzing the biodiversity of bacterial strains of a natural population; they include Biolog automated analysis (26), multilocus enzyme electrophoresis techniques (51, 52), PCR ribotyping (28), analysis of enterobacterial repetitive intergenic consensus sequences amplified by PCR (5, 46), insertion element (IS) fingerprinting (46), and the random amplified polymorphic DNA (RAPD) method (14, 19, 47, 50). In the present work, the identification and analysis of genetic polymorphisms of B. cepacia strains isolated from maize roots were carried out by a combination of molecular, PCR-based techniques which had previously been successfully applied to studies of bacterial populations isolated from different natural environments (11, 12, 17). The strategy adopted required the following sequential steps. (i) Strains isolated from maize roots were firstly grouped into clusters corresponding to bacterial species on the basis of analysis of restriction patterns of DNA coding for 16S rRNA (16S rDNA) amplified by means of PCR (ARDRA) (10, 17, 18, 25, 43–45). DNA digestion was performed by using the tetrameric restriction enzyme AluI, which seems to generate species-specific restriction patterns, as previously shown (11, 12, 17, 32). (ii) Strains were assigned to a bacterial species by comparing their restriction patterns with those of reference strains; furthermore, nucleotide sequencing of the 16S rDNAs of some representatives of each ARDRA pattern were carried out. (iii) Biodiversity among strains assigned to the species B. cepacia was checked by the RAPD technique (14, 47, 50), and the data obtained were further analyzed by the analysis of molecular variance (AMOVA) method (13). MATERIALS AND METHODS Isolation of B. cepacia strains. Maize plants (cv. Fir) were cultivated in an experimental field with no previous cropping history of maize, located at S. Maria di Galeria, Rome, Italy. The soil composition was as follows: sand, 47%; clay, 39%; silt, 14%; organic C, 2.38% (wt/wt); the pH was 6.04, and the moisture holding capacity was 0.28 ml/g. Plants were collected throughout the 1995 grow-
APPL. ENVIRON. MICROBIOL. TABLE 1. Isolation of B. cepacia from maize roots during plant development Sampling
Time (days from seeding)
Maize growth stage
I II III IV V
20 37 57 78 125
Germination Elongation Tassel appearance End of flowering Physiological maturation
ing season at the more significant stages of maize development (Table 1). At each sampling, eight plants were randomly harvested, roots were excised, and loosely adhering soil was removed. Each root was weighed, blended, and resuspended in phosphate-buffered saline (Flow Laboratories). Serial dilutions of these suspensions were plated on nutrient agar (NA; Difco) and semiselective PCAT medium (2) to estimate the counts of total culturable microflora and microorganisms belonging to B. cepacia species, respectively. NA and PCAT plates were incubated at 28°C for 48 and 96 h, respectively. As seen in previous experiments, B. cepacia colonies showed on PCAT medium their characteristic morphology; they were small (diameter, about 1 mm) and white or pale yellow with well-defined margins. Colonies showing different morphologies were also recovered on this medium, but they were not included in B. cepacia counts. In order to compare the characteristics of B. cepacia isolates, bacterial isolations from each sampling were always performed with the same dilution (fresh weight per volume) of root samples, i.e., 100-fold dilution from PCAT plates with 50 to 100 colonies. A total of 133 bacterial colonies were collected as follows: 15, 16, 33, 39, and 30 from the first, second, third, fourth, and fifth samplings, respectively. At each sampling, the B. cepacia-like colonies isolated represented about 70% of the total according to the percentage of their growth on PCAT medium. From all five samplings, 94 B. cepacia-like colonies were isolated (11, 12, 23, 27, and 21 from the first, second, third, fourth, and fifth samplings, respectively), but colonies with different morphologies were also taken up in order to investigate to which species they belonged. Isolates were subjected to single-colony isolation on PCAT medium and cryopreserved at 280°C in 30% glycerol. Some strains isolated at different stages of plant growth were analyzed with the API 20NE test (Bio-Me´rieux, SA, Marcy l’Etoile, France) in order to characterize their biochemical and nutritional properties. Sample preparation prior to PCR amplification. Isolated strains were grown overnight on NA at 28°C. For each strain, a single whole colony was picked up, resuspended in 20 ml of sterile distilled water, and heated to 95°C for 10 min to obtain cell lysis. ARDRA. Amplification of 16S rDNA was performed with 2 ml of each lysate cell suspension in 20 ml of Promega Taq buffer containing 1.5 mM MgCl2 with 150 ng (each) of primers P0 and P6 (Table 2), 250 mM (each) deoxynucleoside triphosphates, and 1 U of Taq DNA polymerase (Promega). The reaction mixtures were incubated in a thermocycler (model 9600; Perkin-Elmer) at 95°C for 1 min and 30 s and then cycled 35 times through the following temperature profile: 95°C for 30 s, annealing temperature (Ta) for 30 s, and 72°C for 4 min. The Ta was 60°C for the first 5 cycles, 55°C for the next 5 cycles, and 50°C for the last 25 cycles. Finally, the mixtures were incubated at 72°C for 10 min and then at 60°C for 10 min. The universal primers P0 and P6 were designed on the basis of the conserved eubacterial sequences at the 59 and 39 extremes of the 16S rDNA gene, respec-
TABLE 2. Primers used for amplification and sequencing of 16S rDNA Primer Positiona
P0 P8 P4 P4a P2 P3b P5 P6 P9 P10
27f 342r 559r 575f 704f 765r 930f 1495r 519r 1114f
Length (nucleotides)
Sequence
21 16 17 17 20 21 17 20 18 16
59-GAGAGTTTGATCCTGGCTCAG 59-CTGCTGCCTCCCGTAG 59-CTTTACGCCCAGTAATT 59-AATTACTGGGCGTAAAG 59-GTAGCGGTGAAATGCGTAGA 59-CTGTTTGCTCCCCACGCTTTC 59-AAGGAATTGACGGGGGC 59-CTACGGCTACCTTGTTACGA 59-GTATTACCGCGGCTGCTG 59-GCAACGAGCGCAACCC
a The position corresponds to the number of the E. coli rDNA position where the 39 end of the primer anneals in forward (f) or reverse (r) orientation.
BIODIVERSITY OF A BURKHOLDERIA CEPACIA POPULATION
VOL. 63, 1997
tively, allowing the amplification of nearly the entire gene (17). The primers were synthesized by standard phosphoramitide chemistry, deprotected, dried, dissolved in Tris-EDTA buffer (31), and used without any further purification. Two microliters of each amplification mixture was analyzed by agarose (1.2% [wt/vol]) gel electrophoresis in Tris-acetate-EDTA (TAE) buffer (31) containing 0.5 mg (wt/vol) of ethidium bromide per ml. A 5-ml aliquot of each PCR mixture containing approximately 1.5 mg of amplified 16S rDNA was digested with 3 U of the restriction enzyme AluI (Boehringer Mannheim) in a total volume of 20 ml at 37°C for 3 h. The enzyme was inactivated by heating the reaction mixture to 65°C for 15 min. The reaction products were analyzed by agarose (2.5% [wt/vol]) gel electrophoresis with TAE buffer containing 0.5 mg of ethidium bromide per ml. Sequencing of 16S rDNA. The amplified 16S rDNA was purified from the reaction mix by agarose (0.8% [wt/vol]) gel electrophoresis in TAE buffer with 0.5 mg (wt/vol) of ethidium bromide per ml. A small agarose slice containing the amplified band (observed under long-wave UV [312 nm]) was excised from the gel and purified by using a QIAquick gel extraction kit (Qiagen) according to the supplier’s instructions. Determination of the 16S rDNA nucleotide sequence was performed by an enzymatic method (38) by using a Promega fmol (thermal cycle) DNA sequencing kit and 35S-ATP to label the synthesized DNA. The reactions were performed for 30 thermal cycles according to the instruction manual with the primers listed in Table 2, which were designed on the basis of conserved eubacterial sequences. The primers, which did not show palindromic sequences of longer than four bases or complementarity at the 39 extreme, were denatured at 90°C for 2 min before use. The Ta used in cycle sequencing was 50°C. Analysis of sequence data. Sequences were aligned with the most similar ones of the Ribosomal Database Project (30) by using the MacVector 4.1.4 program (International Biotechnology Inc., Symantec Corporation) and with those found at the National Center for Biotechnology Information by using the BLAST program. The alignment was manually checked and analyzed. RAPD analysis. Amplification reactions were performed in 25 ml of Dynazime buffer containing 3 mM MgCl2, 2 ml of each lysate cell suspension, 500 ng of primer, 200 mM (each) deoxynucleoside triphosphates, and 0.625 U of Taq thermostable DNA polymerase (Dynazime). The reaction mixtures were incubated in a thermocycler (model 9600; Perkin-Elmer) at 90°C for 1 min and 95°C for 1 min and 30 s. They were then cycled 45 times through the following temperature profile: 95°C for 30 s, 36°C for 1 min, and 75°C for 2 min. Final extension was carried out at 75°C for 10 min and then at 60°C for 10 min. Two 10-mer primers, AP12 (59-CGGCCCCTGC-39) and AP5 (59-TCCCGCT GCG-39), with GC contents of 90 and 80%, respectively, were used. A 5-ml volume of each reaction mixture was electrophoresed on an agarose (2% [wt/ vol]) gel in TAE buffer and stained with 0.5 mg of ethidium bromide per ml to analyze amplified products. The amplification patterns were analyzed with a scanner densitometer (model GDS2000; Ultra-Violet Product Ltd.). Statistics. (i) Population analysis. Bacteria population data were log transformed and successively analyzed by one-way analysis of variance (StatView 5121; BrainPower Inc.). (ii) AMOVA of amplification products. The vector of the presence or absence of RAPD markers (1 for the presence or 0 for the absence of each band on gels) for each strain was used to compute the measure of the genetic distance for each pair of strains. The measurement used was the Euclidean metric measurement (E) of Excoffier et al. (13), as defined by Huff et al. (22), as follows: E 5 ε2xy 5 n(1 2 2nxy/2n), where 2nxy is the number of markers shared by two individuals and n is the total number of polymorphic sites. The AMOVA procedure (13) was applied to estimate the variance components for RAPD patterns, partitioning the variations among samplings. All analyses were undertaken with the WINAMOVA program provided by L. Excoffier (University of Geneva). Nucleotide sequence accession numbers. The 16S rDNA nucleotide sequences obtained in this study were submitted to the GenBank database, and the accession numbers are listed in Table 3.
RESULTS Isolation and identification of bacterial strains from the maize rhizosphere. Samples from maize roots collected from the experimental field in S. Maria di Galeria, Rome, Italy, gave rise to colonies showing different morphologies on PCAT medium. Among them, B. cepacia-like colonies represented about 70% of the total, regardless of the age of host plants (data not shown). A total of 133 colonies were isolated and were designated MCII followed by progressive numbers of isolation. PCR amplification of 16S rDNA of each of the 133 isolates resulted in an amplification fragment (not shown) of about 1,450 bp. Restriction analysis of the amplified DNA of each sample with the enzyme AluI enabled nine ARDRA patterns to be recognized (Fig. 1). Among them, ARDRA patterns 2 and 3 were the same as those obtained with the 16S DNAs
4487
from reference strains B. cepacia LMG 11351 (also named PHP7 [16, 42]) and Pseudomonas putida PaW340 (15), respectively. The ARDRA results were in agreement with the analysis of colony morphology. In fact, among 94 isolates showing the characteristic morphology of B. cepacia, 85 (about 90%) had the ARDRA pattern, pattern 2, corresponding to that of the B. cepacia species. Moreover, some randomly chosen representatives of each ARDRA pattern were tested by API 20NE test to characterize their biochemical and nutritional properties. The results showed that strains with ARDRA patterns 2 and 3 had the characteristic metabolic activities of B. cepacia and P. putida, respectively. The API 20NE test also enabled the assignment of the 33 strains showing ARDRA pattern 4 to the Pseudomonas and Burkholderia genera. API tests carried out with isolates representative of the other six ARDRA patterns did not give enough information about their relationships with defined bacterial species or genera. Moreover, the data obtained from 16S rDNA restriction analysis and physiological tests were confirmed by determining the 16S rDNA sequence of six randomly chosen strains showing ARDRA pattern 2 from positions 404 to 486 (according to Escherichia coli numeration). According to the Ribosome Database Project (30), this region contains a sequence which appears to be typical of B. cepacia and which may be considered a “signature” of this species. As shown in Table 3, all six strains showed a 16S rDNA sequence typical of the B. cepacia group. On this basis, all 85 isolates showing ARDRA pattern 2 were assigned to B. cepacia. Moreover, about 25% of isolates were represented by the 33 strains with ARDRA pattern 4, which differed from that of B. cepacia only by the presence of an additional band (Fig. 1). For these reasons, we almost completely determined the 16S rDNA sequence of one of the strains with ARDRA pattern 4 (strain MCII8). This sequence was compared with the most similar ones contained in databases, and phylogenetic analysis showed that the strain belonged to a Burkholderia species other than B. cepacia. Indeed, it joined a cluster of Burkholderia strains placed very closely to Burkholderia caryophylli (GenBank accession no. U91570) (data not shown). The 16S rDNA sequence of P. putida PaW340 from positions 404 to 486 (according to E. coli numeration) confirmed the assignment of strains showing ARDRA pattern 3 to P. putida. It was not possible to assign strains showing the other six ARDRA patterns to a given bacterial species because of the lack of known reference strains. API 20NE tests carried out with some B. cepacia isolates revealed no differences in nutritional properties among them, whereas differences in some biochemical properties (nitrate reduction and glucose fermentation) were found (data not shown). In fact, some strains appeared to be able to reduce nitrate or to ferment glucose, some had both of these activities, and others had neither. Colonization of maize rhizosphere by B. cepacia and total culturable bacteria. B. cepacia and total culturable bacteria on maize roots were enumerated by plating sample dilutions on PCAT and NA media, respectively, at each of the five samplings performed during plant development. As described above, 90% of B. cepacia-like colonies may be assigned to this bacterial species by the ARDRA technique. Therefore, the data obtained by counting B. cepacia-like colonies on PCAT medium were corrected on the basis of ARDRA results so that at each sampling 90% of B. cepacia-like CFU were ascribed to B. cepacia. The colonization of maize roots by B. cepacia and total culturable bacteria is shown in Fig. 2. The numbers of total
b
GTGTGTGAAG .......... .......... .......... .......... .......... .......... .......... .......... .....c.... .......... ....a..... .......... .......... .......... .......... .......... .......... .......... .......... .......... .......... .......... ..........
AAGGCCTTCG .......... .......... .......... .......... .......... ....-..... .......... .......... .......... .......... ........t. .......... .......... .......... .......... .......... .......... .......... .......... .......... .......... ....t..... ....t.....
GGTTGTAAAG .......... .......... .......... .......... .......... .......... .......... .......... .......... .......... .......... .......... .......... .......... .......... .......... .......... .......... .......... .......... .......... .a........ .a........
CACTTTTGTC .......... .......... .......... .......... .......... .......... .......... .......... .......... .......... .......... .......... .......... .......... .......... .......... .......... .......... .......... .......... .........t ......aagt ......aagt
CGGAAAGAAA .......... .......... .......... .......... .......... .......... .......... .......... .......... .......... .......... .......... .......... .......... .......... .......... .......... .......... .......... .......... ...g...... t..g.g...g t..g.g...g
Signature sequenceb
TC-CTTGGCT ..-.....t. ..-.....t. ..-.....t. ..-.....t. ..-.....t. ..-.....t. ..-....a.c ..-....a.c ..-.-..c.. ..-..ga.gg ..-..ga.gg ..-a..ctg..-a..ctg..g...c.g. ..g...c.g. ..g...c.g. ..g.act.g. ..g.act.g. .gg..ct.g. .gg..ct.g. ag-gcga.gg gg-.agtaag gg-.agtaag
-CTAATACAG -......t.. -......t.. -......t.. -......t.. -......t.. -......t.. -.......-. -.......-. ga......c. -......tcc -......tcc g.......cc g.......cc --......cc --......cc --......cc --......ct --......ct --......ct --......ct -......tcc -t......ct -t......ct
T, type strain. Lowercase letters indicate residues that differ from those in the B. cepacia G4 sequence. Dashes represent gaps. Dots indicate identical residues.
G4 PHP7 MCII-102 MCII-104 MCII-37 MCII-4 MCI-13 MCII-35 MCII-36 ATCC 25418 ATCC 10248 EY 3258 ATCC 23344 ATCC 23343 ATCC 11696T ACH158 ATCC 11696 ACH0171 ACH092 ATCC 27512 ATCC 27511 ATCC 23061 ATCC 25330 DSM 50071T
B. cepacia B. cepacia B. cepacia B. cepacia B. cepacia B. cepacia B. cepacia B. cepacia B. cepacia B. caryophylli B. gladioli B. gladioli B. mallei B. pseudomallei B. solanacearum B. solanacearum B. solanacearum B. solanacearum B. solanacearum B. pickettii B. pickettii P. andropogonis P. aeruginosa P. aeruginosa
a
Straina
Species
CCGGGGGATG .......... .......... .......... .......... .......... .......... g......... g......... ggc....... ttc....... ttc....... gga.t..... gga.t..... gga.t..... gga.t..... gga.t..... ggt.t..... ggt.t..... gg..tc.... gg..tc.... ttt.ct.... tgct.ttt.. tgct.ttt-.
ACGGT ..... ..... ..... ..... ..... ..... ..... ..... ..... ..... ..... ..... ..... ..... ..... ..... ..... ..... ..... ..... ..... ...t. ...t.
TABLE 3. Comparison of partial 16S rDNA sequences (from positions 406 to 486) of six B. cepacia strains isolated in this study with those of Burkholderia and Pseudomonas reference strains
X67036 X67035 S55002 X67041 X67040 X67042 S55004 X67037 M34133 X06684
L28675 X80287 U91567 U91567 U91567 U91567 U91568 U91569 U91569 X67039 X67038 S55001 S55000
GenBank accession no.
4488 DI CELLO ET AL. APPL. ENVIRON. MICROBIOL.
VOL. 63, 1997
BIODIVERSITY OF A BURKHOLDERIA CEPACIA POPULATION
FIG. 1. Agarose gel electrophoresis of amplified 16S rDNAs digested with endonuclease AluI from 133 bacteria isolated from maize roots (lanes 1 to 9) and from B. cepacia type strain LMG 11351 (lanes T). Lanes M, 123-bp molecular size marker ladder. Lanes 2 through 4, ARDRA patterns of B. cepacia, P. putida, and B. cariophilli, respectively. The numbers of isolates for every ARDRA pattern at each sampling are reported below the gel.
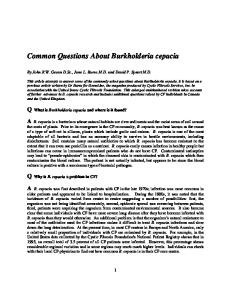
culturable and B. cepacia cells recovered from maize roots did not vary significantly throughout plant growth (P . 0.05) and oscillated around means of 8.63 and 6.3 log CFU per g (fresh weight) of root, respectively. The number of B. cepacia cells recovered from the maize rhizosphere ranged from 0.6% of
4489
total culturable microflora at the early stages of plant development to a maximum of 3.6% in mature plants. RAPD analysis. The DNAs of lysed-cell suspensions of 85 B. cepacia strains were amplified by the RAPD technique with two 10-mer primers, AP12 and AP5. The reproducibility of the results was verified in independent experiments (data not shown). An example of the amplification patterns is shown in Fig. 3. Amplification of genomic DNAs of B. cepacia strains with primers AP12 and AP5 gave rise to 33 and 57 bands, respectively, for a total of 90 RAPD markers, whose dimensions ranged from 180 to 2,100 bp. The amplification patterns obtained with primer AP5 exhibited a higher level of polymorphism than did those obtained with primer AP12. The RAPD patterns obtained were represented by the presence or absence of 90 vector markers. Each RAPD pattern was compared with each other, and E was calculated (not shown). The matrix elicits one salient point. There is considerable variation within this bacterial population, since 68 haplotypes were found among the 83 strains analyzed (the DNAs from two strains did not give any amplification band with the two primers used). We used the AMOVA method to analyze RAPD variation within the B. cepacia populations isolated at five different samplings. The AMOVA data, obtained from E, showed highly significant (P , 0.008) genetic differences (6.41%) among the five samplings (Table 4). To investigate whether this genetic diversity was related to divergence among strains and/or samplings, we analyzed all the possible combinations of two, three, and four samplings (Table 4). Most of the total molecular variance was attributable to divergences among strains and can be calculated by determining the complement to 100% for each variance value reported in Table 4. All the combinations where samplings 1 and 5 were taken together (Table 4) showed very significant (P , 0.01) high variability (7.37 to 25.23%). However, the genetic diversity between sampling 5 and each of the others (1 through 4) is significant (P , 0.05). Therefore, at least part of the genetic diversity may be attributed to divergences among strains collected at different plant growth stages. The relationships among these 83 strains were represented as a dendrogram (Fig. 4) by using E and the neighbor-joining method (37). The unrooted dendrogram looks more like a bush than like a tree, as previously described for a bacterial population with frequent recombinations (49). Moreover, the upper part of the dendrogram appears to be more variable than is the lower part. Strains from samplings 4 and 5 seem to be grouped together. The data revealed that the genetic diversity of the B. cepacia population studied decreased from the first to the last sampling; in other words, microbial variability diminished during plant growth. DISCUSSION
FIG. 2. Numbers of total bacterial cells (enumerated on NA medium) and B. cepacia cells (enumerated on PCAT medium) associated with maize roots during successive stages of plant development. Error bars indicate standard errors.
A study of a B. cepacia population naturally associated with maize roots was carried out from the isolation of microorganisms in situ and proceeding up to their identification and an analysis of genetic variability among the strains isolated. On the basis of ARDRA analysis and 16S rDNA sequencing, most of the strains (about 88%) isolated from maize roots were assigned to the genus Burkholderia. Among them, 85 strains were assigned to B. cepacia and 33 to a Burkholderia species very close to B. caryophylli. In particular, B. cepacia seemed to be strictly associated with maize roots, probably being one of the most representative bacterial species in the maize rhizosphere. Furthermore, colonization of the maize rhizosphere by B. cepacia was not significantly affected by plant development. B. cepacia strains were analyzed by RAPD fingerprinting for
4490
DI CELLO ET AL.
APPL. ENVIRON. MICROBIOL.
FIG. 3. Electrophoretic patterns obtained by RAPD analysis of some B. cepacia strains isolated in this study with primers AP12 (a) and AP5 (b).
the following purposes: (i) to check the genetic structure of the population by evaluating intraspecific variability and (ii) to investigate how the degree of polymorphism changes during plant growth. RAPD fingerprinting revealed a high degree of genetic diversity within the B. cepacia population; among the 83 strains analyzed, 68 distinct haplotypes were found. The data derived from our AMOVA analysis of RAPD markers were used to construct a dendrogram representing the genetic relatedness of strains. Although such a dendrogram does not imply phylogenetic relationships, it is nevertheless of considerable value in the interpretation of data, allowing the definition of the considered population as clonal or not (23, 33, 40). The dendrogram looks more like a bush than like a tree, as previously shown for other soil microbial populations. This is in agreement with other reports showing that the clonal model
TABLE 4. AMOVA of 85 B. cepacia strains with 90 RAPD markers from five sampling occasions Pa
F statistic
Variance component
Total (%)
1 vs 2 vs 3 vs 4 vs 5
6.41
0.008
0.060
1 1 1 1 2
vs vs vs vs vs
2 2 2 3 3
vs vs vs vs vs
3 3 4 4 4
4.29 9.93 7.96 7.37 3.52
0.060 ,0.002 0.003 ,0.002 0.050
0.043 0.099 0.080 0.074 0.035
1 1 1 1 1 1 2 2 2 3
vs vs vs vs vs vs vs vs vs vs
2 2 2 3 3 4 3 3 4 4
vs vs vs vs vs vs vs vs vs vs
3 4 5 4 5 5 4 5 5 5
7.12 5.65 14.86 4.70 12.38 10.58 1.46 6.12 2.87 3.82
0.040 0.070 0.007 0.040 0.002 0.002 0.200 ,0.002 0.100 0.020
0.071 0.057 0.149 0.047 0.124 0.106 0.015 0.061 0.029 0.038
1 1 1 1 2 2 2 3 3 4
vs vs vs vs vs vs vs vs vs vs
2 3 4 5 3 4 5 4 5 5
12.51 6.82 9.72 25.53 4.66 0.00 5.72 1.13 7.26 3.59
0.070 0.060 0.020 ,0.002 0.100 0.500 0.080 0.200 0.010 0.090
0.125 0.068 0.097 0.255 0.047 0.000 0.057 0.011 0.073 0.036
a
vs vs vs vs vs
4 5 5 5 5
Probability of having a more extreme variance component and F statistic.
of population structure currently held for bacterial species (3, 48) does not apply to bacteria living in soil, because these bacteria have a greater chance of encountering different coexisting strains in their local environment than do commensal and pathogenic species that rarely occur as mixed infections in a host. Therefore, parasexual mechanisms of genetic transfer and consequent genetic recombination seem to be much more frequent in bacterial species which are adapted to living in soil (49). In particular, the genomic complexity and plasticity of B. cepacia (29) favor intraspecific variability, which confers a high capacity to adapt to diverse environments. The data reported in this work are also in agreement with previous studies of the genetic structure of a lotic population of B. cepacia (51). Multilocus enzyme electrophoresis showed that this bacterial species is not obligatorily clonal; measurements of genetic similarity between strains revealed significant differences among the subpopulations at sediment sampling points, suggesting bacterial adaptation to a heterogeneous environment. The present work showed that plant development significantly affected the biodiversity of a B. cepacia population associated with maize roots. An analysis of the genetic variability of B. cepacia at different samplings revealed that the degree of polymorphism during the early stages of maize growth, i.e., at the end of germination, was higher than that during the last stages of plant growth, when maturation is complete. Indeed, strains collected at the last stage of the maize life cycle can be clustered together. A possible explanation for this finding is that as their growth is coming along, plants tend to establish a balanced condition. In fact, it may be expected that the rhizosphere of a young immature plant represents a more unstable ecosystem than does the rhizosphere of a mature plant, probably because young plant roots represent a new element in the soil. In general, a single bacterial species may be able to exhibit different types of population structures, depending on environmental conditions. A bacterial population whose structure resembles the pattern typical of a freely recombinant population could produce certain genotypes which would be favored under stress conditions (52). In fact, in a rapidly changing environment, recombination would provide an extensive gene pool and natural selection would favor some genetic combinations which, under better conditions, might propagate extensively in a clonal manner (23, 51). Mc Arthur et al. also found that genetic diversity increased with environmental variability in soilborne forms of B. cepacia (34). In mature plants, the habitat represented by the rhizosphere becomes more stable and uniform, resulting in a selective pressure which may promote preferably some genotypes within each local microbial population. Consequently, bacteria living in the rhizosphere may
VOL. 63, 1997
BIODIVERSITY OF A BURKHOLDERIA CEPACIA POPULATION
4491
FIG. 4. Dendrogram showing genetic relationships among 83 B. cepacia isolates, based on RAPD patterns produced with primers AP12 and AP5. Genetic distances were calculated by using E (13). Each isolate is identified by its number (see Materials and Methods), which is preceded by a symbol which indicates the sampling at which the isolate was collected from maize roots.
show a trend to adapt themselves to a more stable environment, resulting in the loss of less favorable characters. A high level of genetic diversity has also previously been found in a Rhizobium meliloti population isolated from Medicago sativa nodules (35). Although significant genetic differences were detected among R. meliloti strains isolated from different soils and from different plant varieties cultivated in the same soil, no significant genetic differences were observed
among strains isolated at successive samplings, indicating that this bacterial population was stable throughout the seasons, probably because these microorganisms live in a protected niche represented by nodules. On the contrary, rhizosphere microflora seems to be more influenced by temporal changes of environmental factors than does local microflora of root nodules. In a lotic ecosystem, temporal variations of environmental conditions have also previously been shown to be as-
4492
DI CELLO ET AL.
sociated with changes in the genetic structure of a B. cepacia community associated with a particular site (52) because of selective processes, given that physical conditions in temperate streams change annually at most sites. In conclusion, intraspecific biodiversity enables environmental microorganisms to adapt to changing habitats, resulting in those biotypes which respond better to the stresses being favored. Moreover, microbial biodiversity represents a very rich source of useful microorganisms, whose potential capabilities are still largely unexplored. The fact that plant development may exert some influence on the genetic variability of rhizosphere B. cepacia populations suggests that in the selection of B. cepacia strains to be used as maize inoculants, one should take into account the plant growth stage among other factors. Indeed, the progressive increase in the B. cepacia number with respect to the number of total culturable microflora during maize growth confirmed that the association established by B. cepacia with maize roots appeared to be closer as the plant developed. Moreover, the gradual decrease in bacterial genetic variability during plant growth may be due to the establishment of haplotypes better adapted to the host plant, suggesting that it is more advantageous to select B. cepacia strains from the late plant growth stages in order to develop an effective and successful PGP inoculum. Further studies that evaluate the genetic temporal variation of B. cepacia are needed to draw final conclusions on the prevalence of some genotypes in this species and to investigate whether specific functions involved in PGP activity may be correlated with distinct haplotypes. ACKNOWLEDGMENTS We thank Gabriella Seri and Luigi Ferrandi for technical assistance. This study was partially supported by the Consiglio Nazionale delle Ricerche (ECOMI 0639 no. 96.00627.CT06). REFERENCES 1. Bevivino, A., S. Tabacchioni, L. Chiarini, M. V. Carusi, M. Del Gallo, and P. Visca. 1994. Phenotypic comparison between rhizosphere and clinical isolates of Burkholderia cepacia. Microbiology (Reading) 140:1069–1077. 2. Burbage, D. A., M. Sasser, and R. D. Lumsden. 1982. A medium selective for Pseudomonas cepacia. Phytopathology 72:706 (Abstract.) 3. Caugant, D. A., B. L. Levin, and R. K. Selander. 1981. Genetic diversity and temporal variation in the Escherichia coli population of a human host. Genetics 98:467–490. 4. Chiarini, L., A. Bevivino, and S. Tabacchioni. 1994. Factors affecting the competitive ability in rhizosphere colonization of plant-growth promoting strains of Burkholderia cepacia, p. 204–206. In Proceedings of the Third International Workshop on Plant Growth-Promoting Rhizobacteria. CSIRO Australia, Adelaide, Australia. 5. de Bruijn, F. J. 1992. Use of repetitive (repetitive extragenic palindromic and enterobacterial repetitive intergenic consensus) sequences and the polymerase chain reaction to fingerprint the genome of Rhizobium meliloti isolates and other soil bacteria. Appl. Environ. Microbiol. 58:2180–2187. 6. De´fago, G., and D. Haas. 1990. Pseudomonads as antagonists of soilborne plant pathogens: mode of action and genetic analysis. Soil Biochem. 6:249– 291. 7. De´fago, G., B. K. Duffy, and C. Keel. 1994. Risk assessment for the release of plant growth-promoting rhizobacteria, p. 254. In Proceedings of the Third International Workshop on Plant Growth-Promoting Rhizobacteria. CSIRO Australia, Adelaide, Australia. 8. De Leij, F. A. A. M., E. M. Sutton, J. M. Whipps, and J. M. Linch. 1994. Effect of genetically modified Pseudomonas aureofaciens on indigenous microbial populations of wheat. FEMS Microbiol. Ecol. 13:249–258. 9. De Leij, F. A. A. M., E. M. Sutton, J. M. Whipps, J. S. Fenlon, and J. M. Linch. 1995. Impact of field release of genetically modified Pseudomonas fluorescens on indigenous microbial populations of wheat. Appl. Environ. Microbiol. 61:3442–3453. 10. Deng, S., C. Hirukl, J. A. Robertson, and G. W. Stemke. 1992. Detection by PCR and differentiation by restriction fragment length polymorphism of Acholeplasma, Spiroplasma, Mycoplasma and Ureoplasma, based upon 16S rRNA genes. PCR Methods Applications 1:202–204. 11. Di Cello, F., and R. Fani. 1996. A molecular strategy for the study of natural bacterial communities by PCR-based techniques. Minerva Biotecnol. 8:126– 134.
APPL. ENVIRON. MICROBIOL. 12. Di Cello, F., M. Pepi, F. Baldi, and R. Fani. Molecular characterization of a n-alkane degrading bacterial community and identification of a new species, Acinetobacter venetianus. Res. Microbiol., in press. 13. Excoffier, L., P. E. Smouse, and J. M. Quattro. 1992. Analysis of molecular variance inferred from metric distances among DNA haplotypes: application to human mitochondrial DNA restriction data. Genetics 131:479–491. 14. Fani, R., C. Bandi, M. G. Bardin, S. Comincini, G. Damiani, A. Grifoni, and M. Bazzicalupo. 1993. RAPD fingerprinting for useful identification of Azospirillum strains. Microb. Releases 1:217–221. 15. Franklin, F. C. H., and P. A. Williams. 1980. Construction of a partial diploid for the degradative pathway encoded by the TOL plasmid pWW0 from Pseudomonas putida mt-2; evidence for the positive nature of the regulation by the xylR gene. Mol. Gen. Genet. 177:321–328. 16. Gillis, M., T. Van Van, R. Bardin, M. Goor, P. Hebbar, A. Willems, P. Segers, K. Kersters, T. Heulin, and M. P. Fernandez. 1995. Polyphasic taxonomy in the genus Burkholderia leading to an emended description of the genus and proposition of Burkholderia vietnamensis sp. nov. for N2-fixing isolates from rice in Vietnam. Int. J. Syst. Bacteriol. 45:274–289. 17. Grifoni, A., M. Bazzicalupo, C. Di Serio, S. Fancelli, and R. Fani. 1995. Identification of Azospirillum strains by restriction fragment length polymorphism of the 16S rDNA and of the histidine operon. FEMS Microbiol. Lett. 127:85–91. 18. Gurtler, V., V. A. Wilson, and C. B. Mayall. 1991. Classification of medically important clostridia using restriction endonuclease site differences of PCRamplified 16S rDNA. J. Gen. Microbiol. 137:2673–2679. 19. Hadrys, H., M. Balick, and B. Schierwater. 1992. Applications of random amplified polymorphic DNA (RAPD) in molecular ecology. Mol. Ecol. 1: 55–63. 20. Hamlen, R. A., F. L. Lukezic, and J. R. Bloom. 1972. Influence of age and stage of development on the neutral carbohydrate components in root exudates from alfalfa plants grown in a gnotobiotic environment. Can. J. Plant Sci. 52:633–642. 21. Hebbar, K. P., M. H. Martel, and T. Heulin. 1994. Burkholderia cepacia, a plant growth promoting rhizobacterial associate of maize, p. 201–203. In Proceedings of the Third International Workshop on Plant Growth-Promoting Rhizobacteria. CSIRO Australia, Adelaide, Australia. 22. Huff, D. R., R. Peakall, and P. E. Smouse. 1993. RAPD variation among natural populations of outcrossing buffalograss [Buchloe¨ dactyloides (Nutt.) Engelm.]. Theor. Appl. Genet. 86:927–934. 23. Istock, C. A., K. E. Duncan, N. Ferguson, and X. Zhou. 1992. Sexuality in a natural population of bacteria—Bacillus subtilis—challenges the clonal paradigm. Mol. Ecol. 1:95–103. 24. Jackman, S. C., H. Lee, and J. T. Trevors. 1992. Survival, detection and containment of bacteria. Microb. Releases 1:125–154. 25. Jayarao, B. M., J. J. E. Dore`, Jr., and S. P. Oliver. 1992. Restriction fragment length polymorphism analysis of 16S ribosomal DNA of Streptococcus and Enterococcus species of bovine origin. J. Clin. Microbiol. 30:2235–2240. 26. Klinger, J. M., R. P. Stowe, D. C. Obenhuber, T. O. Groves, S. K. Mishra, and D. L. Pierson. 1992. Evaluation of the Biolog automated microbial identification system. Appl. Environ. Microbiol. 58:2089–2092. 27. Kloepper, J. W., and C. J. Beauchamp. 1992. A review of issues related to measuring colonization of plant roots by bacteria. Can. J. Microbiol. 38: 1219–1232. 28. Kostman, J. R., T. D. Edlin, J. J. Lipuma, and T. L. Stull. 1992. Molecular epidemiology of Pseudomonas cepacia determined by polymerase chain reaction ribotyping. J. Clin. Microbiol. 30:2084–2087. 29. Lessie, T. G., W. Hendrickson, B. D. Manning, and R. Devereux. 1996. Genomic complexity and plasticity of Burkholderia cepacia. FEMS Microbiol. Lett. 144:117–128. 30. Maidak, B. L., G. J. Olsden, N. Larsen, R. Overbeek, M. J. McCaughey, and C. R. Woese. 1997. The RDP (Ribosomal Database Project). Nucleic Acids Res. 25:109–111. 31. Maniatis, T., E. F. Fritsch, and J. Sambrook. 1982. Molecular cloning: a laboratory manual. Cold Spring Harbor Laboratory, Cold Spring Harbor, N.Y. 32. Martı´nez-Murcia, A. J., S. G. Acinas, and F. Rodriguez-Valera. 1995. Evaluation of prokaryotic diversity by restrictase digestion of 16S rDNA directly amplified from hypersaline environments. FEMS Microbiol. Lett. 17:247– 256. 33. Maynard Smith, J., N. H. Smith, M. O’Rourke, and B. Spratt. 1993. How clonal are bacteria? Proc. Natl. Acad. Sci. USA 90:4384–4388. 34. Mc Arthur, J. V., D. A. Kovacic, and M. H. Smith. 1988. Genetic diversity in natural populations of a soil bacterium across a landscape gradient. Proc. Natl. Acad. Sci. USA 85:9621–9624. 35. Paffetti, D., C. Scotti, S. Gnocchi, S. Fancelli, and M. Bazzicalupo. 1996. Genetic diversity of an Italian Rhizobium meliloti population from different Medicago sativa varieties. Appl. Environ. Microbiol. 62:2279–2285. 36. Rovira, A. D. 1965. Plant root exudates and their influence upon soil microorganisms, p. 170. In K. F. Baker and W. C. Snyder (ed.), Ecology of soil-borne plant pathogens—prelude to biological control. University of California Press, Berkeley. 37. Saitou, N., and M. Nei. 1987. The neighbor-joining method: a new method
VOL. 63, 1997
BIODIVERSITY OF A BURKHOLDERIA CEPACIA POPULATION
for reconstructing phylogenetic trees. Mol. Biol. Evol. 4:406–425. 38. Sanger F., S. Nicklen, and A. R. Coulson. 1977. DNA sequencing with chain-terminating inhibitors. Proc. Natl. Acad. Sci. USA 74:5463–5467. 39. Smith, J. J., L. C. Offord, M. Holderness, and G. S. Saddler. 1995. Genetic diversity of Burkholderia solanacearum (synonym Pseudomonas solanacearum) race 3 in Kenya. Appl. Environ. Microbiol. 61:4263–4268. 40. Souza, V., L. Eguiarte, G. Avila, R. Cappello, C. Gallardo, J. Montoya, and D. Pinero. 1994. Genetic structure of Rhizobium etli biovar phaseoli associated with wild and cultivated bean plants in Morelos, Mexico. Appl. Environ. Microbiol. 60:1260–1268. 41. Tabacchioni, S., A. Bevivino, L. Chiarini, P. Visca, and M. Del Gallo. 1993. Characteristics of two rhizosphere isolates of Pseudomonas cepacia and their potential plant-growth-promoting activity. Microb. Releases 2:161–168. 42. Tabacchioni, S., P. Visca, L. Chiarini, A. Bevivino, C. Di Serio, S. Fancelli, and R. Fani. 1995. Molecular characterization of rhizosphere and clinical isolates of Burkholderia cepacia. Res. Microbiol. 146:531–542. 43. Vaneechoutte, M., R. Rossau, P. De Vos, M. Gillis, D. Janssen, N. Paepe, A. De Rouck, T. Fiers, G. Claeys, and K. Kersters. 1992. Rapid identification of bacteria of the Comamonadaceae with amplified ribosomal DNA-restriction analysis (ARDRA). FEMS Microbiol. Lett. 93:227–234. 44. Vaneechoutte M., H. De Beenhouwer, G. Claeys, G. M. Verschraegen, A. De Rouck, N. Paepe, A. Eilachouni, and F. Portaels. 1993. Identification of Mycobacterium species with amplified rDNA restriction analysis. J. Clin. Microbiol. 31:2061–2065. 45. Vaneechoutte, M., I. Dijkshoorn, A. Tjernberg, A. Eilachouni, P. De Vos, G.
46.
47. 48. 49. 50.
51. 52.
4493
Claeys, and G. Verschraegen. 1995. Identification of Acinetobacter genomic species by amplified ribosomal DNA restriction analysis. J. Clin. Microbiol. 33:11–15. Villadas, P. J., P. Burgos, D. Jording, W. Selbitschka, A. Puhler, and N. Toro. 1996. Comparative analysis of the genetic structure of a Rhizobium meliloti field population before and after environmental release of the highly competitive R. meliloti strain GR4. FEMS Microbiol. Ecol. 21:37–45. Welsh, J., and M. McClelland. 1990. Fingerprinting genomes using PCR with arbitrary primers. Nucleic Acids Res. 18:7213–7218. Whittam, T. S., H. Ochman, and R. K. Selander. 1983. Multilocus genetic structure in natural populations of Escherichia coli. Proc. Natl. Acad. Sci. USA 80:1751–1755. Whittam, T. S. 1992. Sex in the soil. Curr. Biol. 2:676–678. Williams, J. G. K., A. R. Kubelick, K. J. Livak, J. A. Rafalski, and S. V. Tingey. 1990. Polymorphism generated by arbitrarily primed PCR in the mouse: application to strain identification and genetic mapping. Nucleic Acids Res. 18:6531–6535. Wise, M. G., L. J. Shimkets, and J. Vaun McArthur. 1995. Genetic structure of a lotic population of Burkholderia (Pseudomonas) cepacia. Appl. Environ. Microbiol. 61:1791–1798. Wise, M. G., J. Vaun McArthur, C. Wheat, and L. J. Shimkets. 1996. Temporal variation in genetic diversity and structure of a lotic population of Burkholderia (Pseudomonas) cepacia. Appl. Environ. Microbiol. 62:1558– 1562.