Big Data in the Public Sector Institutions for Development Sector
Selected Applications and Lessons Learned Authors: Louisa Tomar William Guicheney Hope Kyarisiima Tinashe Zimani
Institutional Capacity of the State Division DISCUSSION PAPER Nº IDB-DP-483
Coordinators: Benjamin Roseth Sebastián Acevedo
October 2016
Big Data in the Public Sector
Selected Applications and Lessons Learned Authors: Louisa Tomar William Guicheney Hope Kyarisiima Tinashe Zimani Coordinators: Benjamin Roseth Sebastián Acevedo
October 2016
http://www.iadb.org Copyright © 2016 Inter-American Development Bank. This work is licensed under a Creative Commons IGO 3.0 Attribution-NonCommercial-NoDerivatives (CC-IGO BY-NC-ND 3.0 IGO) license (http://creativecommons.org/ licenses/by-nc-nd/3.0/igo/legalcode) and may be reproduced with attribution to the IDB and for any noncommercial purpose. No derivative work is allowed. Any dispute related to the use of the works of the IDB that cannot be settled amicably shall be submitted to arbitration pursuant to the UNCITRAL rules. The use of the IDB's name for any purpose other than for attribution, and the use of IDB's logo shall be subject to a separate written license agreement between the IDB and the user and is not authorized as part of this CC-IGO license. Note that link provided above includes additional terms and conditions of the license. The opinions expressed in this publication are those of the authors and do not necessarily reflect the views of the Inter-American Development Bank, its Board of Directors, or the countries they represent.
Contact: Benjamin Roseth,
[email protected]; Sebastián Acevedo,
[email protected].
Big Data in the Public Sector Selected Applications and Lessons Learned Authors: Louisa Tomar, William Guicheney, Hope Kyarisiima, and Tinashe Zimani
Coordinators: Benjamin Roseth and Sebastián Acevedo
ABSTRACT This paper analyzes different ways in which big data can be leveraged to improve the efficiency and effectiveness of government. It describes five cases where massive and diverse sets of information are gathered, processed, and analyzed in three different policy areas: smart cities, taxation, and citizen security. The cases, compiled from extensive desk research and interviews with leading academics and practitioners in the field of data analytics, have been analyzed from the perspective of public servants interested in big data and thus address both the technical and the institutional aspects of the initiatives. Based on the case studies, a policy guide was built to orient public servants in Latin America and the Caribbean in the implementation of big data initiatives and the promotion of a data ecosystem. The guide covers aspects such as leadership, governance arrangements, regulatory frameworks, data sharing, and privacy, as well as considerations for storing, processing, analyzing, and interpreting data.
JEL Codes: O31; O33 Keywords: big data; innovation; service delivery
vii
Table of Contents Acronyms ....................................................................................................................................................... ix Prologue ........................................................................................................................................................ 1 EXECUTIVE SUMMARY ..................................................................................................................................... 3 INTRODUCTION ................................................................................................................................................. 5 BIG DATA DEFINED ............................................................................................................................................ 7 METHODOLOGY ................................................................................................................................................. 9 SMART CITIES .................................................................................................................................................. 11 TAXATION .......................................................................................................................................................... 21 CITIZEN SECURITY .......................................................................................................................................... 31 POLICY GUIDE ................................................................................................................................................. 37 REFERENCES .................................................................................................................................................. 49
viii
Acronyms B2B
Business to business
B2G
Business to government
D4D
Data for Development
DAS Domain Awareness System ECLAC Economic Commission for Latin America and the Caribbean GDP
Gross domestic product
GTP Golden Tax Project ICT
Information and communications technology
IDB
Inter-American Development Bank
IS Information systems ISO
International Organization for Standardization
IT Information technology LAC
Latin America and the Caribbean
LSE
London School of Economics and Political Science
NYPD New York Police Department PPP Public–private partnership RTCC
Real-Time Crime Centre
SAT State Administration of Tax SPED
Sistema Público de Escrituração Digital
TfL
Transport for London
VAT Value-added tax
ix
Prologue
I
t is by now no surprise that we live in a world of data. Data are produced in greater quantities and by more sources than ever before and analyzed faster and with greater sophistication than was imaginable just a few years ago. Every day, new tools are created to turn raw data into information, and information into visual representations. The reach and applicability of big data seem limitless. For leaders in the public sector, however, investments in technology are often as synonymous with “boondoggle” as they are with “progress.” History is riddled with stories of information technology (IT) “upgrades” that end up over budget, behind schedule, and more trouble than they are worth. Because government investments are made with taxpayer dollars and the budgets of many Latin American and Caribbean (LAC) governments are sensitive to the volatility of the global commodities market, IT projects must be undertaken with great care. They must meet a strategic need and must be consistent with policy priorities, adaptable to legal and administrative frameworks, and feasible within capacity constraints. It is in this complex context that the Institutional Capacity of the State Division of the Inter-American Development Bank (IDB) is studying the topic of big data. This report provides a first glance at a range of applications of big data in the public sector, focusing on three key areas: smart cities, taxation, and citizen security. The mix
of developed- and developing-country contexts— with cases from multiple levels of government within the United States, the United Kingdom, China, and Brazil—provides readers with insights from diverse corners of the globe. The report is written for policymakers, taking into account the practical constraints they face and the tradeoffs inherent in investment decisions. While much work to date focuses on the “what” and the “why” of big data, this report aims to tackle the equally important issues of “who” and “how.” This effort complements a wide range of IDB lending and knowledge-generation activities in support of digital government initiatives throughout the LAC region. From cybersecurity to open government to the digitalization citizen services, the IDB promotes open, efficient, and effective public sector institutions throughout the region. Big data is one tool with great promise in this ever-evolving challenge. This report gives readers a useful review of the dynamics at play. We wish to thank the London School of Economics and Political Science (LSE) for their ongoing relationship with the IDB and particularly to the master’s degee students in the Development Management master’s students that are the main authors of the report. Carlos Santiso Chief Institutional Capacity of the State Division Inter-American Development Bank 1
EXECUTIVE SUMMARY
T
his report was commissioned by the Inter-American Development Bank (IDB) as a consultancy project for Development Management Master’s students at the London School of Economics and Political Science (LSE). It seeks to answer the question of whether and how big data can help governments improve policy design and service delivery with emphasis on identifying keys to success as well as primary obstacles. The report identifies leading examples of big data’s current uses by national and local governments in the areas of smart cities, taxation, and citizen security, as each represent policy space relevant to countries in the LAC region. The report concludes with a policy guide which identifies how big data can be integrated into public-sector initiatives through strategic policymaking, regulatory improvements, and investments in technology and human capital. The main contribution of the report is the policy guide, which emphasizes (i) institutional arrangements and (ii) investments in human and physical capital. With insights at both the micro and macro levels, the policy guide is meant to demonstrate the institutional and technical foundations that best facilitate big data’s practical applications in the public sector, with resource constraints in mind. The case studies highlight big data’s need for innovative and flexible institutional arrangements, given the highly contextspecific nature of its integration into public
organizations. The opening, co-mingling, and sharing of government data across agencies is essential for creating a foundation in which big data insights can be derived. In addition, the cases analyzed here indicate that commitment from leadership is the cornerstone of successful implementation of data projects. Management and key decision makers must first establish a clear, comprehensive vision for the use of data that falls within a larger development plan and includes accessible procedures and incentive alignment for creators, analyzers, and users of data. The engagement of key stakeholders inside government is an important factor to ensure (i) access of relevant and timely data and (ii) the cultural transformations needed in the organizations to bring about data-driven decisionmaking processes. In each of the case studies included in this report, big data was instituted for a particular agency to better achieve its specific objectives, that is, improving public transportation, addressing tax evasion and fraud, and reducing crime. Finally, the development of data-driven environments in the public sector requires a delicate balance that considers protections from data misuse while not stifling important sharing and innovation. As the cases show, the existence of open data regulations and interministerial data exchange mechanisms is a key condition for the exploitation of big data for policy objectives. 3
Hosting an effective data environment requires investment in technical tools, such as the cloud or data warehouses, where information can be stored and used by creators and consumers of the data. In many cases, government data that is already being stored requires specific sharing practices and regulations. The human capital required to implement the technical tasks should be familiar
4
with the strategic vision of the data usage and have a background in data science as well as the specific tools being employed. Once the strategic and technical groundwork is laid, establishing common procedures and training civil servants to interact efficiently with the data are fundamental steps to ensure its integration into everyday tasks.
INTRODUCTION
D
ata are being produced at unprecedented levels globally. By the end of 2015, there were a reported 3.2 billion Internet users and more than 4.6 billion users of mobile phones to communicate and transact (World Bank, 2016). Many innovations have been made toward expanding the technological capacity to generate, store, and analyze data from an array of sources and for a multitude of purposes. Information and communication technology (ICT) tools are faster, more efficient, and increasingly accessible to the poorest and most underserved segments of the world’s population. Individuals, firms, machines, and government agencies produce data at unprecedented rates. Some 2.5 quintillion bytes of data are produced every day, and approximately 90 percent of existing data was produced in the last two years alone (IBM, undated). The ever increasing data footprint provides a range of possibilities for usage by government. The researchers set out to determine whether big data could help governments improve policy design and service delivery by identifying leading examples of big data uses in the public sector. Because governments have a range of opportunities to use data, this publication focuses on the key institutional arrangements and technical considerations that facilitate the innumerable options available for data integration. Concurrently, this paper assesses the analytical processes most commonly used by public bodies to capture insights from the data they collect.
ICT for development continues to be a priority policy area for the LAC region. Some countries, such as Brazil and Mexico, continue to close the digital divide, while others are lagging behind. The Economic Commission for Latin America and the Caribbean (ECLAC), through its “eLAC” initiatives, has identified cloud computing and big data as the key focus areas for the post-eLAC15 agenda. Strengthening policy and promoting investments in these two areas offer potential tools for “changing production patterns, generating quality employment, creating local value-added, and enhancing the region’s competitiveness and integration into global markets” (CSTD, 2015: 20). Among the specific requests to ECLAC from policymakers were policies that facilitate “structural change that foster more knowledge- and innovation-intensive production and promote sustainable growth with social equality” (CSTD, 2015: 20). This report seeks to comment on the structural change that fosters more knowledge sharing and the range of possibilities that big data tools offer to enhance existing governance practices with a particular focus on smart cities, taxation, and citizen security. Each case study looks at high-level institutional arrangements and technical considerations that facilitated big data’s integration into that particular policy space. The report was compiled from desk research conducted over four months and interviews with leading academics and practitioners in the field of data analytics. The study approached the question 5
of big data’s inclusion in policy making with all the countries of LAC in consideration. Due to the differing degrees of technological capacity and regulatory preparedness of data creation, curation and mining in the region, the research was analyzed beyond the basis of technological transfer of cutting-edge technologies. The case studies were selected based on the availability of information regarding both technical aspects of information systems— infrastructure, human capital and operational procedures—and how the integration of data systems was achieved. These include: (i) formal institutions, including policy, governance structures and the legal-regulatory framework; and (ii) implications, including organizational and management structures and considerations for incorporating data usage into the day-to-day duties of civil servants. There is much enthusiasm surrounding the capacity of big data to strengthen governments. Yet, much of the ground work to facilitate this is the result of specific policy interventions under comprehensive management visions. To
6
understand the institutional and organizational investments covered in the policy guide, a first step is to become familiar with the range of tools that fit under the umbrella of “big data.” Much of the available information on big data focuses on its capacity to save and generate revenue within the private sector. Practical applications of big data in the public sector are relatively new and understudied. The researchers encountered a dearth of peer-reviewed, academic analyses on the impact of big data in either the public or the private sector. Because of the rapid growth and financial value of the data analytics industry, the researchers were careful to limit the inclusion of sources that were promotional in nature. There are two key areas of the report that the researchers were unable to analyze sufficiently: quantitative cost-benefit analyses of the financial investments made in integrating big data tools, as there is little publicly available information on this aspect; and the spectrum of data privacy and protection laws that governments and civil society are debating locally and globally.
BIG DATA DEFINED The 3Vs of Big Data
E
fforts to gather, store, and analyze large amounts of information are not new. Many governments and firms have been collecting large amounts of data about their citizens or customers to better understand their preferences and provide better services and products. The concept of “big data” began to gain momentum in the early 2000s, when Doug Laney, an analyst working for the META Group, an international investment and advisory company, articulated a now widely used broad definition of big data, that continues to be expanded (SAS, 2016). Broadly defined, big data refers to the recent exponential growth in the quantity and variety of digital data, and the power of the hardware and software used to analyze it. Big data is categorized by the three Vs (IBM, undated; WEF, 2012): ● Volume: It was estimated that every two days in 2010, the volume of data being created was the same as that created in all of recorded history until 2003. Today, it is estimated that 2.5 quintillion bytes of data are created every day. Data are produced from a wide array of sources, including business transactions, social media and email, machine-to-machine interactions and sensors, photos, audio, video and interpersonal communication.
1
● Velocity: Data streams in at an unprec-
edented speed and must be dealt with in a timely manner to be relevant. Technological innovations, such as RFID tags1, smart metering and sensors, offer data in real-time, which greatly increases the potential for identifying useful patterns for immediate decision making. ● Variety: The types of formats that data may take are extremely diverse—from structured, numeric data to text documents, emails, and even video and audio. The processing power required to analyze such an array of data collectively is now available. While the three Vs describe the physical characteristics of big data, the technological innovations for storing and processing diverse, large data sets represent its potential impact. Cloud-based data storage allows much larger volumes of information to “rest” together. New tools that run algorithmic analytics are increasingly more powerful and accurate. Data mining and predictive analytics offer a range of possibilities for strengthening governments’ capacity to understand countries’ complex socioeconomic issues, from the spread of epidemics to unemployment trends and confidence in the economy.
Radio Frequency Identification (RFID) tags are embedded data chips that take the place of barcodes.
7
As the case studies show, even with relatively small datasets, conducting the correct analysis or finding the hidden pattern can help a public entity reduce its operating costs and optimize its day-to-day effectiveness. Big data analytics can reduce the time it takes to spot bottlenecks and inefficiencies, thus allowing the public sector to address immediate issues in a streamlined, rapid, and targeted manner. Analysis of big data trends can strengthen or tailor specific policy interventions or public services by limiting manual processing time and providing more precise evidence for decision making. Data may come as extremely large, complex, and dynamic information whose benefit is not always obvious, or they may be highly time sensitive. Additional important characteristics of big data analytics are outlined below: ● Machine learning: Data analysis is often highly automated. Patterns in the data are automatically identified by powerful analytics programs tied to powerful computers which learn from the stream of information though probabilistic or
8
geometric models rather than being explicitly programmed by an individual. ● Digital footprint: Big data is often a cost-free byproduct of digital interaction. By virtue of the ICT tools at the world’s disposal, everyday activities, from tweets to texts to credit card payments, leave behind digital footprints that are aggregated into big data. ● Variability: In addition to increases in the velocity and variety of data, data flows can be inconsistent with periodic peaks, requiring organizations to design highly adaptive systems to allocate their scarce data storage and processing resources efficiently. An example is the spike in social media and communication data following a natural disaster. ● Complexity: Because data come from multiple sources, in different formats, it is increasingly difficult to link, match, cleanse, and transform data across systems. Without the proper analytical methodology and protocols, big data analytics can lose its timeliness and value.
METHODOLOGY
I
n light of the scale of challenges and opportunities that cutting-edge data collection and analysis represent for the public sector throughout the LAC region, this paper presents case studies that focus on areas where processing and analyzing big data offers promising solutions in various areas associated with social and economic development: smart cities, taxation, and citizen security. The case studies represent policy spaces that are common to all countries as well as those in which big data analytics has shown to be a valuable ICT tool for strengthening public sector capacity. They demonstrate efforts to remove endemic knowledge-sharing failures of public service delivery that many developing countries face. For example, many countries suffer from a low tax-to-GDP ratio and high levels of tax evasion, which dramatically reduces a government’s ability to generate revenue that funds important goods and services. The combination of powerful information systems and regulatory frameworks offers an opportunity to reverse this by increasing the tax base and detecting fraudulent activity. With regard to citizen security, many LAC countries are facing levels of violence that are adversely affecting the quality of life of many citizens. Combining predictive analytics with innovative management structures may provide real-time insights for curbing high levels of petty crime, organized crime, and trafficking. Additionally, recent global efforts to create “smarter” data-driven cities provide LAC
municipalities with tools for addressing issues tied to high urbanization rates and overburdened or absent public transportation systems. Emphasis was placed on selecting cases in which a significant amount of relevant information could be accessed to explore each topic thoroughly. In this study, we conducted desk research from international public and private publications regarding the current and potential uses for big data in the public sector and interviewed practitioners and academics in the field. The interviews focused on the practical application of big data in the public sector, with insights on less visible obstacles and the specific technologies being utilized. To provide a comprehensive and holistic account of the factors that led to the successful implementation of big data systems, this report focuses on two key elements. The first are the institutional arrangements that are conducive to the successful establishment of information systems. This is further broken down into (i) formal institutions, including policy, governance structures, and the legal regulatory framework; and (ii) implications, including externalities such as the behavioral impact of data-driven management structures on civil servants. The second are the technical aspects of information systems, including both infrastructure and physical capital. This covers human capital and operational procedures required to efficiently operate a big data system. To properly showcase the complex interactions between the multiple factors presented 9
above, different narrative structures were created for each case study. This reflects the heterogeneity of the context of each example, including the variety of institutional and technical dimensions. Ultimately, each case is designed to illustrate how governments incorporated big data analytics for improving policy design and service delivery with a particular focus on the primary barriers to success and how they were overcome in each case. Because of the different contexts, investments, and outcomes, the case studies are
10
descriptive. The policy guide at the end of this report lists the main recommendations. One limitation of the study was the scant access to information on the financial costs and investments in the integration or scaling of big data technologies and human capital in the public and private spheres. Literature from private firms emphasizes reduced costs over the long term and positive externalities that arise from data creation, curation, and usage in the public and private sectors.
SMART CITIES
A
s a result of London’s impressive rate of population growth—12 percent in the past decade—and the growing strain on the city’s infrastructure, Mayor Boris Johnson launched the 2020 Vision Report in 2012. This report laid out a strategy focused on creating complementary Smart City initiatives by leveraging the technological expertise of the private sector, including human and social capital and the municipal authority’s ability to coordinate with local firms. It underscored the need to transform the city’s data ecosystem into one that is both centralized and open, embodied in the Smart London Plan, and to maximize the benefits of daily collection and analysis of huge quantities of information by the city’s multiple public and private organizations. This case study identifies the challenges and opportunities faced by Transport for London (TfL), the local government body responsible for the majority of London’s public transportation networks, as it integrates itself within this new structure. In recent years, the organization has dramatically altered its data management and processing operations to streamline the data collection and analytics process, which has dramatically improved their ability to understand the behavior of their customers and identify components of the transport network that are particularly critical and vulnerable.
Urbanization and Development: A Cutting-Edge Solution To address the many challenges brought about by rapid global urbanization, a range of stakeholders have pushed for the implementation of innovative initiatives that would integrate multiple technological systems designed to address issues such high energy consumption and outmoded public transit systems. In Latin America, over 80 percent of the population now lives in cities, leading to an unparalleled rate of urbanization (Paranagua, 2012). These economic centers now account for over two-thirds of the LAC region’s gross national product (GNP). UN-Habitat predicts that these urban centers will continue to expand and fuel Latin American’s growth for years to come (UN-Habitat, 2012).
As populations continue to migrate from rural to urban areas, ensuring that cities are efficiently governed will be an important task for policymakers. Economic growth, public service delivery,environmental sustainability, and social welfare will require special attention. Urban centers that make use of hightech data configurations to address the issues mentioned above are increasingly being referred to as “smart cities.” They integrate investment in human and social capital— through educational opportunities and public forums and discussions—with the expansion of traditional (transportation) and modern (ICT) communication infrastructures to fuel 11
sustainable economic growth while promising urban dwellers a higher quality of life (Berst, 2015). Smart cities typically have a combination of ccomponents, including the following: ● Technological factors: physical infrastructure; smart, virtual, and mobile technologies; digital networks ● Data collection tools: human-directed (surveillance through satellites, drones, CCTV), automated (digital devices, sensors, transponders, financial transactions), and volunteered (social media, crowdsourcing, etc.) ● Human factors: engineers, skilled statisticians and computer scientists and specialized teams sensitive to data ethics and regulations ● Institutional factors: governance, policy, regulations, and directives oriented
toward effectively promoting the use of data to address specific urban challenges The research conducted on London’s Smart City initiative revealed that the keys to their success were (i) the establishment of a clear vision and implementation strategy, (ii) successful integration of necessary technological factors under the supervision of skilled professionals, and (iii) the development of a flexible institutional arrangement that is conducive to the creation of a governance structure that can efficiently absorb and process increasingly large volumes of data. To showcase the importance of combining these factors, we will analyze the example of London, Western Europe’s most populous city, which has pursued a cutting-edge strategy in response to urban challenges that are particularly relevant to Latin American megacities.
London Context, Vision, Strategy London boasts the sixth highest gross domestic product (GDP) of any metropolitan area, which is a testament to the city’s key position in the globalized economy. Yet, it is not immune to the many complex municipal infrastructure and public service delivery challenges facing cities across the globe (Hill, 2015). As a result of London’s position as a true global city, more and more people are migrating to this economic hub in search of employment and lifestyle opportunities. The impressive rate of population growth—12 percent since 2001 (Hill, 2015)—in London’s metropolitan area rivals that of Latin American cities, and it is expected to grow by over 1 million people in the next decade. The strain that this huge influx of people will place on the city’s infrastructure is of great concern to city managers. They face two main challenges: ensuring that the city’s physical infrastructures will allow them to provide high-quality public services, 12
and maintaining a socioeconomic environment that encourages private sector growth and innovation. The similarities between London and Latin America’s rapidly urbanizing cities provides the impetus for analyzing the measures implemented by the City of London’s managers to both find solutions to its pressing short- and long-term challenges. In 2012, Mayor Boris Johnson issued a report, entitled Vision 2020, which set forth a framework that he believed would allow London to thrive in the coming decades. To ensure that the city’s infrastructure could accommodate the growing population, his agenda focused on leveraging the private and civilian sectors. Mayor Johnson wanted to tap into a combination of the private sector’s impressive technological expertise, the human capital and networks of Londoners, and the municipal authority’s ability to coordinate with local firms. The Mayor’s Office issued two reports
detailing its strategy: the London Infrastructure Plan 2050 in 2013 (Mayor of London, 2015), designed to channel public resources to the large-scale projects where they are most needed, and the Smart London Plan in 2014, focused on ensuring that London continues to leverage its technological expertise and transitions towards a data-driven city. This plan was drafted by the Smart London Board, a recently created panel of experts, including academics, business leaders, and entrepreneurs working together to advise the Mayor on data policy. It is the primary framework for the numerous smart city initiatives that London will pursue. A core objective of the plan is to transform London’s data environment into one in which data are openly shared and centralized. These data will be made available to the general public through the London Datastore and the London Dashboard, public open data repositories that provide realtime information on a range of topics, from crime rates to Tube delays. Furthermore,
by ensuring that the multiple organizations that compose the Greater London Authority pool their data together, the Greater London Authority’s Intelligence Team—which is the independent public organization responsible for conducting socioeconomic and statistical research and providing local authorities with the evidence they need to formulate policy and strategy—will have access to a much larger volume and variety of data. To illustrate how these multiple policy papers, public organizations, and data infrastructures are intending to transform London into a smarter city, this case study focuses on a specific policy space—transportation—to provide an in-depth analysis of the complexity of integrating a large public organization into a smart city plan, and the opportunities that it creates for the public sector. For a more detailed summary of the Greater London Authority’s governance structure, the London Infrastructure Plan 2050, and the Smart London Plan, please refer to the Annex.
Institutional Arrangements TfL is the local government body responsible for most components of the Great London Area’s public transportatiopn network. The Greater London Authority oversees TfL, under the direction of a board of directors headed by the Mayor of London (GLA, undated). The board develops and applies policies to promote and encourage safe, integrated, and efficient transportation facilities. The body is organized in three main directorates: the London Underground, London Rail, and Surface Transport. Each is responsible for different aspects and modes of transportation. Each of these bodies consists of a number of subsidiaries that are responsible for managing specific components of the transportation system. London’s Buses, for example, is responsible
for managing the red bus network and contracting services to private sector companies. TfL’s operations are centrally managed from the Surface Transport and Traffic Operations Centre, which uses real-time surveillance and analytics to monitor and coordinate responses to traffic congestion and incidents. Transportation showcases the potential of combining open and big data initiatives, and how London’s strategy has allowed the city to realize both short- and long-term gains. By combining bottom-up accountability tools to obtain direct feedback from people and the extensive collection and analysis of wide variety of digital data streams, TfL has pursued a development strategy that will increase public well-being and allow the London Infrastructure 13
Delivery Board (LIDB) to plan large, costly infrastructure projects according to the evolving needs and preferences of stakeholders. In 2013, an analysis conducted by TfL found that the demand for public transportation is likely to increase by 50 percent by 2050 (Mayor of London, 2015). Furthermore, the Intelligence Unit of the Greater London Authority (GLA) estimates that the cost of running the city’s transportation system will climb
from 1.5 percent to 3 percent of the GLA’s total capital expenditure, an increase of £50 billion, and that this figure could be much higher if the transit system is not upgraded in a timely fashion. The scale of the investments that must be made to improve London’s infrastructure is likely to mirror the scale of the cost to Latin America’s megacities, which must also continue to meet the needs of their growing populations.
Data Collected For more than a decade, TfL has worked to incorporate the data it collects daily from people using its multiple services into its organizational body. It began these step toward becoming a data-driven public service provider in 2005, when it formed a partnership with the Massachusetts Institute of Technology (MIT) to find new ways to exploit the data it was collecting to relay highly personalized information on service disturbances along their commuting routes and to plan future upgrades to the transportation system. More recently, TfL has made large investments to radically improve its data management to allow its 517 full-time IT staff to take full advantage of the high volume of information they are collecting (Shah, 2014). In 2014, TfL selected services from the analytics firm Tibco to bring together data resources across the organization’s multiple directorates (Shah, 2014). The goal was to create a centralized data infrastructure and improve the data collection and analytics process (Rossi, 2015). Concurrently, it invested in tech firm SAP’s in-memory analytics software HANA to manage and improve decision-making in real time, allowing TfL to go from overnight processing to having the data processed almost immediately (Shah, 2016). TfL’s recent push to centralize its data management operation by investing in 14
cutting-edge analytics and information systems are now allowing it to collect enormous amounts of data from a variety of sources (POST, 2014). The data gathered from the TfL’s many directorates and subsidiaries allows it to: ● Operate the largest smart ticketing system in England, the ‘Oyster’ card contactless payment system. Recording the time, location, and date of use of the card allows them to track people’s use of the mass transit system. The system has also been upgraded to allow people to pay with their contactless credit cards, further enhancing the data collection potential of this system (POST, 2014). ● Utilize fixed sensors that can provide data on the degree of congestion on a particular road. ● Combine mobile sensors, such a floating vehicle data, which use data collected through mobile phones, GPS trackers, or on-board navigation systems to give a picture of general traffic conditions on roads. These sensors are used to monitor the movement of London’s 19,000 buses. ● Include sensors on bike rental stations, such as the Barclays Cycle hire, that provide real-time information on the
availability of bicycles and the patterns of bike rentals. ● Provide a Wi-Fi system, which can be used to track the movement of people inside the Tube’s many hallways to provide a clear picture of the flow of people as they commute to and from work (Shah, 2014). TfL analyzes the data collected for two main purposes: improving customer experience and conducting research to determine the upgrades that must be made to the transportation infrastructure. Although there is little public information on TfL’s Customer Experience Analytics Team, this unit focuses on utilizing TfL’s data to provide users with real-time information that increases their well-being by providing a information on traffic and transit congestion, scheduled service disruptions, and other conditions (Feldman, 2015). This highly specialized team studyies the travel behavior of individuals using Oyster card data, developing personalized services for customers who request tailored information. It uses predictive analytics to mitigate against platform and train congestion at stations and innovative
data mining tools and geospatial visualizations (Feldman, 2015). While it is difficult to obtain a rigorous account of the exact analytical processes used by TfL’s data scientists and engineers, and the size and composition of this team, its efforts have already led to the creation of numerous services for it clients (Mayor of London, 2014). These include: ● The Barclays Cycle hire, which has provided Londoners with over 25 million bike trips since 2010 and created an open data stream broadcasted on TfL’s website that provides real-time information on the usage of their bicycle system. ● Tracking the movement and speed of all London buses, which led to the creation of the “Countdown” service. This service provides live bus arrival information for all 19,000 buses and allows TfL staff to quickly detect service disruptions. ● Providing its customers with e-mails regarding planned service disruptions along their most common travel routes.
Predictive Analytics With regard to long-term infrastructure planning, TfL’s planning team has developed the London Land-Use and Transport Interaction Model (LonLUTI) and the London Transportation Studies Model (LTS) to prepare forecasts of growth in total travel, changes in travel patterns, and modes of transportation chosen, to identify where infrastructure upgrades must be made (TfL, 2014). The LonLUTI is a predictive analytics model that combines data regarding land use by firms, residents, developers and transportation service and infrastructure suppliers to forecast where demand for mass transit services will increase in the future (Feldman, 2015). Using
these insights, the LIDB—with the support of the GLA’s Intelligence Unit—has been able to prioritize transportation-related infrastructure upgrades (Mayor of London, 2015). The top priorities are the following: ● An impressive railway system upgrade intended to connect 200,000 homes north of London to the center of the city (with £2 million of initial funding from the Government) ● An extensive program to upgrade the city’s underground railway system, increasing its passenger capacity by 30 percent 15
● Improving the city’s business junctions to improve facilities for cyclists and pedestrians ● The creation of two tunnels to connect neighborhoods currently isolated from the economic center The establishment of Smart London Plan has led TfL to share an increasingly large amount of its data on the London Datastore (Mayor of London, undated). The open data initiative has allowed private software developers and citizens to gain access to a wealth of information that can be used to provide Londoners with ad hoc services that rely on powerful analytics software and real-time information. These initiatives include: ● A number of third-party apps, such as Citymapper, which use the open-source data compiled and shared by TfL to provide their clients with optimized travel routes, real-time public transportation planning, and other services ● London Buses Countdown service, used to create over 60 transport apps that provide real-time information for TfL’s passengers ● Collaboration with academic and research institutions, including MIT, Oxford University, and University of Cambridge, to explore ways to use this large volume of data for future data analytics to support Smart London Initiatives (Feldman, 2015) ● TfL’s innovation portal, designed to encourage entrepreneurs to submit innovative technological solutions to pressing issues relating to London’s transportation network Overall, TfL’s integration within London’s Smart City initiative reveals the challenges and
opportunities faced by the public sector in this context. Even though it is undeniable that TfL has been at the forefront of the data-driven management of transportation networks for decades, Smart London’s emphasis on open data initiatives, and the organization’s recent push to centralize and optimize its data collection and analytics processes are testaments to the potential of these types of policies for maximizing costefficiency in public services and dramatically increasing the value and utility of data. The fact that TfL has pursued a data-driven strategy for decades makes it difficult to evaluate the exact impact that the Smart London Plan will have on improving service delivery. However, the increasing level of cooperation between diverse local stakeholders showcases the role of smart city initiatives in improving the data ecosystem and regulatory framework of the urban environment in which they are implemented. Considering that the Smart London Plan was only implemented recently, much remains to be seen regarding the extent to which the GLA’s other organizations will also benefit from TfL’s data deluge, but the current efforts and strategy papers are quite promising. In particular, the recent shift toward an open data regulatory framework has led public organizations to greatly increase the quantity of information that they share, even within a body as integrated as TfL (Card, 2015). This will greatly increase the value of the data collected and will increase the return on investment of collecting and processing large quantities of information. Within TfL, this transpires through the fact that both TfL Planning and TfL’s Customer Experience team utilize the same information, collected from disparate partners, to ultimately achieve radically different outcomes (Feldman, 2015).
Smart Cities: Policy Papers The main policy papers highlighted in the case study, mainly the London Infrastructure Plan 16
2050 and the Smart London Plan, are summarized below.
The London Infrastructure Plan 2050 The London Infrastructure Plan 2050, the first of its kind, was drawn up by the Office of the Mayor of London to guide the development of London’s physical infrastructure for the next three decades. It focuses on upgrading the city’s mass transit system, increasing its hub capacity, managing energy demand to meet climate change goals, improving the city’s digital infrastructure, managing water supplies, and transitioning to a “green” infrastructure, among other challenges. The London Infrastructure Delivery Board, an independent authority, was established in 2014
to provide the leadership necessary to ensure the proper delivery of infrastructure projects. The Board will ensure the strategic continuity of the plan in consultation with utility companies, regulators, and the public infrastructure planning authorities by adapting the city’s regulatory framework to each stakeholder’s incentives and objectives. The report emphasizes the need to leverage London’s position as a world leader in cutting-edge technologies to promote data sharing through open data initiatives and ensure that the city can proactively address future challenges.
The Smart London Board and Smart London Plan In March 2013, the Mayor of London established the Smart London Board, a panel of academics, business leaders, and entrepreneurs, to advise the Mayor and the London Enterprise Panel on how to make London smarter by integrating data and technology. The initial output of this board was the Smart London Plan, which is designed to promote the synergy between the capital’s systems—from local government to health care delivery and utilities—and state-of-the-art digital technology.2 This objective will be achieved by identifying opportunities and priorities for the public sector, driving citizens to voice their concerns and maximize the return on their human and social capital, and by incentivizing private investment in state-of-the-art technology. The Plan aims to allow the city to build on its innovation lead by promoting the establishment of evolving interventions designed to “integrate opportunities from new digital technologies
2
into the fabric of London,” regulated by an overarching open data framework (Mayor of London, 2014: 3). Overall, the Mayor of London’s smart city approach involves promoting the collaboration and engagement of multiple stakeholders, increasing efficiency in resource management, supporting technological innovation, and creating transparent open data initiatives to improve the lives of Londoners. This strategies to achieve this vision include investing in enterprises, training, infrastructure, environmental protection, the health and well-being of people, and the mass transit system. The plan is particularly well designed for London’s context because it allows public organizations that have invested heavily in data collection and processing in recent years to seamlessly integrate within London’s new cutting-edge data infrastructure and open data regulatory framework.
Smart London Plan: http://www.london.gov.uk/sites/default/files/smart_london_plan.pdf
17
Institutional Framework This section describes London’s larger governance structure, and how the multiple public bodies discussed in the smart city case study, including the GLA, the Mayor of London, the London Assembly, TfL, and the GLA’s Intelligence Unit, are linked together. London’s governance structure comprises a number of national, city, and sub-city actors (Figure 2). The GLA, which employs most of the actors discussed in our case study, is the top-tier administrative body of the GLA. It is composed of an elected official—the Mayor of London—and 25 elected members of the London Assembly. The GLA is funded primarily by direct government grants and collects some funds
through the local Council tax. This large public organization’s governance structure is unique in the United Kingdom in terms of structure, election, and selection of powers. The GLA has three functional bodies: Transport for London, the Mayor’s Office for Policing and Crime, and London Fire and Emergency Planning Authority. Each one is responsible for delivering specific public services. Even though TfL only captures roughly 1.5 percent of the GLA’s total capital expenditure, it captures 60 percent of the GLA’s total expenditure, which indicates the importance of its position within the overall structure (Rode et al., 2014).
Figure 2. Governance Structure of the Greater London Authority
LONDON
Multi-Level Governance National level
governance structure ECONOMY
ENVIRONMENT & PLANNING
2014-2015
INFRASTRUCTURE & TRANSPORT
EDUCATION & CULTURE
HEALTH & SOCIAL SERVICES
SECURITY
OTHER
defence
hm treasury
home office
cabinet office
justice
communities & local government
16 of 24 Departments
environment, food & rural affairs
WORK & PENSIONS
energy & climate change
Sub-city level
greater london expenditure uk central government
BUSINESS, INNOVATION & SKILLS
City level
transport
education
health
culture, media & sport
100%
90%
UK EXPORT FINANCE
Foreign & common wealth office
ECONOMY ENVIRONMENT & PLANNING
greater london authority (mayor and assembly) 7%
INFRASTRUCTURE & TRANSPORT
transport for London 60%
SECURITY
POLICE AND SECURITY 29%
80%
70%
60%
greater london authority BUSINESS & ECONOMY
environment PLANNING
transport FOR LONDON
culture
health & SPORT REGENERATION HOUSING
50%
MAYOR'S OFFICE FOR POLICING & CRIME / METROPOLITAN POLICE
40%
LONDON FIRE & EMERGENCY PLANNING AUTHORITY / LONDON FIRE BRIGADE
30%
20%
33 london BOROUGHS BUSINESS & ECONOMY
environment PLANNING
LOCAL TRANSPORT
EDUCATION
HOUSING
LOCAL SERVICES
10%
SOCIAL SERVICES 0%
18
fire & emergency 4% Source: Rode et al. (2014).
The Greater London Authority’s Intelligence Team At the core of London’s data ecosystem lies the Greater London Authority’s Intelligence team, the organization responsible for conducting socioeconomic and statistical research to provide local authorities with the evidence they need to formulate policy and strategy. The Intelligence Unit, housed in City Hall, works to assist policymakers in formulating open data policies and more importantly to provide forecasts on the economy, labor markets, and demographic trends. It draws on data provided by a host of actors, including the cluster of public organizations that constitute the GLA, Transport for London, the London Fire and Emergency Planning Authority, and the Office of the Mayor. An extensive open data regulatory framework ensures that information is efficiently and transparently transferred from these organizations in accordance with the objectives outlined in the Smart London Plan (GLA, undated).
The GLA’s Intelligence Unit shares the data it has collected and processed on The London Datastore and The London Dashboard, two public open data repositories that provide real-time information on a range of topics, from crime rates to Tube delays. The Mayor of London is responsible for The London Datastore, but the assistant director of the Intelligence Unit directly manages it. The Intelligence Unit is also currently working on the City Data Strategy, “a much needed means of ensuring secure supply and sharing of meaningful ‘city data’ and providing data suppliers and value generators with the right set of motives and incentives to make the London data economy turn faster still” (GLA, undated). Unfortunately, there is scant information regarding this initiative, but it is a testament to the desire of local policymakers to create a data environment that fosters the exchange of data between private and public actors.
19
TAXATION
A
s is the case in many developing economies, taxation challenges in LAC countries include tax evasion, low collection rates, and weak tax administration. Tax evasion and income tax fraud are the main problems identified and addressed in this three-country case study. Brazil, China, and the United States have used big data to formulate, improve, and manage tax policy and administration in diverse environments through fairly similar policies and tools. Each state agency studied created efficiencies by enhancing their ability to audit transactions and tax filings and improving external monitoring and support of personal income and business tax filings.
Leveraging Big Data for Taxation: A Three-Country Study Although LAC countries fare better than other developing countries (IMF, 2011), taxation in LAC is characterized by low collection, unprogressive bracketing with rampant evasion, and very weak tax administration (Corbacho, Fretes Cibils, and Lora, 2013). This is especially true for countries with a thriving informal sector, where business and other direct taxes are hard to collect because of its ambiguous, unregulated nature. It is therefore no surprise that tax collection generates only 17 percent of GDP in LAC and tax administration remains a key policy area of concern (Corbacho, Fretes Cibils, and Lora, 2013).3 Though challenges are complex and context-specific, optimizing revenue earnings, expanding the tax base, and combating weak tax administration and tax evasion are major objectives of all governments. A common contributing factor to this scenario is the high transaction cost for reporting, which leads to evasion. Tax subjects skirt provisions and obligations as
they attempt to exploit systemic complexities, such as erroneous information on how to classify goods and services. Many countries have begun to overcome these barriers by operationalizing official mandates—implementing agreed guidelines and policies as mandated—by which governments can create and access high volumes of tax-relevant data from multiple sources. These range from public records, products of various routine government functions, to business or other processes that require government oversight. These data resources are valuable, as they can be used to collect taxes, support audit and monitoring efforts, and facilitate economic policy design and implementation. Currently, 159 out of the 193 UN member states utilize ICT-intensive systems for tax management (World Bank, 2016). Solutions are as varied as the unique challenges that each county faces.
3 IDB publication on taxes, firm size, and productivity in Latin American and Caribbean Countries. Available at http://idbdocs.iadb.org/wsdocs/ getdocument.aspx?docnum=35101307
21
As the cases from Brazil, China, and the United States illustrate, governments have harnessed the power of large scale data to achieve efficient tax administration by streamlining
business processes, creating electronic platforms to centralize information processing and integrate platforms to facilitate the exchange of information among government departments.
CHINA China is utilizing big data for taxation in various ways. The value-added tax (VAT) contributes more revenue than any other tax (Shuanglin, 2008), and was estimated at 43 percent of total tax revenue in 2012 (Wu, 2013). For many years, tax evasion was high due to loopholes in monitoring transactions, leading to a revenue loss of US$15.9 billion in 2012 (Qing, 2013). Some businesses were found not to have issued invoices, a key input in the tax payment and verification process. There was a need to standardize the e-commerce industry to address such gaps and avoid the use of fake documentation that enabled the tax evasion.
Specific challenges in administering the VAT for China were counterfeiting, invoice reselling, or outright theft of invoices (Xing and Whalley, 2014). Today, China’s tax administration system makes extensive use of big data solutions that use multi- and cross-referencing to verify business information. Simultaneous monitoring and auditing efforts facilitate tax filing by business owners where data gaps or discrepancies exist. China’s National Development and Reform Commission piloted a nationwide program aimed at enabling the issuance of invoices via an online tax system to address the loopholes.
Governance Structure and Regulatory Framework The focus of this case study is the Golden Tax Project (GTP), which was part of the broader economic reform program that China initiated in the 1970s. The GTP mandates the use of specific, sophisticated ICTs to improve compliance with China’s VAT laws (Winn and Zhang, 2010). The project, established in 1994, relies on a database built from the electronic VAT invoices collected as part of the management information system for tax administration (Xing and Whalley, 2014). The government also uses this information to analyze internal trade patterns and design policies based on the insights generated (Xing and Whalley, 2014). As part of the ongoing GTP efforts, China’s State Administration of Taxation
22
(SAT) created the Administrative Measures for Online Electronic Invoices (SAT Order No. 30), which standardizes the issuance and use of online electronic invoices. The Measures came into effect on April 1, 2013. The system serves the dual purpose of enhancing the efficiency of tax filing for taxpayers and of tax administration for tax authorities. It doe s more than electronically process documents; it is also a source of data that informs the monitoring, coordination, and general tax administration duties and tasks. The GTP is a single platform, deployed at all provincial and municipal levels. It is mainly run over subnational computer networks managed by the respective tax authorities.
Technical Considerations The GTP was deployed in three phases. The first phase was the National Computer Inspection Network System of VAT Special Invoices, in 1994 (Winn and Zhang, 2010). It involved an invoice cross-inspection system, focused on collecting invoices for transactions over 5,000 Chinese Yen and was piloted in fifty major cities. Initially, tax authority staff entered data manually into the system. However, due to the errors caused by manual data entry, a second phase was rolled out in 1998. This second phase was referred to as the “one network, four subsystems” as stated by Xu Shanda, a Vice Commissioner of State Administration of Taxation. It was designed to enhance the system’s capacity to detect counterfeit invoices, entry errors, and fraud attempts across more tax department levels and at the
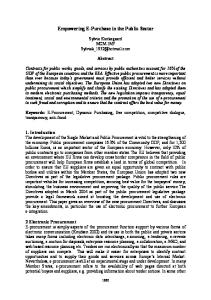
provincial, prefecture, state, and national levels. a single computer network linked tax authorities at the provincial, municipal, and country levels, which enabled cross-referencing and enlarged the database (Winn and Zhang, 2010). This improvement of the system led to a decrease in dubious VAT-specific invoices from 300,000 to 20,000 per month (Yu, 2003). The third phase of the system, constructed in 2006, includes subsystems that execute management, collection, inspection, punishment, implementation, remedy, and supervision functions (Figure 1). The system is able to generate VAT invoices automatically using the anti-counterfeiting subsystem and investigate sources of dubious invoices by location and business type, and monitor progress of the invoice to the next stage of processing using set criteria.
Figure 1: Management and Control Process of GTP: Phase III Stop selling if any problem
Selling invoice
Investigation
Input invoicing system
Invoicing
Problematic invoices after investigation
Invoices that do not pass enter the investigation system
Inspection
Counterfoil and credit invoices inputted into inspection system
Declare invoice data and return payment result
VAT payment
Credit certification
Obtain credit after credit invoice certification
Source: Xing and Whalley (2014). 23
Infrastructure and Physical Capital Factors Two factors that have enabled China to design and implement the system in such a vast economy are its globally competitive domestic ICT enterprises and its advanced ICT technology (Winn and Zhang, 2010). Countries interested in learning from China’s example can use existing international standards for e-invoicing to establish similar platforms. The GTP presents an innovative fiscal and administrative reform process that is seen to have delivered dividends in ensuring compliance with tax laws, reduction of monitoring costs, and increased global competitiveness of local businesses due to the efficiencies derived from the use of and familiarity with such a system (Winn and Zhang, 2010). It is primarily a government-run and -controlled system that augments the government’s ability to monitor and oversee tax administration. Although it takes up to a month to verify whether an invoice is correspondingly used to file VAT returns, the system nevertheless provides an efficient tool for verification, and the SAT has adopted a
progressive improvement model that fixes such gaps (IMF, 2011). Across borders: On 27 August 2013, China signed the Multilateral Convention on Mutual Administrative Assistance in Tax Matters at the Organisation for Economic Co-operation and Development (OECD). This convention sets automatic exchange of information as the new, global standard. Mexico and Brazil are also signatories to the convention. This is the most comprehensive multilateral tax instrument available. It provides all forms of administrative assistance including spontaneous exchange of information, simultaneous tax examinations, and assistance with tax collection. A valuable tool for governments to fight offshore tax evasion, the convention also ensures compliance with national tax laws and respects the rights of taxpayers by protecting the confidentiality of the information exchanged. In an increasingly globalized and interconnected world, tax cooperation and tax compliance are of crucial importance for all countries and citizens.
The Fapiao The VAT is collected using a simple pre-payment electronic transaction support and monitoring system. Mandatory electronic invoices must be issued to verify payments. One such invoice is the fapiao. How it works: Business owners register with the tax authorities to open an account with the relevant provincial tax authority. During business transactions, they fill out the details of the transaction and the taxes charged and issue the electronic fapiao. The relevant tax authority verifies the fapiao by matching the information provided against that held in the online system (business name, business address, unique business identification number, province, etc.). For tax purposes, the reported business income 24
and information must match those held in the system depending on the invoices issued. Any discrepancies or inaccuracies are investigated and appropriate action is taken. Fapiao are purchased in advance from the tax authority to the value of a month or a year’s worth of projected tax collections as recorded by the business entity. In essence, business owners pay the tax in advance. Business owners are required to issue fapiao—the tax invoice—reflecting the total value of each transaction. These have become very useful in monitoring and combating tax evasion, especially in a cash- based economy such as China’s. Firms then can claim refunds for any unissued invoices since the purchase is made in advance. This has
enhanced the government’s ability to verify tax filings against reported transactions as a way of thwarting tax evasion. In addition, it gives the government a basis for projections of business volume for a financial year, which helps in fiscal planning (e.g., foreign exchange supply and control), support, and monitoring. Each fapiao has a unique number that legitimizes it. Customers can verify its authenticity through an instant text messaging service to a government hotline before accepting it as issued by a business entity. Customers are particularly encouraged to do this because the government uses lottery scratch cards tied to these invoices. This incentivizes all participants in the process to ask for these invoices in a bid to increase their chances of winning. A unique feature of this collaboration is the interaction of telecommunications systems collaborating with government verification mechanisms to close loopholes. This is through a free text messaging service platform run by the government that enables clients to verify, in real time, invoice legitimacy before accepting it. The data captured on the invoice are what delivers the dividends in terms of enabling the revenue collection. Controls: Any changes to the invoice must be authorized by the tax authorities. These changes may include details unique to the business (name, license numbers, classification, etc.) The buyer also has the ability to check the accuracy of the information on the invoice and may reject it in case of inaccuracies, in which case it cannot be used for tax submission. This provides a systematic control against tax evasion or fraud even at the point of first contact of
the business process. Provinces are allowed to pilot the system to assess its feasibility, and they can recommend to the state tax agency any intrinsic or systemic adjustments necessary depending on the uniqueness of their experiences. Furthermore, allowances were made for users experiencing bad Internet connections; they can issue the invoice manually and then upload it within 48 hours following a transaction. This sustains the vital information provision function of the system for effective tax administration. Big data elements: This invoicing and VAT system has inherent connections to business licensing, foreign exchange controls, and other elements of the business environment. By monitoring the reported volumes of trade, the government can deduce the nature of transactions (whether goods or services) to ensure accurate reporting by business owners. This has the immediate effect of ensuring effective taxation but also the long-term effect of providing information to public officials regarding business needs and transaction trends, and thus improving policymaking. For example, business classification under Chinese law requires specific sets of information on registration, issuance of invoices, and general tax filing. This creates an information exchange and verification mechanism that utilizes business information and unique identity to verify taxpayers even among different government agencies, specifically, licensing and taxation agencies. This system provides other indicators and datasets for the government to use in tax auditing, monitoring, and other roles besides the recording of business transactions.
BRAZIL Brazil was one of the first countries to adopt the VAT system and is one the fastest adopters of ICTs historically (Edicomgroup, 2016). Brazil’s states have different tax rates as part
of their respective tax regimes, which presents both challenges and opportunities for tax administration. Brazil experiences high tax evasion, especially when business owners try to take 25
advantage of the different tax regimes across states. In 2015, Brazil was ranked 120th out of 189 countries on the World Bank’s Ease of Doing Business Index (World Bank, 2014). This ranking is largely attributed to the complexity of navigating the country’s registration, licensing,
and tax payment systems. Brazil’s tax system is legislated by 27 different authorities; thus, there is a real demand for a functioning tax administration environment that will attract foreign investment and ensure smoother domestic processes.
Governance, Regulatory Framework, and Standardization Brazil’s federal government introduced the Public Digital Bookkeeping System (Sistema Público de Escrituração Digital, or SPED). The SPED project is part of the federal government’s efforts to optimize the key Brazilian public infrastructure aimed at standardizing the exchange of information through informatics. It aims to facilitate fiscal administration with respect to the integration and exchange of tax information, as provided in Article 37 of Brazil’s Constitution. This system was created in 2002 to standardize taxation procedures and computerize the relationship between tax authorities and taxpayers. It became operational in 2008; by 2012, most companies were using it to manage their taxes. It is run by the Brazilian Internal Revenue Service. The system was created by decree, 4 for the purpose of standardizing and sharing financial and tax information, subject to legal restrictions; streamlining and standardizing taxpayer obligations through different regulatory agencies, rapid identification of tax offenses, while enhancing the speed of access, process, control and oversight of tax operations. This program aims to change the way businesses and individuals file taxes by standardizing forms and other documents. This is done via an electronic platform that enables government to cross-check information with other databases and initiate audits in case of
4
26
Decree Number 6.022/2007.
red flags. With respect to income tax, it prepopulates information forms with user details based on their official identity. Central to the system is the ability to identify any departures from legal tax filing provisions within the existing laws. This is facilitated by the integration of tax administration platforms at the federal, state, and municipal levels. This system comprises the following five components (Thebrazilbusinesscom, 2016): ● Nota Fiscal Eletrônica (NF-e): a standard electronic fiscal documents that is issued and stored electronically, with the validation of the issuer through digital signature; ● Conhecimento de Transporte Eletrônico (CT-e): a transport authorization document, issued and stored electronically, that enables the movement of goods or cargo. ● Escrituração Fiscal Digital (EFD): a digital file that contains information about taxpayers and their history, registration, tax calculations and payments, concessions due, and other information. Individuals file their taxes through a computer program and platform for this purpose. ● Escrituração Contábil Digital (ECD): an obligatory portal for filing and saving documents for all businesses.
● Nota Fiscal de Serviços Eletrônica (NFS-e): a digital document designed specifically for service providers, which is stored on the government’s website. Information contained in this document can be used by both clients and the tax authorities to verify business information and legitimacy. All five components of the system store and process specialized data according to the nature of business, the license, and the purpose of the transaction. Digital signature and certification are the key elements of this process. All taxpayers are required to register and are subsequently assigned a unique identifier in the system, which enables them to use processes embedded in it. To move goods, the tax authority has to evaluate and provide authorization for the legal transport of merchandise. This system supports many business processes, such as freight-forwarding documents, cancellation of documents, rejection of documents, submission of accompanying documentation, and authorizations to partners. One unique feature of this system is the integration of business and government platforms, which enables fast and simultaneous invoicing, tax filing, and authorization for tax purposes. The structure of the system provides a centralized data repository and common workspace for communications between companies and the government, as well as for a company and a competing, complementary, or subsidiary company’s systems through the various verification platforms and publicly held information. It enables file sharing under the law through easily accessible document interfaces. SPED has also improved business-to-government (B2G) and business-to-business (B2B) communication through the use of government-provided forms and rules. Inbuilt pre-authorization protocols ensure transparent reporting, data capture, and
verification by the tax authority. Sender verification tied to pre-registered sender identities enables monitoring, follow-up, and auditing. The documents generated also act as a guarantee to buyers of the legitimacy of the seller. One example of the use of big data is the multiple sources of data (business, client) captured on the invoices and the speed of information processing, especially where government and business enterprise databases interface in real time. The system’s ability to verify business legitimacy and authorize transactions in real time saves time and resources. The system has also made information sharing easier between government departments and states because of the uniformity of the formats used. Using the data generated by this system provides the government with valuable information about the economy. Initially, businesses resisted this system because it appeared to pose an additional burden in the already heavily regulated business environment. However, the government’s efforts to provide strong leadership and technical support facilitated buy-in and investment in the necessary inputs to enable the system to operate efficiently. The system has increased voluntary compliance by companies in reporting and filing taxes because of its facilitation of audit action in case of red flags (Da Silva et al., 2013). Simply put, the system is set up under the assumption that, “by increasing the probability of detecting tax violations, taxpayers will declare a bigger portion of their income, or even their entire income” (Da Silva et al., 2013: 447). The keys to the success of this initiative include supportive efforts such as training tax officers and other system users, clear communication of the benefits of the system after completion of setup, and investment in the ICT platforms that enable the system to function at the state and federal levels. 27
UNITED STATES The United States has an advanced tax administration system for various sectors of the economy. Personal income tax evasion remains high, however, with 18–23 percent of total reportable income not properly reported to the Internal Revenue Service (IRS) (Cebula and Feige, 2012). U.S. citizens use their Social Security Number (SSN) as their tax identity. Because the SSN is a unique identifier and captures all the government-held data about a person, it is used to assess and collect taxes from all eligible individuals.
The IRS collects over US$2.4 trillion in taxes from nearly 250 million tax returns each year (Aggarwal, 2016). Citizens file taxes using online and manual systems, through private or public accountants, and through special software designed to guide and support the process. About 80 percent of all tax returns are received and processed electronically (Satran, 2013a). This showcases the large volume of digital data that is processed by the IRS. U.S. citizens can claim refunds based on allowable deductions granted in US tax laws and policies.
Regulatory and Administrative Framework The IRS is a bureau within the Department of the Treasury and is headed by a Commissioner.5 Its function and role are set forth in the Revenue Act of 1862. In response to emerging needs and trends, the IRS continually restructures and repositions itself in response to the dynamic tax and revenue environment through a formal process of hearings in the United States Congress. The Internal Revenue Service Restructuring and Reform Act of 1998 introduced provisions for the utilization of unique tax identification numbers to allow individual tax credit collection. It established divisions to serve specific regions and types of taxpayers, provided for the protection of citizens’ rights in tax administration, and created accountability mechanisms that allow the
public to submit queries by introducing mandatory requirements for RS staff to include contact information on any document submitted to individuals. The IRS processes and issues tax refunds, 80 percent of which are managed electronically. This opens up the system to fraud. This occurs primarily through the falsification of documents, identity theft, and the use of fraudulent identities. Media reports acknowledge that tax fraud is a growing challenge the IRS faces (Hunter, 2015). According to the U.S. Treasury Department, the number of identified fraudulent federal returns increased by 40 percent from 2011 to 2012, an increase of more than $4 billion in illegitimate payouts done mainly through identity theft (Newcombe, 2016).
Data Formatting and Operational Procedures According to Aggarwal (2016), “the IRS reportedly loses an estimated $300 billion each year in taxation error or cheating tactics.” To combat these losses, the IRS decided to use big data 5
28
analytics. Robo-audits process tax returns by checking them against data from third-party records. Collection and analysis of these data “allow the IRS to generate and track unique
IRS Organizational Chart: available at https://www.irs.gov/pub/irs-news/irs_org_chart_2012_.pdf.
attributes regarding financial behavior, aid tax enforcement, and combat noncompliance.” (Aggarwal, 2016: 279). Robo-audits are multiyear projects that cost US$3 billion and rely on third-party records of credit card and electronic data payment providers, social media, email, and other online activities for project execution (Satran, 2013b). Data are obtained from a complex collection of digital information collected from many sources. The IRS utilizes employer-filed data to compare and verify identities and reported incomes to ensure compliance. Employer-filed data provides a second point of reference due to its independent nature, making it easier to identify real and fictitious identities created by fraudsters utilizing stolen but legitimate identities. The IRS and state and security industry service providers6 have undertaken a collaborative effort to address identity theft and protect taxpayers. This was done through a collaborative agreement between software firms, payroll and tax financial product processors, and state tax administrators in an effort to recognize identity theft and refund fraud. The agreement includes, “identifying new steps to validate taxpayer and tax return information at the time of filing. The effort will increase information sharing between industry and governments. There will be standardized sharing of suspected identity fraud information and analytics from the tax industry to identify fraud schemes and locate indicators of fraud patterns.”7 According to the IRS, the partnership also embodies commitment
to train system users to navigate and utilize the system, assuage public concerns through information provision and advocacy, and provide information on security and privacy. The program compares tax return data with information from other state agencies, employers, and private firms to spot incorrect mailing addresses and stolen identities. Because so many returns are filed electronically, fraud-spotting systems look for suspicious Internet protocol (IP) addresses. For example, when tax auditors notice that similar IP addresses are submitting a series of returns for refunds which cannot be matched to any employer data, they are flagged for further scrutiny. To enhance the efficiency of roboaudit, the IRS was given the power by law to access credit card data to reference and validate identities and incomes. This was through a provision in the Housing Relief Act of 2009 (McNeil, 2010; Satran, 2013a), which provided a bigger spectrum of information to utilize during cross-referencing. The IRS, in an attempt to address tax fraud issues, has instituted measures to bolster its internal audit systems for optimizing inhouse technological and analytics departments. It began working closely with state tax administrators, cybersecurity experts, and independent tax and financial service providers to collectively address the issue. Public recognition of the importance of dealing with government revenue loss and the need to protect clients and taxpayers from this threat has bolstered this effort.
Electronic Tax Administration Advisory Committee (ETAAC), Federation of Tax Administrators (FTA) represented the states, council for Electronic Revenue Communication Advancement (CERCA) and the American Coalition for Taxpayer Rights (ACTR). 7 IRS Press Release Number IR-2015-87, June 2015. 6
29
CITIZEN SECURITY
T
he New York Police Department’s (NYPD) introduction of COMPSTAT in the 1990s offers insights into the value of introducing data analytics into policing under a new mayor and police commissioner in New York City. COMPSTAT is a performance management system that is used to reduce crime and achieve other citizen security goals, while emphasizing information sharing, responsibility, and accountability. This case study demonstrates how big data can have far-reaching implications within a police force. The introduction of real-time data analytics led to substantial personnel changes to reduce crime. The study highlights how important strong political will and credible commitment by leadership to integrate data are in realizing the benefits of big data over the long term. It also demonstrates how public–private partnerships (PPP) between the government and technology companies help ensure that data tools continue to evolve, despite resource constraints.
The Challenges of Combating Crime Criminal enterprises invest heavily in sophisticated technology and innovations, which makes them increasingly difficult to monitor or apprehend. Due to the budgetary and technological constraints
faced by police forces across the LAC region (Johnson, Forman, and Bliss, 2012), it is imperative to develop and implement highly cost-effective solutions to support crime reduction efforts.
The New York Police Department's COMPSTAT The case of New York City in the 1990s was selected to explore how big data can be leveraged by different police forces to anticipate and prevent crime. This study offers an analysis of the potential benefits of integrating data into day-to-day police activities for reducing crime. In the early 1990s, the crime rates in New York City were extremely high. Between 1985 and 1990, the number of homicides increased from 1,392 to 2,262, a 60 percent increase in only five years with rates hovering above 2,000 through to 1992 (White, 2012).
One of the tools used by the NYPD to curb high crime rates and increase citizen security has been COMPSTAT, a system that allows police agencies to adopt innovative technologies and problem-solving techniques while updating traditional police structures. The system functioned in the following way: every week, personnel from each of the NYPD’s 77 precincts, 9 police services, and 12 transit districts meet to present a wide range of crime-related data. To streamline the process, the police commissioners and executives receive all analytics information 31
in advance of the meetings. During the meeting, each precinct commander shows activities and accomplishments to the police commissioner, deputy commissioners, and other top executives. Precincts are allocated to police departments based on geographical zones throughout New York’s five boroughs. Alongside police management and officers, the analytics unit, which receives data from the police in the neighborhoods, provides a summary of the evolution of the amount of crime and its patterns, as well as a range of citywide and precinct-specific performance
indicators. High-ranking personnel from investigative units, such as vice and narcotics, attend COMPSTAT meetings to further ensure comprehensive explanations of each precinct’s main challenges. The strategic planning exercises during COMPSTAT meetings are then used to distribute street cops based on the crime analytics insights. This monitoring and evaluation system provides department leadership with the information needed to identify critical factors that lead to high crime rates and allocate resources to combat them.
Leadership, Vision, and Institutional Arrangements Atop New York City’s institutional structure sits the mayor, who is in charge of appointing and removing unelected officials from office, and hence monitoring their performance to ensure that the city’s public organizations can achieve their mandates. Part of the mayoral mandate is the ability to appoint the police commissioner, who is responsible for organizing the police force and creating their overall strategy for policing. This strategy includes responsibility for reducing crime and maintaining the reputation of the police force (City of New York, 2004). Crime was a key issue during the 1993 NYC mayoral election. Rudy Giuliani made crime reduction one of his key campaign messages. Once he was elected mayor, he appointed William Bratton as police commissioner. Their commitment to crime reduction included the introduction and utilization of data tools (Bureau of Justice Assistance and Police Executive Research Forum, 2013). In 1995, COMPSTAT was implemented with the purpose of supporting the NYPD in its mission of fighting
8
32
http://www.nyc.gov/html/nypd/html/administration/mission.shtml.
crime through deterrence and the relentless pursuit of criminals.8 Within the first year, Bratton replaced four of the five police chiefs with “aggressive risk takers” (Henry, 2006a: 105), and ensured that the resulting organizational structure would effectively administer resources and integrate data analytics down the chain of command. The NYPD’s managerial structure places Commissioner Bratton at the top of the police organizational hierarchy, followed by the deputy commissioners and the police chiefs directly below him. Within two weeks of setting up the new administration, precinct commanders were given “greater authority, discretion, and organizational power” (Henry, 2006a: 104) to effectively integrate and update the new data-driven resources and management systems. Through “weekly crime control and quality of life strategy meetings” inept or incompetent managers were identified and “more than two-thirds of the department’s 76 precinct commanders were replaced” within the first year (Henry, 2006a: 105).
The precinct commander's role is to organize the police officers throughout their allocated geographical zone, including defining the number and type of officers needed in their respective jurisdictions. The devolution of control from top management alongside the introduction of COMPSTAT led to the management paradigm shift that helped achieve the impressive reduction in crime rates. COMPSTAT functions were integrated into officers’ mainstream mandates, making them accountable to one another and management, irrespective of their administrative and jurisdictional duties. Further, Commissioner Bratton believed that it was possible for police to be proactive— that is, to anticipate and prevent crime before it occurred. This was contrary to the prevailing view at the time. Prior to the introduction of COMPSTAT, communication with senior management was conducted through memoranda
(O’Connell, 2001), and the “NYPD had no functional system in place to rapidly and accurately capture crime statistics or use them for strategic planning. “Crime statistics were often three to six months old by the time they were compiled and analyzed” (Henry 2006a: 105). The biggest shift in the organization was the devolution of power to precinct commanders and the fact that all levels of management were required to communicate in person on a weekly basis. Moreover, the units were responsible for submitting weekly crime reports to the centralized COMPSTAT Unit located in the Chief of Department’s Office (Kelling and Sousa, 2001). This helped create evidence-based performance accountability (Nagy and Podolny, 2008). COMPSTAT was an innovative, devolution-driven managerial structure backed up by data analytics.
COMPSTAT Data-Driven Management Structure COMPSTAT’s operational standards and procedures are based on the following main principles:9 ● Availability of timely and accurate intelligence ● Rapid response ● Implementing effective tactics ● Relentless follow-up The first two aspects require accurate crime analytics. In the absence of timely and accurate information, the NYPD would not be able to anticipate or respond promptly to crime. The high level of cooperation at every echelon of the NYPD’s management chain ensured the application of the principles listed above, which transformed the police force into “a seamless web” (Henry, 2006b). This facilitates
9
brainstorming and innovative problem solving and results in coherent strategies and plans across each individual, unit, or function (Henry, 2006a; Yuskel, 2014). The streamlined information network facilitated a reduction in response time to emerging crime trends. The third principle—implementing effective tactics for tackling and deterring crime— relies on the effective identification of crime patterns as well as their appropriate responses. This allows management to mobilize resources to target crime in a cost-effective way. The data identify which precincts need additional support and when to deploy more officers to a particular geographical area (Perry et al., 2013). Some datasets were georeferenced and thus enabled police to identify where criminal activity was most
http://nypdnews.com/2016/04/compstat-keeping-nyc-safe-an-inside-look/
33
likely to take place. This was facilitated by implemented community engagement campaigns, which informed adjustments to patrol routes. The fourth principle, optimization, embodies the willingness of senior managers to delegate power to lower-ranking officers through feedback loops and follow-up (Bratton, 1996). Optimization increased the ownership of tasks by all individuals in the police force. This strategy was based on the belief that police officers had the most knowledge about conditions in their communities and thus the
best vantage point to create context-specific solutions. The decentralization of management encouraged all staff to take ownership over recognizing local trends. This feeds into the final element: “relentless follow up” (Yuskel, 2014). 10 Autonomy allowed senior management to hold lower-ranking officials to account via clear performance indicators augmented by data. In some cases, this led to the removal of precinct commanders who were unable to distribute and manage their personnel and resources adequately.
Technical Considerations Predictive Policing Predictive policing is the application of quantitative analysis techniques to identify likely targets for police intervention and prevent crime through statistical predictions (Perry et al., 2013). This model, grounded in criminology, suggests that criminals and victims are likely to follow a common pattern. Overlaps in patterns
indicate the likelihood of crime. If criminals are successful in carrying out crimes, there is a high probability they will attempt to replicate the circumstances that previously made them successful (Perry et al., 2013). Additionally, the growing body of curated data can be used to rapidly investigate suspects and victims.
Data Analysis Overview COMPSTAT’s analytical insights were derived from existing datasets at the department’s disposal. The data used in COMPSTAT were gathered from regular police operations. Datasets include both (i) structured data, such as gender, age, and race, and (ii) unstructured data such as witness statements and criminal records. Key elements to reaping benefits from the data are crime maps. GIS tools create crime maps by combining crime and general
data and existing intervention initiatives. Prior to the introduction of digital data visualization tools, crime maps were created manually and contained fewer datasets. Further, data analysts can identify hot spots through maps, which display individual crimes and the crime density of a particular location. The hot spot maps, made available to the public, show levels of heat in an area to demonstrate crime density (see Map 1).11
However, it should be noted that this method has been shown to have negative externalities in combating crime, most notably racial profiling of African-Americans. 11 https://maps.nyc.gov/crime/. 10
34
Map 1. Sample Hot Spot Maps
Source: Eck et al. (2005).
Further Developments The NYPD's use of data has greatly evolved since the introduction of COMPSTAT. The steps taken in the 1990s laid the foundation for further data innovations, including the creation of a data warehouse. This data hub allows the NYPD to centralize its data collection and storage operations (D'Amico, 2006). To improve data analysis operations, the NYPD set up the Real Time Crime Center (RTCC) with the assistance of IBM. Today, data scientists and engineers conduct crime analysis alongside officers. The cost of setting up the center was US$11 million (D'Amico, 2006). The RTCC combines NYPD data with other public datasets, including Internet searches. Information can be shared easily with other crime-fighting agencies, such as the Department of
Homeland Security. The centralization of data collection, storage, and analysis allowed the NYPD to achieve economies of scale and thus ensure the cost-effectiveness of the COMPSTAT system. Another case of public–private collaboration was the creation of the Domain Awareness System (DAS), developed by Microsoft in conjunction with the NYPD. The DAS draws data from a wide range of government agencies (Joh, 2012). DAS provides street officers with specific information about their current location via mobile devices. This software uses information collected from archived police data, privately operated CCTV cameras, and license plate readers (Dahl, 2012) to offer a holistic snapshot of their surroundings.
35
POLICY GUIDE
T
his section provides a list of the main insights that emerge from the case studies. The recommendations are disaggregated along multiple dimensions to give policymakers a list of the challenges they must address when implementing big data solutions in the public sector. The first set of recommendations relates to institutional arrangements—the host of formal institutions and resultant factors that structure and frame the use of big data in the operations of public organizations. The policy guide starts off with the leadership, vision, and policy plans, which is the foundation for introducing data analytics into existing processes. This is followed by governance structures, organizational structure, and regulatory frameworks. Subsequently, the technical considerations are broken down by data sharing and privacy and protection, data storage and collection, data analysis and interpretation tools, and technical equipment for data processing.
Institutional Arrangements Leadership, Vision, and Policy Plans The cases indicate that commitment from leadership is the cornerstone of successful data implementation. Leaders must first establish a clear, comprehensive vision for the use of data that falls within a larger development plan and includes accessible procedures and incentive alignment for creators, analyzers, and users of data. ● Smart Cities: Mayor Boris Johnson began by identifying key challenges and opportunities (population growth and the ensuing strain on mass transit, London’s position as a leader in technology). He then created clear policy papers with a long-term horizon and
clear objectives. The creation of special panels of experts, such as the Smart London Board in this case, can also be an effective way of ensuring that the vision becomes reality at a relatively low cost, as they provide monitoring and timely recommendations. ● Taxation: In all of the cases, governments identified the tax challenge and led the effort to address it. The respective tax authorities were key in informing and leading the effort of big data leveraging, especially in linking monitoring and auditing functions to transaction and reporting processes of tax subjects. Through the use of legal instruments (circulars, laws, and policy guidelines), the tax authorities were able to utilize 37
government structures and mandates to create a conducive environment for database integration, cross-referencing, and collaboration with a wide range of stakeholders, an effort that enriched the electronic information available. Governments also played a leading role in correlating big data integration with wider policy agendas and Internet infrastructure, as in the case of Brazil. This informed system design, training, and support to facilitate compliance. ● Citizen Security: The leadership of the recently elected mayor and the newly appointed police commissioner aimed to not only reduce crime but
also prevent it. Their strategic vision was formulated through the introduction of COMPSTAT, a management and data analytics tool for increasing police effectiveness. At weekly meetings, all precinct commanders and their staff were required to present their crime data to management for analysis, strategic planning, and defense of resource allocation. The data provided insights on crime and was also used to monitor performance, measured by a reduction in crime. Fully implementing COMPSTAT required massive personnel changes, demonstrating the political will and leadership commitment.
Governance Structures Governance structures allow a data vision to evolve into functional application. Public agencies must be flexible and must adapt to changing needs and dynamic opportunities. The most important shared characteristic in these cases is the level of inter-institutional collaboration and information exchange. As the case studies showed, this type of collaboration is key to facilitating data sharing and the incorporation of data-driven insights into public agencies’ policy process. Removing silos and creating data environments that allow many diverse and remote sectors of government to access critical, realtime information often lead to big data initiatives in the public sector. Governance structures should also be designed to facilitate collaboration with the private sector and academia, since these might be good sources of knowledge, technical capacities, and data. Having broad internal and public
feedback that considers preferences and institutional or budgetary constraints can strengthen long-term expectations, accountability, and ownership and limits potential disruptions caused by political turnover (Corduneanu-Huci, Hamilton, and Ferrer, 2012). Incentivizing the private sector to work closely with university and research organizations to tackle complex public problems is a promising way to align big data projects with financing for public interest objectives.12 ● Smart Cities: The push to encourage the exchange of information between Transport for London’s many sub-bodies is a clear indication of the desire on the part of London’s senior officials to establish a leaner but more effective governance structure. At the municipal level, Smart London’s emphasis on consulting with stakeholders (citizens, boroughs, public firms) is playing a key
An example of this is the D4D challenge by the telecommunications company, Orange. Teams were invited to use big data gathered from mobile phones to create solutions for variety of policy issues, such as health and transportation (Tatevossian and Yuklea, 2014). Most of the teams that submitted solutions were from academia.
12
38
role in ensuring that London evolves in the direction that suits the needs and preferences of as many people as possible, increasing the potential benefits and longevity. ● Taxation: Governments faced with revenue collection optimization challenges opted to emphasize and practice multi-institutional collaborations that facilitated information exchange. Mechanisms to make targeted taxpayers aware of new standards and
guidelines were utilized to ensure buyin and compliance. ● Citizen Security: Decentralization of managerial authority was a key component of the project, encouraging all staff to take ownership over recognizing local trends.This was carried out with the intention of enabling those with years of service, experience, and familiarity with their communities to manage the complex operational problems under their charge.
Organizational Structure The research conducted identified many disrupting organizational factors as a result of the introduction of data. These range from from highly skilled data scientists with competitive salaries working alongside public servants to substantial management overhauls informed by data evidence. In all cases, integrating data creates change. However obvious that may sound, the full breadth of such changes may not always be predictable from the outset. Commitment by leadership to the data vision and articulating its complexities and potential externalities can help ameliorate any tensions that evolve without undermining the big data project. ● Smart Cities: The decision of Transport for London (TfL) to have multiple analytics teams is an effective way of ensuring that they can achieve their two main goals: providing their customers with a high level of service, and upgrading and maintaining their transportation network. Even though TfL uses big data to achieve both of these objectives, its Customer Experience Team and Planning Team are composed of individuals with different skill sets, and the
insights they obtain from their analyses is destined for very different audiences. Creating multiple analytics teams that are geared toward specific goals is an effective way of increasing the quality of service provided and ensuring that all of a public body’s main functions can be achieved simultaneously. ● Taxation: In all cases, a state bureau or agency was in charge of harnessing big data for taxation. This points to the need for a core entity to provide managerial support and oversee implementation. Diverse personnel were recruited to execute technical tasks, ensure compliance with national regimes, and propose reforms where necessary. A unique factor of the United States and Brazil cases was the close collaboration of different units within the same agency (Revenue) or wider public sector (Treasury, Trade, etc.). China’s case shows an additional mandate to an existing state administrative tax entity that issued guidelines and support to provinces and taxpayers. 39
Additionally, in the case of Brazil, a private company, Invoiceware, which operates the Global Compliance Platform, provides support and guidance for navigating Brazil’s system to strengthen skills and compliance. ● Citizen Security: Leaders overhauled management and the organizational structure of the police units under them. Four out of five police chiefs and twothirds of precinct commanders were replaced in the first year. This change in management was further perceived as a credible commitment to removing the
entrenched culture based on patronage and favoritism (Nagy and Podolny, 2008), as data on crime reduction could verify performance. Additionally, the Transit and Housing Police Departments were merged into the NYPD in 1995 (Henry 2006a: 104) to streamline security accountability. The NYPD added data analysts to the department to work alongside street cops to aggregate and interpret realtime data. This allowed information and ideas to flow across skill sets, functional domains, and geographic areas.
Regulatory Frameworks Regulation is integral to proper data management and usage. It requires a delicate balance that considers protection from data misuse while not stifling important sharing and innovation. Governments may be required to create new rules in unfamiliar policy space that cover ethical usage and appropriate sanctioning mechanisms for non-compliance. The existence of open data policies and regulations is a key condition for the exploitation of big data for policy objectives. In the absence of open data regulations, mechanisms for data sharing among public institutions can also facilitate its effective use. This is particularly relevant for sensitive data that cannot be easily opened. In addition, LAC countries should discuss regulations on access to data generated by public companies and private concessionnaires as part of their open data and PPP agendas. ● Smart Cities: London officials recognized the need for an open data policy framework to ensure that London’s data ecosystem is conducive to innovation 40
and allows both private and public firms, and the general population, to take advantage of the enormous amount of data being collected and analyzed. This is a quintessential step in ensuring the longevity and success of the Smart London Plan, as smart city initiatives involve the collaboration of many actors. As investments in physical and human capital can be done quickly and big data systems can be established rapidly, it is crucial to ensure that the appropriate legal framework is enacted to ensure that the growth of the technological system is not delayed by regulatory issues. ● Taxation: Through statutory and administrative instruments, reporting, recording and tax filing standards were put in place in the United States. State Administration Tax Orders and Acts of Congress are some of the tools utilized to provide regulatory guidance and to enable compliance. Brazil relied upon provisions in the federal constitution and
an existing ICT plan to roll out electronic invoicing platforms across states, a key enabler of the SPED system. China’s State Administration of Taxation Order is an example of how sanctions, including fines and jail time, are used to dissuade would-be tax evaders. Sanctions, including fines and jail time around failure to use or attempts at manipulating the systems may help reduce tax evasion. ● Citizen Security: There was no significant change in the regulatory framework for data usage by the NYPD because it is governed by Federal law, which ideally limits the abuse of data regardless of
jurisdiction. However, there are lingering concerns about misuse of data by government agencies. The New York District Court ordered the NYPD to delete information from its online records, as it found that they were improperly investigating Muslims in relation to terror investigations (Kredo, 2016). Acknowledging the many ways in which data can be used unlawfully requires appropriate regulation and may also necessitate an independent adjudicator to rule on privacy issues. It is recommended that security ministries implementing the use of big data educate officers regarding ethical standards of use.
Technical Considerations Data Sharing and Privacy and Protection Sharing Supplying common, structured repositories for government data across disparate agencies and service areas enables more complete and accurate information sharing and learning. Removing silos and creating data environments that allow diverse and remote sectors of government to access critical, real-time information. Big data’s integration into public sector decision making requires at least three infrastructure investments “(1) a platform for organizing, storing, and making data accessible; 2) computing technology and power that can process large-scale datasets; and 3) data formats that are structured and usable” (Bertot et al., 2014: 6). This is particularly true for human service agencies, which can best serve citizens by utilizing all public information on their behalf. Due to the vast volume of data being produced, shared, and stored, formal standards regarding format and readability are essential
for reaping the benefits. Data may be stored in a number of formats, for example, CSV, XML, Excel, and others, depending on the tool creating or housing the data. It is also useful to consider the types of data that will be open to the public versus those used by the public and private sectors because of their capacity to combine and store large quantities of data. Standards on the creation and dissemination of data are essential to ensuring the accuracy of evidence and insights: data must be open and machine-readable to be easily and rapidly processed. The long-term potential of big data requires the ability to combine massive amounts of data for algorithmic analysis. The most expensive and riskiest aspect of upgrading to big data systems is its migration from existing data warehouses to the cloud, where larger volumes of data can be stored. The cloud can 41
support hundreds of billions of data and does not require investment in assets such as servers, their cooling, or maintenance. Establishing a secure repository in the cloud for government data initiatives represents an opportunity for ‘leapfrogging’ for countries in which data warehouses are not practical. Privacy and Protection Decisions regarding data privacy and protection vary by community and perceived values and potential for misuse. As the name suggests, big data incorporates all types of information indiscriminately. Portions of the data being produced are personal and, even if anonymized, have the potential to become identifiable. Privacy concerns exist for individuals, firms, and government, thus requiring a comprehensive framework for protection. It is important to engage the public and other stakeholders to ensure that the debate surrounding data privacy and protection illuminates public concerns while limiting the likelihood of overly restrictive regulations (Mcdonnell, 2016). Although there is no single vision regarding data privacy, many countries are in the process of determining appropriate standards. In the United States, for example, memoranda are used to update security protocols for data release by federal agencies, providing adequate controls to ensure that information is “resistant to tampering, to preserve accuracy, to maintain confidentiality as necessary, and to ensure that the information or service is available as intended by the Agency and as expected by users” (Bertot, 2014). Protection and organization of government data require an agreed upon classification and taxonomy system with proper security protocols in place for confidential information (Chakrabarti et al., 1998). The vast majority of government data utilized in the case studies and 42
many other examples reviewed by the authors did not include high-risk data sets that pose a threat to citizen security. While it is advisable to build out regulatory protections and standards, this should not be done at the expense of capitalizing on valuable data access and mining opportunities that can lead to collaborative solutions with firms and civil society. The case studies highlight that personal data, such as tax documents, are not anonymized for internal purposes, as authorities need to know whom they are investigating. Tax authorities such as the Internal Revenue Service face numerous threats from hackers and must continue to invest in tougher cybersecurity systems (IRS, 2016). At the same time, individuals look to the government to help protect their personal data from misuse. The European Union is currently reviewing new legislation on data protection. Data protection rules are typically enforced via a regulator or privacy authority. Their mandates, independence from government, and authority vary by country. The range of authority may include conducting investigations, addressing complaints, and issuing fines. Technology itself can have a role in limiting mission creep. Specific technological design considerations limit data collection to restrict illegal or unauthorized data processing, mining, and access (Privacy International, 2016). Ultimately, the government, along with consumer protection advocates and civil society as a whole, must establish a privacy framework that promotes data sharing for purposes of greater well-being and access to public goods and services while setting the boundaries against misuse of personal and sensitive information. By engaging different stakeholders in this debate, the government has the opportunity to raise and address concerns and educate the public on the value of data sharing.
Data Storage and Collection Effective data storage and collection require appropriate technologies for gathering and storing data for many current and potential future uses. Governments have vast quantities of data from various departments and agencies, that once accessible to public servants, can improve service delivery. Collaboration with the private sector to create the right systems and tools is common and has cost saving potential. ● Smart Cities: TfL continues to integrate its multiple data streams and share its wealth of information with other public bodies. It opened a strategic data center in 2009 and plans to open another one soon. As its data is currently stored in 30 different centers, centralizing its data collection operations will allow it to increase economies of scale and efficiency by investing in cutting-edge information systems in fewer locations and facilitate the process of sharing information with other organizations that use the same datacenter. Creating these highly efficient and centralized data storage facilities is an essential component of the Smart London Plan. It is a cost-effective way to provide multiple public bodies with the most up-to-date technologies that allow them to benefit from each other’s data. ● Taxation: Each tax case demonstrated the need for a backup and server
security system to prevent platforms in which multiple users interact from being compromised To optimize the benefits of big data, governments need to make certain requirements compulsory. These electronic systems require investment in the internet and other ICT infrastructure to provide interaction of this kind. The need for end-to-end communication between government and business enterprises calls for setup of a mutually beneficial and collaborative design to facilitate smooth use. As has been shown, big data can increase the efficiency of tax administration by supporting the audit, monitoring, and referencing functions. However, all systems must be tailored to local challenges, facilities, capabilities, and visions. Phased implementation may be required to correct errors, eliminate redundancies, and strengthen capacity. ● Citizen Security: The NYPD collaborated with IBM to develop the Real-Time Crime Center (RTCC), a data warehouse capable of storing vast amounts of data from multiple precincts and agencies. This PPP allowed the NYPD to incorporate an innovative, tailored solution despite their operational and human capital constraints.
Data Analysis and Interpretation Tools Data analysis and interpretation tools are highly context specific and depend on the level of sophistication required of the analytic insights. Assessing current capabilities
and leveraging existing resources and human capital is necessary for developing a realistic budget and ensuring long-term funding for data investments.
43
● Smart Cities: TfL has continuously invested in IT equipment to provide its staff with the tools they need to complement the powerful big data systems that collect and analyze data. The recent adoption of SAP’s HANA in-memory analytics software to centralize the entire data collection and analytics process showcases the quality of software that is now available and the potential of PPPs. The London Land-Use and Transport Interaction model and the London Transport Studies model, the ‘workhorses’ of TfL’s Planning Unit, demonstrate the value of creating specialized models that can process large amounts of data for various purposes. The integration of multiple data streams through the use of cutting-edge software can therefore allow one organization to fully utilize its data to achieve widely different goals, increasing the cost-effectiveness of the entire system and the benefits that it yields.
● Taxation: Big data leveraging systems need to be set within the standards of national infrastructure and protocols. This facilitates smoother cross-referencing, file transfer, and analysis. This applies to ICT equipment, Internet standards, and electronic document formats. Countries that do not have sufficient domestic capabilities to construct such databases can use international, standardized, ISO-approved invoice formats. Another option is allowing private vendors that customize the vision for users, as in the case of Invoiceware in Brazil. ● Citizen Security: In collaboration with Microsoft, the NYPD developed the Domain Awareness System (DAS), which draws data from a wide range of government agencies, current and archived police data, privately operated CCTV cameras, and license plate readers, which are sent to officers’ mobile devices while they are on patrol.
Technical Equipment for Data Processing Choosing the appropriate technical equipment for data processing must take into account the internal and external participants along the chain of creators and users of data. These systems can be comparatively complex and require highly trained staff to use them properly. Much of the research suggests that the data scientists, engineers, and others brought in to use this equipment are not centralized teams. Rather, they are embedded within the particular policy space or department for close collaboration with intended users. ● Smart Cities: To properly use the powerful information systems at TfL’s disposal, it created two teams of highly 44
skilled and specialized individuals: the Customer Experience Unit, which work to provide TfL’s customers with personalized information to optimize their experience, and the Planning Unit, which uses predictive analytics models to identify upgrades to the transportation infrastructure. Although the exact combination of these two teams is not precisely known, they both have a number of data scientists, software engineers, urban planning experts, and customer experience personnel depending on their exact function. These analytics teams are fundamental to the overall system operation.
● Mainstream Equipment: TfL’s recent information system upgrades have prompted senior management to provide IT staff with additional training so that the majority of its IT operations remain in-house, reducing costs over the long term. The learning and development team ensures that they are staying technologically literate and can understand new challenges and opportunities generated by the new data systems. By providing all relevant staff with training, TfL ensures that its employees will become an integral part of its new data-driven structure and maximize the potential benefits that arise from using big data. It also hedges against the risk that employees may feel that analytical tools will replace the need for them. ● Taxation: Each country reviewed released standards and guidelines for formatting, procedures, and processing
rules. Sub-contracted training for public servants facilitated the introduction and rollout of the new systems. In addition to tax administration staff, Brazil provided training on SPED for business owners. The United States partnered with consumer representatives, vendors, and other stakeholders to inform and build capacity in the areas of data security, identity theft, and privacy to address tax fraud issues comprehensively. ● Citizen Security: Initially, the data analytics skills required under the original COMPSTAT system were less complicated than the current DAS or RTCC programs. Ongoing training is required for analytics staff, as systems such as Microsoft’s DAS require more sophisticated skill sets for operability. Officers utilizing DAS require mobile devices that enable them to send and receive information from the central command.
45
REFERENCES
Aggarwal, A. 2016. Managing Big Data Integration in the Public Sector. Piscataway, NJ: IGI Global. Berst, J. 2015. Smart Cities Readiness Guide. Redmond, WA: Smart Cities Council. Bertot, J. C. et al. 2014. “Big Data, Open Government and e-Government: Issues, Policies and Recommendations.” Information Polity 19(1,2): 5–16. Bureau of Justice Assistance and Police Executive Research Forum. 2013. “COMPSTAT: Its Origins, Evolution, and Future in Law Enforcement Agencies.” Washington, DC: Police Executive Research Forum. Card, J. 2015. “Open Data is at the Centre of London’s Transition into a Smart City.” Retrieved March 18, 2016, from http://www.theguardian.com/media-network/2015/aug/03/open-data-londonsmart-city-privacy. Cebula, R. and J. Feige. 2012. “America’s Unreported Economy: Measuring the Size, Growth and Determinants of Income Tax Evasion in the U.S.” Crime, Law and Social Change 57(3): 265–85. Chakrabarti, S., B. Dom, R. Aggrawal, and P. Raghavan. 1998. “Scalable Feature Selection, Classification and Signature Generation for Organizing Large Text Databases into Hierarchical Topic Taxonomies.” The VLDB Journal 7(3): 163–78. City of New York. 2004. New York City Charter. New York, NY: City of New York. Corbacho, A., V. Fretes Cibils, and E. Lora (eds.). 2013. More than Revenue: Taxation as a Development Tool. (IDB Development in the Americas). London, United Kingdom: Palgrave Macmillan Publishers. Corduneanu-Huci, C., A. Hamilton, and I. M. Ferrer. 2012. Understanding Policy Change: How to Apply Political Economy Concepts in Practice. Washington, DC: World Bank. D’Amico J. 2006. “Stopping Crime in Real Time.” Retrieved March 1, 2016, from http://www.policechiefmagazine.org/magazine/index.cfm?fuseaction=search_rs&keyword=Stopping+Crime+in+Real +Time&x=8&y=5. Da Silva, A., G. Passos, M. Gallo, and M. Peters. 2013. “SPED: Public Digital Bookkeeping System: Influence on the Economic-financial Results declared by Companies/SPED E Sistema Público de Escrituração Digital: Influência nos resultados econômico-financeiros declarados pelas empresas.” Revista Brasileira De Gestão De Negócios 15(48): 445–61. 47
Dahl, E. 2014. “Local Approaches to Counterterrorism: The New York Police Department Model.” Journal of Policing, Intelligence and Counter Terrorism 9(2): 81–97. Available at http://www.tandfonline.com/doi/abs/10.1080/18335330.2014.940815. Eck, J., S. Chainey, J. Cameron, M. Leitner, and R. Wilson. 2005. “Mapping Crime: Understanding Hot Spots.” Washington, DC: U.S. Department of Justice Office of Justice Programs. Available at http://discovery.ucl.ac.uk/11291/1/11291.pdf. Edicomgroup. 2016. “Brazilian e-Invoicing | NF-e.” Available at: http://www.edicomgroup.com/en_US/ solutions/einvoicing/LATAM_einvoicing/brazilian_einvoicing.html Feldman, O. 2015. Big Data and Big Models for a Better Customer Experience. London, United Kingdom: Transport for London. GLA (Greater London Authority). Undated. Open Data Charter. London, United Kingdom: GLA. Available at https://londondatastore-upload.s3.amazonaws.com/OPEN-DATA-CHARTER.pdf Henry, V. E. 2006a. “Compstat Management in the NYPD: Reducing Crime and Improving Quality of Life in New York City.” Resource Material Series No. 68: 100–16. _____. 2006b. “Managing Crime and Quality of Life Using Compstat: Specific Issues in Implementation and Practice.” Resource Material 68: 117–32. Hill, D. 2015. “London’s Booming: How the City’s Population Surged Past Pre-war Peak.” Retrieved March 18, 2016, from http://www.theguardian.com/cities/2015/jan/09/london-booming-population-growth-success-challenge. Hunter, M. 2015. Tax-refund Fraud to hit $21 Billion, and there’s Little the IRS Can Do.”
Retrieved April 6, 2016, from http://www.cnbc.com/2015/02/11/tax-refund-fraud-to-hit-21-billion-and-theres-little-the-irs-can-do.html.
IBM. Undated. The Four Vs of Big Data. Available at: http://www.ibmbigdatahub.com/infographic/fourvs-big-data. IMF (International Monetary Fund). 2011. “Supporting the Development of More Effective Tax Systems. A Report to the G-20 Working Group by the IMF, OECD, UN, and World Bank.” Available at https://www.imf.org/external/np/g20/pdf/110311.pdf. IRS (Internal Revenue Service). 2015. “IRS, Industry, States Take New Steps Together to Fight Identity Theft, Protect Taxpayers.” IR-2015-87. June 11, 2015. Washington, DC: IRS. Available at https://www.irs.gov/uac/newsroom/irs-and-industry-and-states-take-new-steps-together-tofight-identity-theft-and-protect-taxpayers. _____. 2016. “IRS Statement on E-filing PIN.” Retrieved February 9, 2016, from https://www.irs.gov/ uac/Newsroom/IRS-Statement-on-Efiling-PIN.
48
Joh, E. 2014. “Policing by Numbers: Big Data and the Fourth Amendment.” Washington Law Review 89(35). Available at SSRN: http://ssrn.com/abstract=2403028 Kelling, G. L. and W. H. Sousa. 2001. Do Police Matter? An Analysis of the Impact of New York City’s Police Reforms. New York, NY: Manhattan Institute Center for Civic Innovation. Kredo, A. 2016. “Court Requires NYPD to Purge Docs on Terrorists Inside U.S.” Retrieved August 28, 2016, from http://freebeacon.com/national-security/court-requires-nypd-purge-docs-terroristsinside-us/. Mayor of London. Undated. London Datastore. London, UK: Mayor of London. Available at https://data. london.gov.uk. _____. 2013. “London Infrastructure Plan 2050: A Consultation.” London, UK: Mayor of London. Available at https://www.london.gov.uk/what-we-do/business-and-economy/better-Infrastructure/ london-infrastructure-plan-2050. _____. 2014. Smart London Plan. London, UK: Mayor of London. Available at http://www.london.gov. uk/sites/default/files/smart_london_plan.pdf _____. 2015. “London Infrastructure Plan 2050 Update.” London, UK: Mayor of London. Available at https://www.london.gov.uk/what-we-do/business-and-economy/better-Infrastructure/londoninfrastructure-plan-2050. McNeil, T. 2010. “Recovery Act of 2009: Public Housing Capital Fund: Obligations and Number of Jobs by ZIP Code.” Cityscape 12(2): 145–47. Nagy A. and J. Podolny. 2008. “William Bratton and the NYPD.” Yale Case 07–015. New Haven, CT: Yale University. Newcombe, T. 2016. “States Use Big Data To Nab Tax Frauders.” Available at http://www.governing. com/columns/tech-talk/gov-states-big-data-tax-fraud.html. O’Connell, P. E. 2001. “Using Performance for Accountability: The New York City Police Department.” In M. A. Abramson and J. M. Kamensky (eds.), Managing for Results 2002. PricewaterhouseCoopers Endowment Series on the Business of Government. Lanham, MD: Rowman & Littlefield Publishers. Paranagua, P. A. 2012. “Latin America Struggles to Cope with Record Urban Growth.” Retrieved March 20, 2016, from http://www.theguardian.com/world/2012/sep/11/latin-america-urbanisation-citygrowth. Perry, W., et al. 2013. “Predictive Policing, The Role of Crime in Law Enforcement Operations.” Santa Monica, CA: RAND Corporation. POST (Parliamentary Office of Science and Technology). 2014. Big and Open Data in Transport. London, UK: Houses of Parliament. 49
Privacy International. 2016. Data Protection. Available at https://www.privacyinternational.org/node/44. Qing, L. Y. 2013. “China Rolls out Tighter Rules for e-Invoicing.” Retrieved April 6, 2016, from http:// www.zdnet.com/article/china-rolls-out-tighter-rules-for-e-invoicing/. Rode, P., G. Floater, N. Thomopoulos, J. Docherty, P. Schwinger, A. Mahendra, and W. Fang. 2014. “Accessibility in Cities: Transport and Urban Form.” NCE Cities Paper 03. LSE Cities. London, UK: London School of Economics and Political Science. Rossi, B. 2015. “How TfL will Use Data about You to Keep London Moving as its Population Soars.” Information Age. Retrieved March 18, 2016, from http://www.information-age.com/it-management/strategy-and-innovation/123459878/how-tfl-will-use-data-about-you-keep-london-moving-its-population-soars. SAS (Satistical Analysis System Institute). 2016. Big Data: What it is and Why it Matters. Retrieved March 10, 2016, from http://www.sas.com/en_us/insights/big-data/what-is-big-data.html. Satran, R. 2013a. “Next Target of IRS Robo-Audits: Small Business.” U.S. News & World Report. Available at http://money.usnews.com/money/personal-finance/articles/2013/05/09/next-target-ofirs-robo-audits-small-business. _____. (2013b). “Will the Data Boom Pay Dividends?” Yahoo News. Available at https://www.yahoo. com/news/data-boom-pay-dividends-153416832.html?ref=gs Shuanglin, L. 2008. “China’s Value-added Tax Reform, Capital Accumulation, and Welfare Implications.” China Economic Review 19(2): 197–214. Tatevossian, A. and L. Yuklea. 2014. “The Second “Data for Development” (D4D) Challenge in Africa.” New York, NY: United Nations Global Pulse. Available at http://www.unglobalpulse.org/Orangedata-for-development-Senegal. TfL (Transport for London). 2014. “London Land-Use and Transport Interaction Model.” London, United Kingdom: Transport for London. Available at http://content.tfl.gov.uk/the-london-land-use-andtransport-interaction-model.pdf. _____. Undated. “How We are Governed.” Available at https://tfl.gov.uk/corporate/about-tfl/how-wework/how-we-are-governed. Thebrazilbusinesscom. 2016. “The Brazil Business.” Retrieved April 6, 2016, from http://thebrazilbusiness.com/article/all-about-sped. UN-Habitat. 2012. State of Latin American and Caribbean Cities Report. Nairobi, Kenya: UN-Habitat. Available at http://unhabitat.org/?mbt_book=state-of-latin-american-and-caribbean-cities-2. WEF (World Economic Forum). 2012. Big Data, Big Impact: New Possibilities for International Development. Geneva, Switzerland: WEF. Available at http://www3.weforum.org/docs/WEF_TC_ MFS_BigDataBigImpact_Briefing_2012.pdf. 50
White, M. D. 2012. ‘The New York City Police Department, its Crime Control Strategies and Organizational Changes, 1970-2009.” Justice Quarterly 31(1): 74–95. Winn, J. and A. Zhang. 2010. “China’s Golden Tax Project: A Technological Strategy for Reducing VAT Fraud.” Peking University Journal of Legal Studies 4: 1–33. World Bank. 2014. Doing Business 2015: Going Beyond Efficiency. Washington, DC: World Bank. Available at http://www.doingbusiness.org/~/media/GIAWB/Doing%20Business/Documents/ Annual-Reports/English/DB15-Chapters/DB15-Report-Overview.pdf. _____. 2016. World Development Report 2016: Digital Dividends Overview. DC: World Bank. Available at http://documents.worldbank.org/curated/en/961621467994698644/pdf/102724-WDRWDR2016Overview-ENGLISH-WebResBox-394840B-OUO-9.pdf. Wu, R. 2013. An Overview of E-invoicing in China and the Factors Affecting Individual’s Intention to B2C E-invoicing Adoption. Espoo, Finland: Aalto University School of Business. Available at: http://epub.lib.aalto.fi/en/ethesis/pdf/13389/hse_ethesis_13389.pdf. Xing, W. and J. Whalley. 2014. “The Golden Tax Project, Value-added Tax Statistics, and the Analysis of Internal Trade in China.” China Economic Review 30: 448–58. Yu, K. 2003. “On the Problems of Golden Tax Project.” International Taxation 3: 65–7. Yuskel, Y. 2014. “Implementation of Compstat in Police Organizations: The Case of Newark Police Department.” Journal of International Social Research 7(35): 774–96.
51
Interviews
52
Title
Organization
Date of Interview
Professor (Wireless Communications) Director (Telecommunications)
King’s College London
January 16, 2016
Director, LSE Cities
The London School of Economics and Political Science
January 28, 2016
MSc Candidate, Smart Cities Policy – Think Tank
The London School of Economics and Political Science
February 8, 2016
LSE Fellow, Public Management and Governance
The London School of Economics and Political Science
February 8, 2016
Associate Professor, International Development and Research Associate, Institute for Fiscal Studies
The London School of Economics and Political Science
January 2016
Digital Analytics Consultant
Deloitte
February 4, 2016
Chief Executive Office
SolidPartner
January 22, 2016
Hadoop Expert
U.S. National Archives and Records Administration
March 14, 2016
Engagement Director
Amplero
March 3, 2016