Preprints (www.preprints.org) | NOT PEER-REVIEWED | Posted: 17 January 2017
doi:10.20944/preprints201701.0077.v1
Article
Potential and Limits of Retrieving Conifer Leaf Area Index Using Smartphone Camera Sensors Yonghua Qu *, Jian Wang, Jinling Song and Jindi Wang State Key Laboratory of Remote Sensing Science, Beijing Key Laboratory for Remote Sensing of Environment and Digital Cities, Department of Geography Science, Beijing Normal University, Beijing 100875, China;
[email protected] (J.S.);
[email protected] (J.W.) * Correspondence:
[email protected]; Tel.: +86-10-58802041
Abstract: Plant leaf area index (LAI) is a key characteristic affecting field canopy microclimate. In addition to traditional professional measuring instruments, smartphone camera sensors have been used to measure plant LAI. However, when smartphone methods were used to measure conifer forest LAI, very different performances were obtained depending on whether the smartphone was held at the zenith angle or at a 57.5° angle. To validate further the potential of smartphone sensors for measuring conifer LAI and to find the limits of this method, this paper reports the results of a comparison of two smartphone methods with an LAI-2000 instrument. It is shown that both methods can be used to reveal the conifer leaf-growing trajectory. However, the method with the phone oriented vertically upwards always produced better consistency in magnitude with LAI2000. The bias of the LAI between the smartphone method and the LAI-2000 instrument was explained with regard to four aspects that can affect LAI: gap fraction, leaf projection ratio, sensor field of view (FOV), and viewing zenith angle (VZA). It was concluded that large FOV and large VZA cause the 57.5° method to overestimate the gap fraction and hence underestimate conifer LAI, especially when tree height is greater than 2.0 m. For the vertically upward method, the bias caused by the overestimated gap fraction is compensated for by an underestimated leaf projection ratio. Keywords: leaf area index; smartphone camera sensor; conifer forest; canopy gap fraction
1
Introduction
Plant leaf area index (LAI), defined as a single leaf area per unit ground area[1], is an essential parameter for controlling mass and energy exchanges between the plant and the environment. The most reliable method for LAI measurement is destructive sampling, but this is time-consuming and suited only to low-growing plants such as crops and grass. For taller plants such as conifer forests, it is difficult to destroy plants to measure their leaf area. Compared with the manual destructive sampling method, optical sensors have proved to be a more efficient method of indirect measurement since the 1980s[2,3]. The optical sensor-based indirect LAI measurement, which measures plant transmittance directly, and plant LAI were estimated using a canopy light attenuation model. In this context, an imaging or non-imaging sensor may be used depending on how plant transmittance is measured. For example, LAI-2000(Li-Cor Biosciences, Lincoln, NE, USA), TRAC(3rd Wave Engineering, Nepean, Ontario, Canada), AccuPar(Decagon Devices, Inc, Pullman, WA, USA), and sunScan are representatives of the non-imaging method, whereas Can_Eye(www6.paca.inra.fr/can-eye) and HemiView(Delta-T Devices, Cambridge UK), which are normally used to process digital hemispherical photographs (DHPs) to calculate canopy transmittance, are popular imaging sensorbased methods. Due to greater availability of cameras for capturing images, imaging sensor-based methods are becoming increasingly popular. Among imaging sensor-based methods, a new development that uses a smartphone camera sensor rather than a general-purpose digital camera has emerged recently[4-9]. Building on the high performance-price ratio and multi-sensor integration of
Preprints (www.preprints.org) | NOT PEER-REVIEWED | Posted: 17 January 2017
doi:10.20944/preprints201701.0077.v1
2 of 13
the smartphone, this approach has attracted much attention to measuring LAI using smartphone camera sensors. Confalonieri et al.[5,6] have developed an Android-based mobile application called PocketLAI that can be used to classify plant and background pixels (e.g., sky) in a image acquired at a zenith angle (VZA) of 57.5° and can then estimate LAI using the plant gap fraction at this zenith angle. Qu et al.[9] implemented a smartphone-based LAI measurement instrument called LAISmart. Unlike PocketLAI, which can capture images only at a VZA of 57.5°, LAISmart has no constraint on the observation angle. The operator determines the optimum viewing zenith angle depending on the canopy structure. Therefore, LAISmart can measure not only tall plants using upward-facing images, but also low plants using downward-facing images. To adapt to different plant heights, LAISmart provides a scalable support system. De Bei et al.[8] developed an iOS-based application called (APP)VitiCanopy. Their algorithm originated from the code implemented in a MATLAB script [10,11] that extracted LAI from a general camera canopy image. VitiCanopy measures plant LAI through vertically upward photography. Not only gaps within the canopy, but gaps between canopies are calculated, enabling it to produce a canopy clumping index besides the canopy LAI or effective LAI that is the direct output of LAISmart and PocketLAI. The clumping index can be further used to transform estimated effective LAI into true LAI. At present, VitiCanopy is mainly applied to grapevines. In summary, three methods have been developed to measure plant LAI using a smartphone camera sensor: LAISmart, which calculates LAI using a flexible zenith canopy gap fraction, and PocketLAI, which uses a 57.5° gap fraction. Unlike LAISmart and PocketLAI, which produce effective LAI, the third type of smartphone-based method, VitiCanopy, calculates not only effective LAI, but also true LAI using a canopy clumping index calculated from the upwards zenith gap fraction. This paper compares the performance of smartphone-based methods to measure conifer LAI. Two of the three methods were chosen to carry out the comparison: LAISmart and PocketLAI. The reason the VitiCanopy method was omitted was mainly because when LAISmart is operated in upwards zenith mode, there will be no obvious difference from VitiCanopy if the classification accuracy of the image is kept at a comparable level. Another reason is that the effective LAI is the focus of this paper, and therefore there is no need to calculate clumping index, although it is the unique feature of VitiCanopy. Francone et al.[12] have achieved good verification results measuring maize and grassland with PocketLAI. However, in conifer forest, Orlando et al. [13] found that it was hard to obtain a satisfactory LAI using PocketLAI. In addition, Qu et al. [9] found that the LAI value obtained at 57.5° were much less than those from LAI-2000. Preliminary work carried out independently in different countries on similar conifer forest canopies has given indications that the smartphone-based method at a viewing zenith angle of 57.5° may be dubious. However, all the above conclusions were reached based on a small observed data set. For instance Orlando et al. [13] used observed twelve data on coniferous forests, whereas Qu et al. [9] obtained data only on two dates. This line of research is now entering a new stage where, despite the advantages of smartphonebased LAI measurement methods, it is time to perform more verifications and comparisons to ensure that this method is suitable for measuring coniferous forest LAI. The goal of this paper is to verify further the potential and limitations of different smartphone sensor-based methods for measuring coniferous forest LAI, to reveal the main factors influencing observational accuracy, and to provide a reference for quick, accurate acquisition of coniferous forest LAI data on a regional scale.
Preprints (www.preprints.org) | NOT PEER-REVIEWED | Posted: 17 January 2017
doi:10.20944/preprints201701.0077.v1
3 of 13
2
Methodology and Data
2.1 Estimation of LAI using a smartphone camera sensor LAISmart [9] and PocketLAI [5] share a common canopy light attenuation theory that describes how light transits from the top of the canopy to the sensors placed underneath. This theory can be formulated as the Beer-Lamert law[14]:
p(θ ) = e−G(θ )/cos(θ ) LAI . Then LAI can be obtained as: LAI = − ln P(θ ) cos(θ ) / G(θ ) ,
(1) (2)
where P(θ) is the canopy gap fraction at the sensor zenith θ and G(θ) is the projection of unit foliage area on the plane perpendicular to the view zenith θ. The basic difference between the two methods is that PocketLAI uses the gap fraction at a fixed zenith of 57.5°, whereas LAISmart provides a flexible zenith option with no constraint to a fixed angle. However, previous work has suggested that LAISmart will produce fairly good results if it is operated using the upward zenith mode for measuring conifer canopy LAI. This paper follows the indications of previous work. To calculate LAI using the gap fraction, the G-value should be determined for the canopy structure. LAISmart uses a G-value of 0.5 on the assumption of a spherical distribution of leaf angle [15], whereas PocketLAI uses the same value, but derived from the theory of inclined point quadrats [16]. Hence, LAISmart and PocketLAI can easily calculate LAI when the gap fraction is obtained from images segmented into vegetation and sky pixels:
LAI0 = −2ln p(0) , LAI57 = −2cos(57.5)ln p(57.5) ,
(3) (4)
where LAI0 and LAI57 are the estimated LAI from LAISmart and PocketLAI respectively. Another instrument for measuring conifer LAI is LAI-2000, which uses a multi-angle gap fraction to estimate LAI, unlike the smartphone-based methods that use only one zenith angle. The LAI-2000 algorithm has been widely recognized in the literature, and interested users are encouraged to find detailed information on LAI-2000 in these references [17,18]. Because LAI-2000 has been validated on a wide range of vegetation types, this research has used the LAI value from the LAI2000 instrument as a reference to compare the two smartphone methods. 2.2 Field experiments The experimental area was located around the National Field Observation and Research Station of Inner Mongolia-Great Xing’an Forest Ecosystem of China (50.906°N, 121.502°E) in Genhe City of the Inner Mongolia Autonomous Region in northeastern China [19](Figure 1a). As the northernmost and coldest area in Inner Mongolia, Genhe is located in the cold and humid temperate forest climate region. Annual average temperature is approximately −5.3°C, and precipitation is approximately 300 mm. The research site has a hilly topography with slight gradients (80% less than 15 degrees) and a mean altitude of approximately 950 m.
Preprints (www.preprints.org) | NOT PEER-REVIEWED | Posted: 17 January 2017
doi:10.20944/preprints201701.0077.v1
4 of 13
Table 1 Description on the forest in the Genhe old growth primary forest region[20] Forest structure (mean/std)
Forest type
Dominant species (relative basal area)
Density (stems/ha)
Da (cm)
Dmax (cm)
Ha (m)
Hmax (m)
Larix gmelini forest
L. gmelini (94%)
1135/515
15.1/4.6
41.3/11.6
13.5/3.4
26.9/4.0
Da, mean DBH (diameter at breast height); Dmax, maximum DBH; Ha, mean tree height; Hmax, maximum tree height.
Field experiments were carried out in a 1 km × 1 km area covered by conifer forest mainly composed of Larix gmelini(Figure 1b). Stand measurements were not available during the experimental period of this research, but descriptive information about forests in the same region can be found in the published literature(Table 1). The actual data may differ slightly from published data, but will still be valid as a reference for this region because the Genhe region is covered by old-growth primary forest that has never suffered major human disturbance. Twenty essential sample units (ESUs) 20 m × 20 m in size were established in the experimental area. Different sampling methods were designed according to different instruments inside the ESUs (Figure 1c). For example, for LAISmart, the operator kept the LAISmart smartphone sensor vertically upward and obtained eight observations at approximately regular intervals along an east-west route and a north-south route, giving 16 observed values for one ESU. For PocketLAI, the operator stood in the center of the ESU with the zenith angle of the smartphone at 57.5° and photographed along eight azimuths at 45° intervals, obtaining eight observed values. To obtain the reference LAI using LAI-2000, two LAI-2000 instruments were used. One was placed in the open space outside the forest for vertically upward observation to measure the total downward sky radiance. The logging frequency was configured as 1 minute. The other instrument was held by an operator walking along the same line of LAISmart, but obtaining four pieces of canopy transmittance data in each line, thus there were eight LAI-2000 points in one ESU. A 180° lens cap was used while measuring under the conifer canopy.
Figure 1 The research area located in China (a), the ESU (yellow symbols) ditributed in the reasearch area (b) and the sampling method of three instruments in an ESU (c).
The field measurements were conducted on May 26, July 25, and September 22, 2016, an observation period that covered the growth, development, and withering of coniferous leaves. Note that in the first set of observations (May 26), only 10 ESUs were measured due to limited duration of field observation time, whereas 20 ESUs were measured on the other two dates. When the data were collected using the three instruments described above, cloudy weather conditions were selected to
Preprints (www.preprints.org) | NOT PEER-REVIEWED | Posted: 17 January 2017
doi:10.20944/preprints201701.0077.v1
5 of 13
ensure strong scattered light and weak direct sunlight in the sky. The experimental observation dates, instruments, and numbers of data points are listed in Table 2. Table 2 The instruments and the data number on every experiment date Date Instruments and data number LAISmart PocketLAI LAI-2000 26-May 10 / 10 25-Jul 20 20 20 22-Sep 20 20 20 Both smartphone sensor methods first captured the canopy images, after which the gap fraction was retrieved from each image. An automated segmentation method was used to classify all the pixels into sky or vegetation pixels [5,21]. The gap fraction was calculated as the ratio of the number of sky pixels to the total number of pixels. Then the LAI value was calculated using Eqs. (3) and (4) . To compare the two smartphone sensor methods, a regression model was established as a linear equation through the origin using estimated LAI (LAI0 or LAI57) with a reference LAI equal to LAI2000. To evaluate the performance of the linear model, the coefficient of determination (R2) was calculated. Certain other metrics were also calculated to evaluate the two smartphone sensor methods against LAI-2000 [22]. The performance of the models in reproducing observed data was quantified using the mean absolute error [23] (MAE, from 0 to +∞, optimum 0), the relative root mean square error [24] (RRMSE, from 0 to +∞, optimum 0), the coefficient of residual mass [25] (CRM, from −∞ to +∞, optimum 0), and the modeling efficiency [26] (EF; from -∞ to 1, optimum 1). 3
Results
By taking LAI-2000 as a reference, the correlations between the measured values of the two smartphone sensors and the reference value were calculated, and the bias of the results obtained by the two smartphone methods was analyzed. As shown in the scatter diagram in Figure 2, the observed values of LAISmart were approximately evenly distributed on both sides of the 1:1 line (Figure 2a, b, d). This suggests that there is no obvious systematic deviation between the values obtained by LAISmart and LAI-2000. However, the values obtained by PocketLAI were almost all below the 1:1 line (Figure 2c, e), suggesting an obvious systematic deviation between the values obtained by PocketLAI and LAI-2000. In other words, the observed LAI values using PocketLAI were underestimated. This pattern can also be found in the statistical characteristics of the observed data(Table 3). As shown in Table 3, the regression lines for LAISmart and LAI-2000 passing through the origin had slopes close to 1.0 (0.94, 0.97, and 0.93 respectively) and a mean value closer to LAI-2000 (biases were 0.07, 0.01, and 0.02 respectively). However, the regression lines for PocketLAI and LAI-2000 had slopes of 0.57 and 0.73 respectively, the maximum deviation of the mean value was 1.32, and the minimum was 1.0. Table 3 also shows that all the regression models established between the results of both smartphone methods and the reference value from LAI-2000 had high coefficients of determination, suggesting that although the two methods had different performance with regard to magnitude, both methods could be used to identify the dynamic tendency of coniferous forest LAI.
Preprints (www.preprints.org) | NOT PEER-REVIEWED | Posted: 17 January 2017
doi:10.20944/preprints201701.0077.v1
6 of 13 2.8 (a)
LAISmart (m2 /m 2)
2.4
2
Legend Measured point
1.6
Fitted line 1:1 Line
1.2
0.8 0.8
1.2
1.6
4
2
2.4
2.8 4
(b)
(c)
3.6 3.5 PocketLAI(m2 /m2 )
LAISmart (m2/m 2)
3.2 3
2.5
2.8 2.4 2 1.6
2
1.2 1.5
0.8 1.5
2
2.5
3
3.5
4
0.8
1.2
1.6
2.4
2.8
3.2
3.6
4
2.4
2.4
(d)
(e) 2 PocketLAI(m2 /m2 )
2 LAISmart (m2 /m 2)
2
1.6
1.2
1.6
1.2
0.8
0.8
0.4
0.4 0.4
0.8
1.2 1.6 LAI-2000 (m2 /m2 )
2
2.4
0.4
0.8
1.2 1.6 LAI-2000 (m2 /m2 )
2
2.4
Figure 2 Scatter plot between LAI values of LAI-2000 and those of two smartphone methods (left column for LAISmart and right column for PocketLAI) on three dates (subplot a for 26 May, b and c for 25 Jul. and d, e for 22 Sep.).
Preprints (www.preprints.org) | NOT PEER-REVIEWED | Posted: 17 January 2017
doi:10.20944/preprints201701.0077.v1
7 of 13
Table 3. Statistics parameters of the measured and reference LAI values
Date May 26 Jul.25 Sep.22
Instruments
S
R2
LAISmart PocketLAI LAISmart PocketLAI LAISmart PocketLAI
0.94 0.97 0.57 0.93 0.73
0.97 0.96 0.96 0.93 0.96
Averaged LAI LAI-2000 Smartphone 1.95 1.88 2.39 2.40 2.39 1.39 1.40 1.38 1.40 1.08
AB 0.07 0.01 1.00 0.02 0.32
S: Slope of a linear regression through the origin; R2: Coefficient of determination; AB: the absolute bias of the measured LAI and the reference LAI.
To judge whether the two smartphone methods can produce a statistically identical result to a reference instrument (LAI-2000), a hypothesis test was carried out using Student’s t-test for the above data. The basic principle of the test is that, for independent experiments on the same objects (here, conifer LAI), the different observation methods should lead to the same statistically significant result. In other words, the data obtained by the different sampling methods should come from the same population. The Student’s t-test results are listed in Table 4, where H = 0 indicates that the smartphone sensor results come from the same population as the LAI-2000 values and H = 1 indicates the opposite test result. P is the probability that H = 0 can be accepted, and the parameters CI_2.5, CI_97.5 define the 95% confidence interval for the observation bias of LAI-2000 and smartphones. The test results show that the observed results from LAISmart and LAI-2000 on the three days can be considered as being from the same population (H = 0). The probability of being unable to reject the hypothesis on the dates of June 25 and September 22 was greater than 85%. Moreover, the 95% confidence interval for the deviation between LAI-2000 and LAISmart was located approximately with zero as the center of a symmetric region, suggesting that there was little deviation between the two measures, a result that can be approximately considered as a zero deviation. Although the results obtained on May 26 show a slightly lower probability of acceptance (0.6) and an asymmetrical confidence interval, they still could pass the Student’s t-test (H = 0). However, for all the observed results from PocketLAI, Student’s t-test indicated acceptance of H = 1, suggesting that these observed values could not be considered as coming from the same population as the LAI-2000 data. This means that there was an obvious difference in performance between PocketLAI and LAI-2000, which also was manifested by the confidence interval. These results indicate that the LAI obtained from LAI-2000 was significantly higher than that obtained from PocketLAI because the lower bound (CI_2.5) of the 95% confidence interval for their deviation was greater than zero. Recalling the results in Table 3, the slopes of all the regression lines between PocketLAI and LAI-2000 were far less than 1.0, showing that in most cases, plant LAI was underestimated by PocketLAI.
Preprints (www.preprints.org) | NOT PEER-REVIEWED | Posted: 17 January 2017
doi:10.20944/preprints201701.0077.v1
8 of 13 4
(a)
3
Measured point
3 PocketLAI(m2 /m2 )
LAISmart (m 2/m2 )
(b)
4
2
2
1
1
0
0 0
1
2 LAI-2000 (m2/m2 )
3
4
Fitted line 1:1 Line
0
1
2 LAI-2000 (m2/m2 )
3
4
Figure 3 Scatter plot of the measurements of two smartphone sensors method with the data of LAI2000 using all the data collected during the experiment period Table 4 Results of Student’s t-test results for the LAIs of smartphone sensors and those of LAI-2000.
Date May.26 Jul.25 Sep.22
Method LAISmart PocketLAI LAISmart PocketLAI LAISmart
H 0 0 1 0
P 0.6 0.88 0 0.85
CI_2.5 -0.19 -0.25 0.78 -0.17
CI_97.5 0.32 0.22 1.21 0.21
PocketLAI 1 0 0.17 0.48 The next step was to compare the observed data obtained by the two kinds of smartphones on all three dates with the values observed by LAI-2000. A scatter plot of these data is shown in Figure 3, and the regressive statistical parameters are shown in Table 5. The results are similar to the comparison made on separate dates, as shown in Table 3 and Figure 2. Both methods could measure the dynamic tendency with almost the same coefficient of determination, but the linear regression equation of PocketLAI had a lower slope. Table 5 Regression parameters and the evaluation metrics of the two smartphone sensor methods compared with references LAI.
LAISmart PocketLAI
S 0.96 0.61
R2 0.96 0.95
RMSE 0.43 0.84
RRMSE 0.22 0.44
MAE 0.34 0.69
EF 0.55 -0.49
CRM 0.00 -0.35
MAE: mean absolute error; RRMSE: relative root mean square error; EF: modelling efficiency; CRM: coefficient of residual mass.
RMSE, RRMSE, and MAE, which indicate the accuracy of the two methods, show that LAISmart has much higher accuracy. As for the statistical indices of model efficiency (EF and CRM), in general, the Nash-Sutcliffe model efficiency coefficient (EF) confirmed the overall good performance of LAISmart, with a value of 0.55, whereas PocketLAI had a negative EF (-0.49). The value of E < 0 indicates that the reference mean is better than the mean of PocketLAI. The value of the LAISmart CRM equal to zero indicates that there is no difference between LAISmart and the LAI-2000 instrument, whereas the negative value of the PocketLAI CRM indicates that the LAI from the images at a zenith angle of 57.5° is lower than the reference value. To visualize the difference in measurement results between these two kinds of smartphones and LAI-2000, their Q-Q plot is shown in Figure 4 . A Q-Q plot is a type of probability plot that compares the probability distribution of two data sets by plotting their quantiles against each other. If the two
Preprints (www.preprints.org) | NOT PEER-REVIEWED | Posted: 17 January 2017
doi:10.20944/preprints201701.0077.v1
9 of 13
datasets being compared have similar distributions, the points will lie approximately on the line y = x. If the distributions are linearly related, the points will lie on a line, but not necessarily the y = x line. The Q-Q plot in Figure 4a basically coincides with the y = x line, although there was a slight bias as the LAI value approached 3.0 m2/m2, suggesting that the measured values from LAISmart and LAI-2000 can be considered as coming from the same sample population. However, because the PocketLAI line in Figure 4b obviously deviated from the y = x line, it is hard to conclude that the data from PocketLAI obey the same distribution as those from LAI-2000. This result again confirms the result from the Student’s t-test, as shown in Table 4Table 3.
Figure 4 The Q-Q plot of two smartphone sensor methods with the LAI-2000 instrument. The similar quantile-quantile plot around y = x line of LAISmart and LAI-2000 (a) indicates that they share a same distribution, while the PocketLAI measurement can’t be taken as a same distribution of LAI-2000 as there is much bias to the y = x line (b).
4
Discussion
A comparison between the measurement results of the two smartphone sensor methods with LAI-2000 indicates that although the measured values obtained by both methods can reflect dynamic changes in coniferous forest LAI, in terms of measurement accuracy, the LAISmart results were closer to those from LAI-2000. Because the two smartphones had identical hardware configurations and almost identical sampling methods in the experiment, the difference in their results could only have been caused by classification algorithm or shooting zenith angle. The classification algorithm mainly influenced the canopy gap fraction extracted from the digital image. The algorithm used in both smartphone methods used the blue band as the feature to extract plant and skylight pixels. Therefore, the classification algorithm did not greatly affect these two methods, although even a difference in some specific detail of the programming implementation might have caused a slight bias. Given that there was not much difference between the classification algorithms, the main factor that can influence gap fraction accuracy is the camera’s auto-exposure mode. [27] found that autoexposure might overestimate the canopy gap fraction, but for plants with low canopy density, the gap fraction overestimation caused by auto-exposure would be less than 5%. In these experiments, the maximum LAI as measured by LAI-2000 was 3.48 m2/m2, which can be considered as a lowdensity canopy most of the time. Hence, it can be inferred that at the beginning or end of the experiment, corresponding to leaf emergence and defoliation stages, the accuracy of LAI produced by smartphone methods might be better. Another reason for gap fraction overestimation could have been the global optimum thresholding method for automatic image segmentation[28]. Due to gap fraction overestimation, the estimated value of LAI was lower than the real LAI. As shown by the results presented in this paper, both methods produced some underestimation. However, underestimation was more severe in
Preprints (www.preprints.org) | NOT PEER-REVIEWED | Posted: 17 January 2017
doi:10.20944/preprints201701.0077.v1
10 of 13
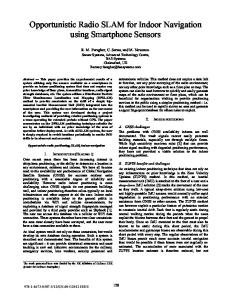
PocketLAI than in LAISmart, mostly because canopy gap fraction was overestimated. However, [9] found that the underestimation of LAI caused by gap fraction overestimation was inversely proportional to the real gap fraction. Hence, for sparse discrete plants with a large gap fraction, overestimation of the canopy gap fraction caused by the classification method would not lead to an obvious loss of LAI estimation accuracy. 0.9 0.8
G(θ)
0.7 0.6 0.5
Nadir 57
0.4 0.3 0
23
38
53
68
View zenith angle (degree) Ideal G
mean G
25-May
26-Jul
22-Sep
Figure 5 Foliage projection coefficient (G) derived from LAI-2000 instrument at three dates. The mean G values of the measured LAI G values on the three dates is plotted as grey line, and the ideal G = 0.5 also is plotted as solid black line. The averaged G for LAISmart and PocketLAI are plotted as solid triangle.
The shooting angle (camera zenith angle) affected LAI extraction accuracy in two main ways: first, the degree of closeness between the G-value used in the model and the real G-value at a specific shooting angle; and second, the proportion of leaf elements that might be influenced by shooting angle under large FOV (field of view). These two aspects will be discussed separately in the following section. First, the zenith angle of the sensor affects the G-value used in the two smartphone methods. Figure 5 shows the G functions (dashed-dotted lines) measured by LAI-2000 on the three days, as well as the average G functions (grey line) on the three dates. Although G is related not only to viewing zenith angle, but also to leaf inclination angle, for a certain plant type (conifers here), the influence of leaf inclination angle can be ignored. Hence, in this paper, it has been assumed that G is related only to the viewing zenith angle. Because the FOV of the camera in a mobile phone is basically around 70° [9], the mean of the Gvalue of the first three angles in LAI-2000 was taken to be the G-value corresponding to the LAISmart viewing zenith angle, and the mean of the last two angles was taken to be the G-value corresponding to the PocketLAI viewing zenith angle of 57.5°. The calculated G-values of the two methods are shown as the solid triangle in Figure 5. As shown in Figure 5, when the image was taken at a small or moderate viewing angle (corresponding to the observation angle in LAISmart), the G-value (0.59) of the coniferous forest was greater than the assumed value (G = 0.5). However, when the zenith angle was larger (corresponding to the observation angle of 57.5° in PocketLAI), the real G-value (