ISPRS Annals of the Photogrammetry, Remote Sensing and Spatial Information Sciences, Volume I-7, 2012 XXII ISPRS Congress, 25 August – 01 September 2012, Melbourne, Australia
ANALYSIS OF MULTITEMPORAL AND MULTISENSOR REMOTE SENSING DATA FOR CROP ROTATION MAPPING G. Waldhoff a, *, C. Curdt a, D. Hoffmeister a, G. Bareth a a
University of Cologne, Institute of Geography, 50923 Cologne, Germany - (guido.waldhoff, c.curdt, dirk.hoffmeister, g.bareth)@uni-koeln.de
KEY WORDS: remote sensing, GIS, land cover, land use, multitemporal, multisensor, classification, crop
ABSTRACT: For accurate regional modelling of (agro-)ecosystems, up-to-date land use information is essential to assess the impact of the permanent changing vegetation cover of agricultural land on matter fluxes in the soil-vegetation-atmosphere (SVA) system. In this regard, officially available land use datasets are mostly inadequate, since they only provide generalised information concerning agricultural land use. In this contribution, we present our work for the year 2008 on the generation of multi temporal, disaggregated land use data with the goal to derive a crop rotation map for the years 2008-2010 for the study area of the research project CRC/TR 32. For this purpose, the Multi-Data Approach (MDA) was used to integrate multitemporal remote sensing classifications with additional spatial information by the means of expert knowledge-based production rules. Our results show that the information content of a land use dataset is considerably enhanced by combining crop type information of multiple observations during each growing season. For a sufficient temporal coverage, the usage of multiple sensors is generally inevitable. Thus, datasets of ASTER, Landsat TM & ETM+ as well as IRS-P6 were incorporated. In terms of classification accuracy our analysis yielded similar results with support vector machines (SVM) and the classical maximum likelihood classifier (MLC) for all sensors, with SVM being mostly only slightly better. For the refinement of land parcel boundaries and the reduction of misclassification, the incorporation of the ‘field block’ (FB) vector information was very effective. ‘Field blocks’, provided by the chamber of agriculture, are coherent agricultural areas with (relatively) permanent boundaries. As a result, a much more accurate differentiation of agricultural land and non- agricultural land was achieved. With the enhanced annual MDA land use data of the three consecutive years containing crop type information sufficient information is available for the derivation of crop rotation. Again, adapted knowledge-based production rules are used for this purpose.
between arable land, grassland, orchards or specialized crops is made. Additionally, the spatial resolution of official land use maps usually is too low (Rohierse & Bareth, 2004). Moreover, official datasets usually have up-date-cycles of more than three years. As a result, the annual changes of agricultural land parcels are not considered by such datasets. In contrast, for regional (agro-)ecosystem modelling accurate spatial information on the major agricultural crop types and crop rotations (CR), which are actually practised in a region are required on the basis of land parcels. For the application of process-based models like the DANUBIA crop growth model (Lenz-Wiedemann et al., 2010), CR are important to account for multi annual investigations. Additionally this data includes management information like the dates of sowing, fertilization, irrigation or harvest on an annual base and per single field (Waldhoff & Bareth, 2009). Only with such data, uncertainties that are usually introduced in models by inadequate land use information can be avoided (Bareth, 2008; Kersebaum et al., 2007).
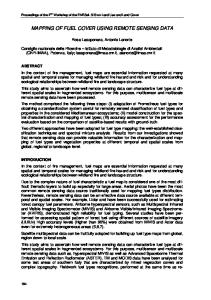
1. INTRODUCTION The interdisciplinary research project CRC TR32: “Patterns in Soil-Vegetation-Atmosphere-Systems: Monitoring, Modelling and Data Assimilation” works on matter fluxes between soil, vegetation and atmosphere (SVA) on a regional scale. The overall goal is to yield improved numerical SVA models for the prediction of CO2-, water- and energy-transfer by calculating the patterns at various scales (CRC-TR32, 2011). The study area of the CRC TR32, the catchment of the river Rur, is situated in western Germany, parts of the Netherlands and Belgium. The northern part is characterised by a fairly flat terrain that is dominated by intensive agriculture, whereas the southern part consists of low mountain ranges with forest areas and grass land (cf. Figure 1). Owing to the huge amount of annually changing cultivated land in the area of investigation, detailed and up-to-date land use (LU) information is essential to accurately assess the impact of change in vegetation cover on SVA interactions. In this regard, nowadays several LU datasets of different quality are available from official sources, in particular for lager regions. Popular datasets like Corine Land Cover are, for instance, available for most of Europe. However, although such datasets provide valuable information for numerous applications, they are inadequate for investigations of (agro-) ecosystems for several reasons. Official land use datasets mostly contain fairly generalised information concerning agricultural areas, since only a differentiation
Thus, in this contribution, we present our work on the generation of improved multi annual disaggregated land use data for the years 2008-2010 by incorporating of multiple remote sensing datasets of different sensors with additional spatial LU information. Based on the consecutive annual LU datasets a crop rotation map of the study area can be derived. Exemplary for the production of the annual LU datasets, this paper will focus on a reworked LU analysis for the year 2008.
* Corresponding author.
177
ISPRS Annals of the Photogrammetry, Remote Sensing and Spatial Information Sciences, Volume I-7, 2012 XXII ISPRS Congress, 25 August – 01 September 2012, Melbourne, Australia
includes the usage of all kinds of spatial data that contain valuable LU information. For this purpose, all information sources (i.e. remote sensing classification results and other geodata) are combined into a multi-layer raster stack in a GIS environment. For the final MDA-LU dataset of each year, expert knowledge-based production rules are applied to the data stack to extract the desired LU information of each layer. In this way, all useful LU or crop type information were retrieved from the different time slices and transferred to a (new) LU target layer in the stack. Then, other production rules are compiled to transfer the spatial information from the additional land use datasets to the target. The crop rotation map is generated by combining the annual LU datasets of at least three consecutive years into a new layer stack. To obtain the CR information, additional production rules translate all the occurring crop rotation combinations into unique single values. On the basis of these values the spatial distribution and the frequency of individual crop rotations can be calculated for every land parcel (Waldhoff et al., 2011). 2.2 Additional data To support the remote sensing data analysis and to further enrich the information content of the final MDA-LU, several additional spatial datasets are incorporated in the LU analysis. In this paper the usage of the ATKIS Basic-DLM and of ‘field blocks’ as additional datasets is addressed in particular. Both datasets are described below. The ‘Authorative TopographicCartographic Information System (ATKIS) is the Digital Landscape Model (DLM) for Germany.
Figure 1. LU Classification of 2008 for the CRC/TR32 study area, the Rur Catchment
Figure 2.
Rasterised subset of the ATKIS Basic-DLM for Germany (data source: Geobasis NRW)
In addition to classical LU datasets, DLMs recently are becoming more prevalent in many countries. The ATKIS BasicDLM is provided by the official state survey and mapping agency in vector format and is known for a high spatial accuracy and resolution. The ATKIS provides topographical information, like the road network, prominent landscape features, and additionally valuable LU information concerning residential, industrial and impervious surface areas. Moreover, information regarding vegetation such as forest areas, arable land or grassland is included. However, the information content concerning arable land is highly aggregated (cf. Figure 2). The level of detail of the ATKIS is based on the Topographical Map 1:25,000 of Germany. Yet, the road network or point features have a spatial accuracy of ± 3 m (AdV, 2006). The update cycle
2. DATA &METHODS 2.1 Multi-Data Approach (MDA) For the generation of disaggregated multi temporal und multi annual LU data the methodology of the Multi-Data Approach (MDA) was applied. This method is continuously further developed since the late 1990s (Bareth, 2001) and is described in more detail in Bareth (2008) and Waldhoff & Bareth (2009). The basic idea of the MDA is the incorporation of as much as spatial information that is available to enhance and refine the information content of LU datasets. Besides the supervised classification of multitemoral remote sensing data to obtain upto-date land use information, this approach additionally
178
ISPRS Annals of the Photogrammetry, Remote Sensing and Spatial Information Sciences, Volume I-7, 2012 XXII ISPRS Congress, 25 August – 01 September 2012, Melbourne, Australia
for ATKIS currently is three years. From the ATKIS, information regarding residential, commercial, industrial land use or the road network is of interest for the production of the MDA-LU dataset.
SWIR detector since April 2008 (LP DAAC, 2009), only the VNIR bands of the L1A data product were used. Table 4 lists the datasets with the corresponding observations dates that were used for the 2008 LU map. Unfortunately, still not all scenes were cloud free. Areas with massive cloud cover were masked prior to the analysis.
The ‘field block’ (FB, in German so-called ‘Feldblöcke’) information is a vector dataset that contains the entire agricultural area of Germany as individual polygon features (cf. Figure 3). For the study area the FB data is provided by the Chamber of Agriculture of North Rhine-Westphalia. Single FB consist of coherent parcels of the same principle agricultural land use type (i.e. mainly arable land or pasture) that are bordered by a persistent enclosing, like roads, rivers or forest (LWK NRW, 2011a).
Sensor ASTER (VNIR only) IRS-P6 (LISS III) Landsat ETM+ (L7) Landsat TM (L5) Table 4.
Acquisition date 5th of May 10th of June 7th of July th 9 of September
Remote Sensing datasets analysed for the multitemporal LU classification of 2008
With the beginning of 2009, the RapidEye system could be added to the data pool. Because of the high revisiting rate of the RapidEye satellites, sufficient annual data coverage for the other years was achieved by mainly using this system. 2.4 Data pre-processing For the analysis of the remote sensing data, several data type specific pre-processing tasks had to be conducted. These included radiometric calibration, mosaicking of multiple scenes of an observation date, spatial subsetting of data or interpolation of data gaps in the case of the Landsat ETM+ data. However, no atmospheric correction was required, since the training data for the classification stage was derived from each of the datasets itself (Song et al., 2001). Owing to the fact that Landsat ETM+ is only capable of acquiring image data in the so-called ‘SLCoff’-mode (scan line corrector-off-mode) since May, 2003 (USGS, 2010), nodata gaps are apparent in the scenes. Nevertheless, the data was selected, since it still carried valuable information. To compensate the interferences, a gap filling algorithm (Minari, 2009) was applied. In the case of homogeneous areas like agricultural fields this algorithm produced satisfying results for the selected scenes, whereas blur was sometimes introduced for heterogeneous areas, or when data gaps got too big. As a result, areas that were not delineated as agricultural land by the ‘field block’ were masked out for the further analysis.
Figure 3. ‘Field block’ vector data for Germany. (Data source: Landwirtschaftskammer NRW, 2009) Compared to the content of the ATKIS, the information regarding agricultural LU of the FB data is considerably more accurate. Moreover, FB data are updated annually, since they are the basis of agricultural funding. Hence, virtually every agricultural area is included in the dataset. With regard to the remote sensing data, all data layers that stem from ATKIS as well as the FB data were rasterised for the further analysis.
Then, all scenes of the various sensors were resampled to the same cell size. In view of the wide range of spatial resolutions from 30 m of Landsat, 23 m of IRS-P6, 15 m of ASTER and 5 m of RapidEye (not available for 2008), a spatial resolution of 15 m was chosen. This cell size was regarded as a trade-off between the different remote sensor capabilities, (concerning the information content of a raster cell) and the data amount that has to be processed in the analyses. Additionally, this resolution still allows capturing single agricultural parcels. Likewise, also the additional LU information of the FB and the ATKIS were rasterised to 15 m spatial resolution. As a next step, all datasets were registered to a master base layer. For this purpose, the road network of the ATKIS DLM was chosen, because of its high spatial accuracy. A good alignment to this layer is of major importance for multitemporal and multi data analysis (Jensen, 2005). To assure that the spatial position of the raster cells of all incorporated datasets perfectly match each other, the road network was also set as a so-called snap raster.
2.3 Remote Sensing Data For the remote sensing based land use mapping of the study area of consecutive years, multiple remote sensing datasets for the years 2008-2010 were purchased. For the annual LU maps usually three to five observations during each growing season are necessary to capture the major occurring agricultural crops, owing to their differences in crop phenology. Because of the frequent cloud cover in the temperate latitudes a sufficient spatial and temporal coverage of a study area is often hard to achieve, relying on a single optical remote sensing system only. Therefore, the incorporation of multiple sensors can be useful. As a result, for the presented analysis of the year 2008, four multispectral datasets of the 'Advanced Spaceborne Thermal Emission and Reflection Radiometer' (ASTER), Landsat (TM/ETM+), and IRS-P6 were determined as suitable for the analysis. From ASTER, due to the malfunctioning of the
179
ISPRS Annals of the Photogrammetry, Remote Sensing and Spatial Information Sciences, Volume I-7, 2012 XXII ISPRS Congress, 25 August – 01 September 2012, Melbourne, Australia
obtaining information on potatoes and spring barley, in particular the L7 scene was used, which was acquired later in the growing season. The mapping of maize and sugar beet was mainly conducted with the L5 scene. At that time most of the other field major crops are already harvested in the study area.
2.5 Remote Sensing Analyses Prior to the supervised classifications of the remote sensing data several extensive ground reference mapping campaigns were carried out during each growing season. For this purpose, different mapping regions within the study area were selected to account for the heterogeneity of the vegetation cover and land use composition. These areas where repeatedly visited during each year. With regard to the derivation of the crop rotations, the same areas were revisited in the following years. In this way, also reference information for the crop rotations per se was collected. Afterwards, one part of the collected ground reference information was used for the training of the classification algorithms, while the rest was saved for the post classification accuracy assessment.
In terms of non-agricultural land use, information regarding impervious surfaces of settlements was refined by incorporating the corresponding information of the ATKIS. For example, in this way residential LU was differentiated from business LU. Additionally the road network was taken from the ATKIS.
In the classification stage every scene was classified separately using the adequate ground reference information for the observation date. Regions of known land use were identified in each image and consequently marked as training regions. For the investigation of the achievable classification results with different classifiers, both Support Vector Machines (SVM) and the Maximum-Likelihood Classifier (MLC) were chosen for the remote sensing analysis. The best classification result was then used for the subsequent analysis steps. SVM currently receive a lot of attention in remote sensing, due to their ability to perform well, even with limited training samples available (Mountrakis, 2011, Foody & Mathur, 2004). As a non-parametric method coming from machine learning theory, it is fundamentally different from the classical MLC, which is based on statistical parameters like mean and covariance (Jones et al., 2010). To receive comparable results, equal sets of training samples were used for each classifier. Although, both algorithms use the training data in different ways (Foody & Mathur, 2006), it was tried to take the requirements of both methods on the trainings samples into account. Additionally to the classification of the whole scenes, analyses of the agricultural land only were conducted to reduce possible misclassifications of agricultural crops (e.g. grassland vs. cereals). In accordance with the processing of the L7 data, the FB data was used as mask. After the individual classification of each remote sensing scene, the resulting land use classification layers were stacked together with the additional datasets to a multi-layer raster file for the MDA-LU analysis.
Figure 5. Subset of the MDA-LU dataset of 2008. Remote sensing derived crop type and vegetation information is integrated with LU from ATKIS. The information on pasture stems from the FB data
3. RESULTS Concerning the accurateness of the individual LU classifications, table 6 lists the overall accuracies and Kappa values of the classification results for SVM and MLC where the complete scenes were classified. The L7 scene is an exception.
In Figure 5, a subset of the final MDA-LU map of 2008 for the Rur catchment is displayed. The whole LU map is shown in Figure 1. With the exception of the information on pasture, which stems from the FB data, the complete vegetation information was derived by the remote sensing data analysis. Concerning the major agricultural crops, due to the different acquisition dates, certain scenes were used to obtain a particular field crop. For instance, the differentiation of rapeseed, winter wheat and winter barley was possible with the ASTER and the IRS-P6 scenes, which stem from early May and mid-June, respectively. Especially in the case of the ASTER observation, land parcels which would potentially contain sugar beet, potato or maize, appear as bare soil at this stage in the image. Cereals in contrast are then already in a developed growing stage. For
Scene ASTER IRS-P6 L7 (ETM+) L5 (TM)
Overall Accuracy / Kappa Coefficient SVM MLC 92.04% 0.91 90.85% 0.89 93.38% 0.92 94.24% 0.93 89.30% 0.87 87.27% 0.84 97.44 0.97 97.02% 0.96
Table 6. Accuracy assessments results of the LU classifications of 2008 for the complete scene classifications
180
ISPRS Annals of the Photogrammetry, Remote Sensing and Spatial Information Sciences, Volume I-7, 2012 XXII ISPRS Congress, 25 August – 01 September 2012, Melbourne, Australia
Here only arable land was classified. Apart from the IRS-P6 results, SVM yielded always better results. Although, the maximal difference in overall accuracy is about 3%.
time is considerable factor. Therefore, it seemed that the choice of the right training samples might be more important in the case of this study.
With regard to the very high calculated accuracies for all classifications it should be noted that the overall accuracies are used for simplicity reasons to compare classification results and not to report on the actual quality of the classifications in the first place. Of course, the results are based on error matrices. For the accuracy assessment, data from field surveys were considered. This could have led to the very good results.
REFERENCES AdV, 2006. Documentation on the Modelling of Geoinformation of Official Surveying and Mapping (GeoInfoDok), Section 5.4, Explanations on ATKIS. http://www.adv-online.de/icc/extdeu/binarywriterservlet? imgUid=56c70c75-416c-ed01-3bbb-251ec0023010&uBas Variant=11111111-1111-1111-1111-111111111111&is Download=true (accessed 29 Sep. 2011)
4. DISCUSSION & CONCLUSION Without the inclusion of multitemporal remote sensing data of different sensors, the information content on the major agricultural crops could not have been derived, for such a heterogenic region like the study area. With multispectral data, several crops are only distinguishable from another at certain stage in the growing season. Therefore multiple observation dates were mandatory. Additionally through the multitemporal observations and the incorporation of expert knowledge, deductions on basic crop types were possible, that are not detectable directly. For example, parcels with bare soil in May cannot contain winter cereals.
Bareth, G., 2008. Multi-Data Approach (MDA) for enhanced land use and land cover mapping. Proc. XXI ISPRS Congress, 3-11 July 2008, Beijing, China.
The differentiation of grassland and cereals (and other green vegetation) is often problematic. By incorporating the FB data this problem is mainly solved. While the FB does not carry information regarding crops on arable land, the spatial information on land parcels that are used as pasture is available on a yearly basis. In this way, misallocations between grassland and cereals can were prevented already in the classification stage, by masking out the pasture.
Foody, G.M., Mathur, A., 2006. The use of small training sets containing mixed pixels for accurate hard image classification: Training on mixed spectral responses for classification by a SVM. Remote Sensing of Environment 103, pp. 179-189.
For the investigation of matter fluxes in the SVA system, also different residential or commercial LU types have to be considered (e.g. industrial sources of CO2 emission). The identification of such LU types by remote sensing alone would be a lot more complicated. Moreover, maintaining the high spatial accuracy of the ATKIS in the final MDA-LU dataset reduces the problems of misalignment. Such problems are often encountered where data of different sources and dates is included in GIS and remote sensing analyses.
Jensen, J.R., 2005. Introductory digital image processing: a remote sensing perspective. Prentice Hall, Upper Saddle River.
Bareth, G., 2001. Integration of an IRS-1C land use classification in the official topographical information system (ATKIS) to enhance the quality of the information of arable land and grassland for a dairy farm region in southern Germany (in German with English summary). GIS 6/2001, pp. 40-45. CRC-TR32, 2011. Funding proposal, 2nd http://www.tr32.uni-koeln.de (accessed 15 Sep. 2011).
phase.
Foody, G.M., Mathur, A., 2004. A relative evaluation of multiclass image classification by support vector machines. IEEE Trans. Geosci. Remote Sensing 42, pp. 1335-1343.
Jones, H.G., Vaughan, R.A., 2010. Remote Sensing of Vegetation: Principles, Techniques, and Applications. Oxford University Press. Kersebaum, K.Ch.; Hecker, J-M.; Mirschel, W., Wegehenkel, M., 2007. Modelling water and nutrient dynamics in soil-crop systems. Springer, Berlin Heidelberg New York.
With the MDA numerous information sources can be integrated into the analysis. Likewise, the crop information of the annual MDA-LU datasets is handled with the MDA to generate crop rotations by using adapted production rules (Waldhoff et al., 2011).
Lenz-Wiedemann, V.I.S., Klar, C.W., Schneider, K., 2010. Development and test of a crop growth model for application within a Global Change decision support system. Ecological Modelling 221, pp. 314-329. LP DAAC (Land Processes Distributed Active Archive Center), 2009. Change in Status Alert for the ASTER SWIR detector. https://lpdaac.usgs.gov/about/news_archive/wednesday_july_01 _2009 (accessed 19. April. 2012).
Beside the extraction of up-to-date LU information, finding the most suitable classifier for the analysis was a second goal of the study. Although, most of the time the results of SVM were used in the study, the comparison revealed than both algorithms produced more or less the same results, with SVM being (only) a few percent better. Also, it seemed as if SVM performed a little better at class boundaries, where frequently pixels with mixed LU type (spectrally mixed pixels) occur. However, SVM needed significantly more processing time compared to MLC (sereval hours vs. less than a few minutes). As a result, we conclude that for this study the choice of the classification algorithm was fairly not that important for the whole investigation. In view of the fact that multiple classifications have to be conducted in the context of this work, processing
LWK NRW, 2011a. Ratgeber Förderung 2011. http://www.landwirtschaftskammer.de/foerderung/pdf/ratgeberfoerderung-2011.pdf (accessed 12. Jan. 2012). LWK NRW, 2011b. Gestaltung der Fruchtfolge, Bonn, Münster, Germany. http://www.landwirtschaftskammer.de/ landwirtschaft/ackerbau/fruchtfolge/gestaltung-fruchtfolgepdf.pdf (accessed 14. Sep. 2011).
181
ISPRS Annals of the Photogrammetry, Remote Sensing and Spatial Information Sciences, Volume I-7, 2012 XXII ISPRS Congress, 25 August – 01 September 2012, Melbourne, Australia
Minari, M., 2009. Landst_gapfill. ENVI user function. http://www.exelisvis.com/Default.aspx?tabid=1540&id=1277 (accessed 06. April. 2011). Mountrakis, G., Im, J., Ogole, C., 2011. Support vector machines in remote sensing: A review. ISPRS Journal of Photogrammetry and Remote Sensing 66, pp. 247-259. Rohierse, A., Bareth, G., 2004. Integration of multitemporal remote sensing analyses in ATKIS for the disaggregation of the object type arable land (in German with English summary). GIS, 03/2004, pp. 35-41. Song, C., Woodcock, C.E., Seto, K.C., Lenney, M.P., Macomber, S.A., 2001. Classification and Change Detection Using Landsat TM Data: When and How to Correct Atmospheric Effects? Remote Sensing of Environment 75, pp. 230-244. Waldhoff, G., Bareth, G., 2009. GIS- and RS-based land use and land cover analysis - case study Rur-Watershed, Germany. In: Lin, L., Xia, L., Kai, L. & Xinchang, Z. (eds.): Geoinformatics 2008 and Joint Conference on GIS and Built Environment: Advanced Spatial Data Models and Analyses. Guangzhou, Guangdong, China. Proc. SPIE, Vol. 7146, 714626. doi:10.1117/12.813171 Waldhoff, G., Curdt, C., Hoffmister, D. , Bareth, G., 2011. Spatio-temporal Land Use Patterns for Regional (Agro)Ecosystem Modelling. Proc. Int. Symposium on Remote Sensing and GIS methods for Change Detection and SpatioTemporal Modelling (CDSM),15.-16.12.2011, Hong Kong, China. USGS, 2010. SLC-off Products: Background. http://landsat.usgs.gov/products_slcoffbackground.php (accessed 11. Jan. 2012).
ACKNOWLEDGEMENTS The CRC TR 32 is funded by the German Research Foundation (DFG). We thank the German Aerospace Center (DLR) for the provision of data from the RapidEye Science Archive and Geobasis.NRW for the provision of the ATKIS-Basic-DLM. Additionally, we thank the Chamber of Agriculture of North Rhine-Westphalia (Landwirtschaftskammer NRW) for the supply of the ‘field block’ data (Feldblöcke). "The ASTER L1A data were obtained through the online Data Pool at the NASA Land Processes Distributed Active Archive Center (LP DAAC), USGS/Earth Resources Observation and Science (EROS) Center, Sioux Falls, South Dakota (http://lpdaac.usgs.gov/get_data)."
182