UNIVERSITY OF CANTERBURY
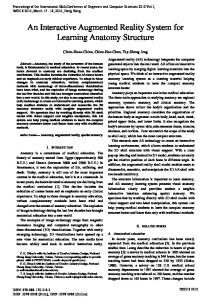
An Augmented Reality Interface for Supporting Remote Insurance Claim Assessment
by Xiang,Yue
A thesis submitted in partial fulfillment of the requirements for the degree of Master of Human Interface Technology
in the HIT Lab NZ College of Engineering
March 2016
—————————————————————-
Acknowledgements I would like to express sincere appreciation to my senior supervisor Prof. Christoph Bartneck for his fantastic guidance and supervision. I would also like thank my Cosupervisor Dr. Gun Lee for leading me through all my difficulties in my Master study and research, for his patience, motivation, and immense knowledge. My sincere thanks also goes to co-supervisor Prof. Mark Billinghurst who gave wonderful feedback and constant support during the course of this thesis. Besides my supervisors, I would like to thank the outstanding staff from Suncorp Insurance: Collin Chan,Timothy Anderson, Gina Belly, Matthew Carter and Faith kimani. I would also like to thank all the students and staff of HIT Lab NZ for their motivation, help and support. I would also like to thank my parents for their wise counsel and sympathetic ear.
i
Abstract In past few years Augmented Reality (AR) technology has been applied to many industries and proved successful with helping the expansion of businesses. This thesis focuses on exploring how AR-based remote collaboration be used for supporting insurance claim processes. Previous research on remote collaboration and video conferencing have been reviewed. Following an interface design procedure, the final system components was defined and a remote assessment prototype was developed. It could especially facilitate the claim assessment timing and help to improve the communication between users. As a part of the prototype interface, the orientation compass plays a significant role for decreasing disorientation in remote perception. A formal user study was conducted to evaluate two different designs of 3D compass. The results of the user study show that the World-fixed compass has the best overall performance compared to the User-fixed compass or Without-orientation compass.
ii
Contents Acknowledgements
i
Abstract
ii
List of Figures
v
List of Tables
vii
1 Introduction 1.1 Research Process . . . . . . . . . . . . . . . . . . . . . . . . . . . . . . . . 1.2 Research Questions and Contribution . . . . . . . . . . . . . . . . . . . . 2 Background 2.1 Augmented Reality . . . . . . 2.1.1 Devices for AR . . . . 2.1.2 Computer System . . 2.2 Video conferencing . . . . . . 2.3 AR in Remote Collaboration 2.4 Orientation Compass . . . . . 2.5 Summary . . . . . . . . . . .
. . . . . . .
. . . . . . .
. . . . . . .
. . . . . . .
. . . . . . .
. . . . . . .
. . . . . . .
. . . . . . .
. . . . . . .
. . . . . . .
. . . . . . .
3 Design Process 3.1 Idea Generation . . . . . . . . . . . . . . . . . . . 3.1.1 Brainstorming . . . . . . . . . . . . . . . 3.2 Needs analysis . . . . . . . . . . . . . . . . . . . 3.2.1 Findings from Field Observation . . . . . 3.2.2 Home Claims Customer Journey Analysis 3.2.3 Problem Definition . . . . . . . . . . . . . 3.3 Prototype Concept . . . . . . . . . . . . . . . . . 3.3.1 UI Specification . . . . . . . . . . . . . . 3.3.2 Wireframe . . . . . . . . . . . . . . . . . . 3.3.3 Evaluation of the Wireframe . . . . . . . 3.4 Summary . . . . . . . . . . . . . . . . . . . . . .
. . . . . . .
. . . . . . . . . . .
. . . . . . .
. . . . . . . . . . .
. . . . . . .
. . . . . . . . . . .
. . . . . . .
. . . . . . . . . . .
. . . . . . .
. . . . . . . . . . .
. . . . . . .
. . . . . . . . . . .
. . . . . . .
. . . . . . . . . . .
. . . . . . .
. . . . . . . . . . .
. . . . . . .
. . . . . . . . . . .
. . . . . . .
. . . . . . . . . . .
. . . . . . .
. . . . . . . . . . .
. . . . . . .
. . . . . . . . . . .
1 3 3
. . . . . . .
5 . 5 . 6 . 6 . 7 . 8 . 11 . 12
. . . . . . . . . . .
14 14 14 17 17 19 20 21 22 23 27 28
. . . . . . . . . . .
4 Implementation and Prototype 29 4.1 Hardware . . . . . . . . . . . . . . . . . . . . . . . . . . . . . . . . . . . . 29 4.1.1 Google Project Tango . . . . . . . . . . . . . . . . . . . . . . . . . 29 iii
Contents
4.2
4.3
4.1.2 Laptop . . . . Software . . . . . . . . 4.2.1 IDE and SDK . 4.2.2 Interaction . . Summary . . . . . . .
iv . . . . .
. . . . .
. . . . .
. . . . .
. . . . .
. . . . .
. . . . .
. . . . .
. . . . .
. . . . .
. . . . .
. . . . .
. . . . .
. . . . .
5 User Evaluation 5.1 Evaluation Goal . . . . . . . . . . . . . . . . . 5.2 Research Questions . . . . . . . . . . . . . . . . 5.3 User study design . . . . . . . . . . . . . . . . . 5.3.1 Environment . . . . . . . . . . . . . . . 5.3.2 Materials . . . . . . . . . . . . . . . . . 5.3.3 Conditions . . . . . . . . . . . . . . . . 5.3.4 Experimental Procedure . . . . . . . . . 5.3.5 Measures . . . . . . . . . . . . . . . . . 5.3.5.1 Pre-experiment questionnaire . 5.3.5.2 Per-condition questionnaire . . 5.3.5.3 Post-experiment questionnaire 5.3.5.4 Performance Measures . . . . . 5.3.6 Participants . . . . . . . . . . . . . . . . 5.4 Results . . . . . . . . . . . . . . . . . . . . . . . 5.4.1 Spatial situation awareness . . . . . . . 5.4.2 Disorientation perception . . . . . . . . 5.4.3 Perspicuity . . . . . . . . . . . . . . . . 5.4.4 User Performance . . . . . . . . . . . . 5.4.5 Post-study interview feedback . . . . . . 5.4.5.1 Ranking . . . . . . . . . . . . . 5.4.5.2 Feedback . . . . . . . . . . . . 5.5 Summary . . . . . . . . . . . . . . . . . . . . .
. . . . .
. . . . . . . . . . . . . . . . . . . . . .
. . . . .
. . . . . . . . . . . . . . . . . . . . . .
. . . . .
. . . . . . . . . . . . . . . . . . . . . .
. . . . .
. . . . . . . . . . . . . . . . . . . . . .
. . . . .
. . . . . . . . . . . . . . . . . . . . . .
. . . . .
. . . . . . . . . . . . . . . . . . . . . .
. . . . .
. . . . . . . . . . . . . . . . . . . . . .
. . . . .
. . . . . . . . . . . . . . . . . . . . . .
. . . . .
. . . . . . . . . . . . . . . . . . . . . .
. . . . .
. . . . . . . . . . . . . . . . . . . . . .
. . . . .
. . . . . . . . . . . . . . . . . . . . . .
. . . . .
. . . . . . . . . . . . . . . . . . . . . .
. . . . .
. . . . . . . . . . . . . . . . . . . . . .
. . . . .
. . . . . . . . . . . . . . . . . . . . . .
. . . . .
31 31 34 34 37
. . . . . . . . . . . . . . . . . . . . . .
38 38 38 39 39 40 40 41 44 44 44 45 45 46 46 46 48 49 50 52 52 53 53
6 Discussion
54
7 Conclusions and Future Work 7.1 Conclusions . . . . . . . . . . 7.2 Future Work . . . . . . . . . 7.2.1 Interface . . . . . . . . 7.2.2 Application . . . . . .
57 57 58 58 59
. . . .
. . . .
. . . .
. . . .
. . . .
. . . .
. . . .
. . . .
. . . .
. . . .
. . . .
. . . .
. . . .
. . . .
. . . .
. . . .
. . . .
. . . .
. . . .
. . . .
. . . .
. . . .
. . . .
. . . .
. . . .
Appendices
65
Appendix A Home Claims Customer Journey
65
List of Figures 1.1 1.2 1.3
AXA AR insurance advertisement . . . . . . . . . . . . . . . . . . . . . . Allianz haunted house AR app . . . . . . . . . . . . . . . . . . . . . . . . Interaction Design Process . . . . . . . . . . . . . . . . . . . . . . . . . . .
2 2 3
2.1 2.2 2.3 2.4 2.5 2.6
. . . . .
6 6 7 8 9
2.7 2.8 2.9
Typical AR Applications: a) Gaming, b) Architecture, c) Medicine . . . Different display types for Augmented Reality . . . . . . . . . . . . . . . Computer vision techniques for mobile AR . . . . . . . . . . . . . . . . . Using a head mounted display for task space collaboration . . . . . . . . remote collaboration system . . . . . . . . . . . . . . . . . . . . . . . . . Using TeleAdvisor to remotely assist a person in executing a complex wiring task . . . . . . . . . . . . . . . . . . . . . . . . . . . . . . . . . . AR Directional Interfaces . . . . . . . . . . . . . . . . . . . . . . . . . . Context Compass . . . . . . . . . . . . . . . . . . . . . . . . . . . . . . . World-Aligned Compass . . . . . . . . . . . . . . . . . . . . . . . . . . .
. . . .
10 11 12 13
3.1 3.2 3.3 3.4 3.5 3.6 3.7 3.8 3.9 3.10 3.11
Idea Generation . . . . . . . . . . . . . . . . The Holo Home Assist AR Use Cases . . . . Damage of customers’ home . . . . . . . . . Home claims steps . . . . . . . . . . . . . . Sketch of annotation and marker . . . . . . Sketch of visual compass and measurement Design of visaul Compass . . . . . . . . . . Design of Temporary Annotation . . . . . . Design of Permanent annotation . . . . . . Design of Measurement tool . . . . . . . . . Wireframe of customer’s application . . . .
. . . . . . . . . . .
. . . . . . . . . . .
. . . . . . . . . . .
. . . . . . . . . . .
. . . . . . . . . . .
. . . . . . . . . . .
. . . . . . . . . . .
. . . . . . . . . . .
. . . . . . . . . . .
. . . . . . . . . . .
. . . . . . . . . . .
. . . . . . . . . . .
. . . . . . . . . . .
. . . . . . . . . . .
. . . . . . . . . . .
15 16 18 19 22 23 24 24 25 26 26
4.1 4.2 4.3 4.4 4.5 4.6 4.7 4.8 4.9
Googel Project Tango . . . . . . . . . . . . . . . Hardware Diagram for the Project Tango Tablet Interface of Assessor application prototype . . . . Interface of Customer application prototype . . . System diagram . . . . . . . . . . . . . . . . . . . Compass status . . . . . . . . . . . . . . . . . . . Annotation . . . . . . . . . . . . . . . . . . . . . Measurment . . . . . . . . . . . . . . . . . . . . . Tag with text . . . . . . . . . . . . . . . . . . . .
. . . . . . . . .
. . . . . . . . .
. . . . . . . . .
. . . . . . . . .
. . . . . . . . .
. . . . . . . . .
. . . . . . . . .
. . . . . . . . .
. . . . . . . . .
. . . . . . . . .
. . . . . . . . .
. . . . . . . . .
. . . . . . . . .
. . . . . . . . .
30 31 32 33 33 34 35 36 36
5.1 5.2
Set up of user study . . . . . . . . . . . . . . . . . . . . . . . . . . . . . . 39 Maps used in user study tasks . . . . . . . . . . . . . . . . . . . . . . . . . 40 v
. . . . . . . . . . .
. . . . . . . . . . .
List of Figures 5.3 5.4 5.5 5.6 5.7 5.8 5.9 5.10 5.11 5.12 5.13 5.14
World-fixed Compass . . . . . . . . . . . . . . . . . . . . . . . . . . User-fixed Compass . . . . . . . . . . . . . . . . . . . . . . . . . . . Target markers . . . . . . . . . . . . . . . . . . . . . . . . . . . . . Disturbing markers . . . . . . . . . . . . . . . . . . . . . . . . . . . Example of mark minions . . . . . . . . . . . . . . . . . . . . . . . Boxplot showing SSM scores across conditions . . . . . . . . . . . . Boxplot showing disorientation perception scores across conditions Boxplot showing Perspicuity scores across conditions . . . . . . . . Boxplot showing orientation errors across conditions . . . . . . . . Boxplot of the number of Rewind Times . . . . . . . . . . . . . . . Boxplot of Task Completion Time . . . . . . . . . . . . . . . . . . Boxplot of Task Completion Time . . . . . . . . . . . . . . . . . .
vi . . . . . . . . . . . .
. . . . . . . . . . . .
. . . . . . . . . . . .
. . . . . . . . . . . .
41 42 42 43 43 47 48 49 50 51 51 52
List of Tables 5.1
Ranking result of three conditions . . . . . . . . . . . . . . . . . . . . . . 52
vii
Chapter 1
Introduction Like many industries, insurance companies use new technology to expand their business. The impacts of technology on the insurance industry are manifold, from influencing underwriting decisions to helping streamline business processes, from innovation of new products and lines of business to advances in disaster resilience and recovery [1]. Nowadays, insurance company customers want to be provided with control over their policies and over the claim processes. In order to meet these expectations, insurance companies have not only become more transparent, but also altered how they interact with customers. For example, some insurance companies have created mobile applications that allow customers to make claims, receive quotes and contact agents [22]. In this project we explored how the new technology of Augmented Reality (AR) could be applied in the insurance industry. Augmented Reality refers to technology which superimposes 2D or 3D virtual objects upon the real world in real time. In a commonly accepted definition, researcher Ron Azuma says that Augmented Reality is technology that has three key requirements [7]: • It combines real and virtual content • It is interactive in real time • The virtual content is registered in 3D, and appears fixed in the real world Some companies have already begun to explore how AR could be used in the insurance industry1 , although mostly in sales and marketing. For example, the AXA insurance firm 1
http://bevond.com/blog/5-insurance-companies-that-found-a-novel-way-for-marketing/
1
Chapter 1
2
in Belgium developed an AR marketing campaign that showed a picture of a disaster printed in a magazine, and then showed a video of how the disaster occurred on a customers iPhone when it was placed on top of the print advertisement2 (see Figure 1.1).
Figure 1.1: AXA AR insurance advertisement2
In a similar way, Allianz haunted house AR app allowed people to walk around a custom built house and see an AR view of potential home accidents on an iPad. For example, the real toaster in the house seems to burst into flames and the bathroom sink floods, etc3 .
Figure 1.2: Allianz haunted house AR app 2 3
https://www.youtube.com/watch?v=9ohhf0p8CFM https://www.youtube.com/watch?v=avrvkZaphwo
3
Chapter 1
1.1
3
Research Process
The thesis research followed a classic Interaction Design approach to explore the use of AR for remote insurance. This is an iterative cycle passing through the three stages of (1) Discovery, (2) Design and (3) Evaluation (see Figure 1.3). Discovery involves user needs assessment working closely with insurance assessors and clients to collect user requirements. Once the user needs are understood then the Design phase can be undertaken, which involves interface design and prototyping. The goal of this step is to create a prototype that can be tested in a user evaluation. The third step is to conduct an Evaluation to test the usability of the prototype developed. These three steps are repeated continuously until the prototype meets the user needs and can be reliably demonstrated to a range of different interested parties.
Figure 1.3: Interaction Design Process
1.2
Research Questions and Contribution
In this research we are particularly interested in how AR based remote collaboration could be used to support the insurance claim process. This thesis will explore several interaction methods that could be used in remote AR collaboration systems.
Chapter 1
4
Understating the remote customers’ space in remote collaboration is essential for the assessor to make the right decision. However, in the remote perception situation, people get lost much more easily than being present in the same space. When watching a remote video of a certain location, the user can get disoriented with varying camera movements of a tablet, which will decrease the understanding of the spatial configuration of the remote site. In order to explore whether different types of orientation compass affect on the user’s spatial situation awareness, we evaluated two different 3D orientation cues through a formal user study. The main research questions of this thesis are:
• What interface needs to be applied to enable the remote assessor and customer to collaborate effectively with each other? • Do different visualizations of a compass (World-fixed vs User-fixed) differ in their usability (effectiveness, efficiency and satisfaction)?
The main contribution from this thesis are listed as below:
• A exploration of using AR in insurance industry • The User-centered design process applied for developing interactive systems for insurance industries • Developed an AR system for supporting insurance claim assessments • An evaluation of the performance and subjective preferences of World-fixed compass versus User-fixed compass and without compass in remote collaboration task
Chapter 2
Background 2.1
Augmented Reality
Augmented Reality supplements the real world with virtual (computer-generated) objects that appear to coexist in the same space as the real world [35]. The main goal of an AR system is to enhance reality with digital content in a non-immersive way [8]. The advantage of using AR technology is that virtual gestures or annotations can be overlaid on the real space, which can help a local user or operator to verify the position of the object and reduce the chance of errors. AR interfaces allow users to focus on their task and do not require switching attention from the real world to other screens [6, 12]. The long-term goal of AR researchers is to seamlessly blend together real and virtual worlds [9], and AR has been shown to be useful in a wide variety of application areas such as Education, Engineering and Entertainment. For example, doctors can use AR to show medical data inside the patient [30], game players can fight virtual monsters in the real world [31], architects can see unfinished buildings [34], and students can assemble virtual molecules in the real world [14] (see Figure 2.1). The three characteristics of AR defined by Azuma [7] also specify the technical requirements of an AR system: namely that it has to have a display that can combine real and virtual images, a computer system that can generate interactive graphics that respond to user input in real time, and a tracking system that can find the position of the users’ viewpoint and enable the virtual image to appear fixed in the real world. 5
Chapter 2
Figure 2.1:
2.1.1
6
Typical AR Applications (from the left): Architecture[34], c) Medicine[30]
a) Gaming[31], b)
Devices for AR
In terms of display, most AR experiences are typically delivered on either a head mounted display or handheld device. Head mounted displays can be optical see-through, allowing the user to see the real world with their natural eyes, or video see-through in which the user views a live video view of the real world with graphics overlay. Handheld devices, such as mobile phones and tablets, use support video see-through AR where the user views the real world through the live camera view shown on the handheld screen (see Figure 2.2).
Figure 2.2: Different display types for Augmented Reality (from the left) : a) Optical see-through display1 , b) Handheld AR display2
2.1.2
Computer System
In order to create the appearance that the virtual content shown in the AR display is fixed in the virtual world, it is necessary to track the users viewpoint and update the graphics as the user moves. There are many techniques for AR tracking, but the most 1 2
http://www.whathifi.com/news/epson-wearables-launch-moverio-bt-200-smart-glasses http://eyetour.com/blog/tag/layar/
Chapter 2
7
common are using GPS and compass tracking for outdoor AR, and computer vision based tracking for indoor AR (see Figure 2.3). Computer vision tracking can be performed from visual markers in the scene [37], or from naturally occurring visual features [39]. Both types of tracking can run in real time on mobile devices.
Figure 2.3: Computer vision techniques for mobile AR(from the left): a) Marker based tracking[37], b) Markerless tracking[39]
2.2
Video conferencing
First commercialized in the 1960s, video conferencing is widely used today in daily life for chatting with remote family or friends, meeting with business partners or connecting with experts. Audio and video conferencing tools can provide remote technical assistance. However, software such as Skype is typically designed for supporting face-to-face communication and not task space collaboration, where the goal is showing the user’s workspace [18]. In complex repair tasks it is more important to see what the user is trying to do, rather than showing their face. It has been found that when streaming video to a remote expert, they are able to provide more effective and proactive support to a local worker who is in need of professional advice [27]. Wearable computers with wireless networking allow users to have access to shared documents and collaborative applications anywhere in the workplace [32]. Previous research has shown that using a head mounted display with a camera attached can allow a remote expert to see what a worker is doing and
Chapter 2
8
provide effective support [15]. Figure 2.4 shows a typical head mounted display (HMD) and camera system for supporting remote collaboration.
Figure 2.4: Using a head mounted display for task space collaboration[15]
However, there are limitations of traditional video conferencing when it is used to share experience and support task space conferencing. One of these is failure to create a closer feeling of connectedness because the users cannot see each other’s faces. Another limitation is that it is hard to share gesture cues, which is important for remote users’ instructions [23]. It can also be difficult for the remote user to explore the local users space separately from where they are looking. Using Augmented Reality can overcome some of these limitations by directly annotating the workers view with virtual cues [26].
2.3
AR in Remote Collaboration
Previous research at the HIT Lab NZ has explored various aspects of using AR to improve remote collaboration. It has been shown that sharing video views of the real world [19], providing remote virtual pointing [12], using spatial audio [9], and shared 3D models overlaid on real objects [8] can all aid remote collaboration. Billinghurst and Kato [9] gave five reasons that made AR interfaces highly desirable for collaboration:
• Seamless interaction between real and virtual environments • The ability to enhance reality • The presence of spatial cues for face-to-face and remote collaboration • Support of a tangible interface metaphor
Chapter 2
9
• The ability to transition smoothly between reality and virtuality
Alem et al. [6] mentioned that one key benefit of the use of AR is that the attention of the operator is on the task, not on the system delivering the help. This means that the AR based collaboration system allows users to stay on task and there is no need to switch attention to the system that is delivering the help. AR also provides the presence of spatial cues [9], and can enhance spatial information with virtual objects. Applying AR technology for remote collaboration allows the expert to provide help by direct pointing, gesturing and annotations [5]. For example, if a novice user needs to operate a complex machine, but does not have the skills required to control it, an expert might be connected in a remote location to provide professional guidance through remote collaboration system (see Figure 2.5) [20].
Figure 2.5: Remote collaboration system: user points out an element in the environment (here: a car’s engine bay) by drawing an outline around it. The annotation is world-stabilized and displayed in AR to the local user (bottom left), who is holding a tablet [16].
Several studies have been done on the application of remote collaboration in real-world scenarios. For example, a medical interactive AR system has been developed for remote surgical assistance. The surgeon at the remote site can indicate a region of interest (ROI) by manually drawing on streaming images which were captured by the camera at the
Chapter 2
10
local site. The ROI and the anatomical information of the CT images can be rendered on the captured images, overlaid on the patient and projected onto a head-mounted display of the local surgeon, providing an AR visualization [12]. Another example of a novel solution designed to support remote assistance tasks is TeleAdvisor (see Figure 2.6). It consists of a video camera and a small projector mounted at the end of a tele-operated robotic arm. This enables a remote helper to view and interact with the workers’ workspace. It also provides the worker with a hands-free transportable device to be placed anywhere in his or her environment [19].
Figure 2.6: Using TeleAdvisor to remotely assist a person in executing a complex wiring task [15]
In order to support spatial referencing, all of these systems assume a stationary view of local user, as the virtual annotations will lose their referents otherwise. However there are some previous studies of remote collaboration that have solved this problem using mobile AR systems, one example is Remote Mobile Tele-assistance. Remote Mobile Tele-assistance (ReMoTe) is a remote guiding system developed for the mining industry [6]. It was designed to support the mobility aspect of maintenance workers. The expert, when remotely guiding a worker, uses his/her hands not only to point to a remote location, but also to demonstrate how to perform a specific manual procedure [6]. Gauglitz et al. [17] have developed a handheld AR system that supports an augmented shared visual space for mobile remote collaboration on physical tasks.
Chapter 2
11
The remote user can explore the scene independently of the local users’ current camera position and can communicate via spatial annotations in AR. Their system does not require any special equipment and preparation of the environment. They use computer vision-based tracking and modeling to support world-stabilized annotations and virtual camera movements.
2.4
Orientation Compass
Compared with being present in the same space, obtaining an accurate perception of a remote space through video or other media is difficult, and user performance in remote navigation can be hampered [38]. There are several factors that affect the understanding of remote site, such as low image quality, time lag, narrow field of view (FOV), disparate point of view (POV), and loss of reference [13]. Chadwick and Pazuchanic [11] found in their research that people can get disorientated in both direct and remote perception situations. However in the remote perception situation, people get lost easier, which hampers their performance.
(a) Perspective Compass
(c) Left/Right Arrow
(b) Horizontal Compass
(d) A cross-section of a waist showing the hip bone and the configuration of the haptic belt’s actuators
Figure 2.7: AR Directional Interfaces[10]
Chapter 2
12
Many studies investigated methods for decreasing disorientation and helping people to orient themselves in remote space. Buchmann et al. [10] compared several AR directional interfaces and found that circular compasses provide the most efficient orientation cues compared with perspective compass, horizontal compass, arrows or a haptic belt(see Figure 2.7). People have a lot of experience with compasses as they have been used for centuries to aid navigation [33]. Therefore, it should not be surprising that multiple compass visualizations were employed in wearable computing. One of the visual compass models is the Context Compass, which is in the form of a linear bar (see Figure 2.8) displayed on top of a Head-Mounted display and showing the forward direction [4]. Context Compass was shown to be a promising technique for assessing a context object, and was found to be intuitive and easy to learn [29].
Figure 2.8: Context Compass[4]
Another example is the World-Aligned Compass, as shown in Figure 2.9. It is a top-down two dimensional compass which is displayed flat onto the screen space as if seen from a bird’s eye view. Curtis and Julie[21] have compared this top-down 2D compass with a 3D in-world world-aligned compass. Their results show that the former facilitates more performance in metric judgment, task situational awareness, and has higher perceived ease of use than the latter. On the other hand, the latter yields faster performance for general navigation task than the former.
2.5
Summary
Augmented Reality technology is increasingly used in multiple devices. It was shown to help with remote collaboration and augment the experience offered by traditional video conferencing in multiple fields. However, due to the special requirements of the assessment procedure, there are several limitations hampering its usefulness for the insurance industry’s remote claim assessments. Previous work also shows that user performance in remote perception situations can be different from being present in the same space. Several solutions were previously
Chapter 2
13
Figure 2.9: World-Aligned Compass
proposed to solve that issue, one of which is 3D orientation compass. However, they lack the evaluation of the different effect of compass on local users’ spatial perception.
Chapter 3
Design Process This chapter describes the idea generation process and user needs analysis steps. It presents how the final concept was generated and how the interfaces of the application were designed.
3.1 3.1.1
Idea Generation Brainstorming
The idea generation phase started with a brainstorming around “Applications of AR to the insurance industry” in the first workshop on the 4th of May, 2015. Before the brainstorming session, Prof. Mark Billinghurst shared his valuable knowledge and experience about Augmented Reality, and other researchers and students of HIT Lab NZ demonstrated their projects’ prototypes. The staff from Suncorp Insurance
1
also gave
an overview of the insurance industry. This communication between two completely different fields gave us the chance to understand each other on a deeper level. A huge number of ideas were generated in the brainstorm session(see Figure 3.1), and at the end of the workshop we identified five key areas in the insurance business that could benefit from the introduction of AR 1
http://www.suncorp.com.au/insurance/
14
Chapter 3
15
Figure 3.1: Idea Generation
(1) Claim Assessing. In current procedure, after being notified about the claim, an assessor will contact the customer to confirm assessment time and verify the damage through field inspection. It would save time and cost for both customer and insurance assessor if remote assessment was enabled after a claim. (2) Resilience/Policy auditing. Currently insurance companies rely on customers providing accurate information when they set up the policy over the phone or Internet. If the customer adds more items in the home or changes the home in some way, it can be difficult to change the insurance policy, or the customer may forget to update the policy contents. Underinsurance could be a potential issue and occurs often. A proof of ownership could enable the visibility of the value of belongings and determine how much insurance customers should have. Resilience/Policy auditing system could allow customers to immediately update their policy after buying new items in case under-insurance occurs. (3) Hazard Warnings. In case of forecasted weather events such as a hurricane or flooding, the system could warn users to prepare for them ahead of time. It could also enable customers to visualize the risk events pose for their assets, forecast potential impacts, and subsequently provide advice on how to militate these impacts e.g. clear yard of loose items during severe storms. (4) Home Wellbeing. Using an Internet of Things approach, many homes are having sensors installed that can monitor the environmental conditions or the building itself. However, it can be difficult to present the information to the user in a way that is easily understandable. Home Wellbeing system would be an AR application
Chapter 3
16
that could be used to show the homeowner the state of the sensors mounted in the home, and also could provide alerts and enable real-time assistance from an agent or expert. (5) DIY Home Assistance. In the DIY Home Assist use scenario, a customer could receive support from an expert through the use of Head-mounted devices to help them do a range of repairs at home. A virtual handyman, who is a remote expert, could use an AR system to identify the problems without being required to travel in person to a customers house. They could also instruct the homeowner how to fix the problem by him/herself.
These ideas were connected together in the context of a Holo Home Assist service that could improve the homeowners experience with their insurance company (See Figure 3.2).
Figure 3.2: The Holo Home Assist AR Use Cases
Although all five of these areas are interesting, for the limited scope of the thesis research we decided to explore the problem of claims assessment in-depth, and to explore how AR technology and remote collaboration could be used to improve this process.
Chapter 3
3.2
17
Needs analysis
The aim of the needs analysis is to gain a deeper understanding of target user and the context in which system will be used. As described before, in this project I focused on the claims assessment process, thus the target user group are insurance home assessors, who are considered as remote assistants, and their customers, who are considered as primary users. The context is the customer’s home with particular damage. Field observation and home claims journeys were adapted in this phase.
3.2.1
Findings from Field Observation
During the visit to several customers’ claimed sites, I had a chance to observe assessors’ and customers’ actions in real cases. Even though every case was different from each other (see Figure 3.3) and the damage conditions were of a great variety, for example carpet were ripped by family pet, damage of ceiling caused by Seepage of upstairs’ bathroom, damage of kitchen counter caused by leakage, and part of eave was broken caused by electric wire fall down, the actions and steps taken by assessor and customer are similar. The findings are summarized below: Key actions of an assessor: • Safety inspection • Damage assessment • Check policy criteria, make sure the damage will be covered • Measure damage area, normally assessor can use tape ruler but sometimes it is hard to reach the damage area like ceiling or eave • Create scope of works • Capture and upload photos • Explain next steps to customer • Determine if specialists are required • Authorise job and notify a repairer
Chapter 3
18
Figure 3.3: Home damage of customers
Key actions of a customer:
• Showing assessor the damage • Providing important information of damage • Enquiring about next steps and assessment decision • Signing a confirmation form after assessment
Informal interviews with an assessor were done during the field observation, which helped to provide additional information that had not been visually found. From this interview, it was found that the Claims manager decides if activity needs to go to assessing team. Once the claims manager team gets a report, they need to action it within 3-4 days, but in reality this process could take several weeks. Actually, unlike observed in site inspection, assessors do not draw up floor plans very often, they are relying on photographs to build a scope of work. Frequentlythere is a gap between the insurance policy cover range and customer expectation, and it is difficult to do policy interpretation for customer.
Chapter 3
19
Based on field observation and informal interviews, the following problems were found: Gaps in assessor needs not being met:
• Timeliness. Assessor is likely to deal with claims promptly. However, travel from the office to the customers’ home and misinterpretation can lead to more time taken. • Correct and clear information about the damage. In many cases misinterpreting the severity of damage can lead to a safety risk for the customer, and interpreting customers’ descriptions can lead to unclear information • Various tools employed can lead to inconsistent quality of work.
3.2.2
Home Claims Customer Journey Analysis
From the field observation it appears that customers show their patience and appreciation to the assessor’s work, and agree with assessment decision and results. However, assessment is just one part of a home claim procedure (see Figure 3.4) and the assessor is only involved in the assessment and completion parts, but customers would need to go through all of the steps.
Figure 3.4: Home claims steps
In order to gather more information regarding customers’ requirements and explore deeper from the customers point of view, I analysed the home claims customer journey form which was provided by Suncorp Insurance staff. The key findings are summarized below: Gaps in customers needs not being met:
Chapter 3
20
• Customers need expert advice after damage, when they contact insurance staff in lodgement, as well as during the claim handling steps as they are not qualified enough. “Oh no, what am I going to do? ” “Is it really safe to leave the damage as it is until the Assessor/Repairer arrives? ” “This is so confusing” • Often lack of clear process is provided at lodgement stage. “Why can’t someone come out straight away? ” “Why can’t I speak to an Assessor now? ” • Timeliness. Claim processing time could be drawn out, or not meet customer expectations. “I hope the repairs can be completed quickly” “Will the repairs be completed promptly? ” “This is taking too long” • Promises met. This is dependent on the customers’ expectation levels. “I hope he knows how I want it to look ” “That’s not how I expected it to look ”
3.2.3
Problem Definition
Based on the needs analysis, reaching the outcome of a claim quickly is one of the biggest expectations that has been reported throughout the whole process. However, the current process from lodgement to claim resolution is much slower than customers’ expectations. It is especially pronounce in the emergency claims when reaching insurance staff is urgent. Therefore, the first major problem is how to cut the time required in the early stages of the claim process. The second major problem, reported in several stages of the claim process as a gap in user and assessor needs, is the lack of clear and detailed information before the assessor can complete the inspection in the field. So in conclusion, it is
Chapter 3
21
important to improve the communication between assessor, specialist and customer, and allow them to express themselves accurately. Basic video call functionality can help to solve the first major problem described above, and with limited extent the second major problem. During the site visits in which I took part with a claim assessor, it became clear that in a significant number of cases (6 out of 8 cases), a physical presence of an assessor on-site is not required. For the claims where special equipment is not required, an assessor could perform the assessment using a video call, which would reduce the time required for assessment by removing the need for the assessor to commute to the site. The time saved on transportation would allow an assessor to perform more assessments each day and reduce the time taken between lodgement and claim resolution. However, video call provides only a limited support for the second major problem of the current process —— the lack of clear and detailed information before the assessor can inspect the field. Therefore design of the interface should focus on the second problem, and the goal of interface design is as the following:
• The customer should initiate video calls with assessor after damage has happened. • Since it is crucial that the customer and claim assessor can express themselves accurately, they need tools that could help to clarify the exact area that is being discussed. • As the customer and claim assessor have different needs to be met, the interface for them should not be the same. • The customer should be provided with simple interfaces. • The assessor should be provided suitable tools to create scope of customer’s site and enough information about customer and damage.
3.3
Prototype Concept
Based on previous idea generation and the needs analysis, a remote Augmented Reality collaboration system was envisaged. It combined basic video call system with Augmented Reality features. The customer will be able to initiate video calls with an
Chapter 3
22
assessor and show the assessor his site through the video feed. During the video call they can also communicate using voice. In addition, they will be able to use an AR interface to communicate their clear and detailed information. In this phase, the design idea and concept were converted to a clear and definite user interface design. The system wireframe was evaluated by assessors and Suncorp staff to determine whether the remote collaboration system and its interface could provide benefit for claim assessment and find out what functionality needs to be improved. During the wireframe evaluation the assessor and staff provided many valuable suggestions which were applied in the application development.
3.3.1
UI Specification
This system provides AR annotation and text marker functionality for both customer and assessor (or other expert). It should support user drawing on the screen to point out specific objects in 3D environment, and these annotations should track original objects (see yellow annotation in Figure 3.5). In order to remind the user about important information, the marker can be put on an object to enable users to add text on it (see the red marker in Figure 3.5).
Figure 3.5: Sketch of annotation and marker
Chapter 3
23
For the assessor there are some additional features. One of them is a visual compass (see blue annotation in Figure 3.6). Disorientation of a remote site happens commonly in video call which is caused by the limited range of remote user’s camera and their motions being fast and unpredictable. Thus a visual compass is needed to indicate the remote customer’s view angle. Another feature is the measurement tool (see green annotation in Figure 3.6), since the assessor needs to know the scale of damage for further work. This feature will support the assessor to measure distance or length by a virtual AR tool. The last special feature is a screenshot, which can replace the assessor’s camera in the field inspection and helps record essential information about the damage.
Figure 3.6: Sketch of visual compass and measurement
3.3.2
Wireframe
A wireframe was created to describe the interface of this system that I aimed to build. It was developed in UXPin 2 , which is a an online UX design and wireframing tool. The applications designed for customers and assessors are different as described below. In the assessor’s application there are six features:
(1) Visual Compass (see Figure 3.7). The compass icon shows the angle of the customers view. When the local customer’s camera aims at the front wall, the insurance staff 2
https://www.uxpin.com/
Chapter 3
24
can set the starting direction by clicking on the orientation icon. It allows the insurance staff to have a better orientation in the space.
Figure 3.7: Design of visaul Compass
(2) Temporary annotation (see Figure 3.8). This is done by drawing a freehand line on the image. It is used to point to the specific area that is being discussed and the annotation will automatically disappear after 2 seconds.
Figure 3.8: Design of Temporary Annotation
(3) Permanent annotation. It is used to select a spot that will require future action and write reminders. There are 3 tools in permanent annotation: freehand drawing,
Chapter 3
25
label and eraser. Freehand drawing works the same as the temporary annotation, except that it remains permanently. The label can be placed anywhere on the screen and the user can type text in it (see figure 3.9). The eraser is used to remove the permanent annotations.
Figure 3.9: Design of Permanent annotation ——label
(4) Screenshot. This tool allows the insurance staff to take a screenshot of the current view. (5) Measurement tool (see Figure 3.10). In the original design I developed the application on a normal tablet, thus it needs to input customer’s height first to get the reference length and needs close cooperation between the customer and assessor. The remote customer needs to aim his camera at the target point, then the local assessor clicks on the screen to mark the blue pin on the target point, repeating the previous step to set the second blue pin, then the measurement between two blue pins will be generated. However, we decided to use Google Project Tango3 as the customer device, which would allow users to simply point on the screen and the measurement will be generated automatically using the sensors. (6) Customer Information. This function was designed to provide background information for the assessor. 3
https://www.google.com/atap/project-tango/
Chapter 3
26
Figure 3.10: Design of Measurement tool
For the customer’s application (see Figure 3.11) only the Temporary and Permanent Annotation features were selected for the purpose of simplicity, and their functions are the same as described in the assessor’s application wireframe. A video of the assessor’s face was added in order to make the customer feel reassured. The quit function allows the customer to finish the video call whenever they wish.
Figure 3.11: Wireframe of customer’s application
Chapter 3
3.3.3
27
Evaluation of the Wireframe
In order to evaluate the Remote Claims Assistant mock up and gain thoughts and ideas on the practicality of the system, we conducted a video call meeting on the 20th of October, 2016. The research team from HIT Lab NZ and the insurance company staff including assessors met online via Microsoft Lync 4 . The following feedback about the system interface was provided:
• The value of the tool is to see the damage before going to customers’ home (e.g. floor or wall). • 80% of quick turn around claims will get benefit, while 20% complex cases will still need visiting physically. • Customers being able to see the faces of the staff on their screen is good for customer experience. • Free hand annotation is the favourite function. • Instead of putting the whole text in the tag, use a symbol (number or letter) to represent the text. Comments are then on the side. • Compasses should also give absolute orientations (North East South West). • Screenshots can be shared back to the customer (e.g. e-mail) as a confirmation of what has been looked at and discussed. • It would be good to be able to make changes to the annotations on the screenshot. • Measurement icons should be crosshairs rather than pins. • It would be good to enable video recording.
Based on their feedback, the features of application were modified. For example, Using a symbol to represent the text then showing comments on the side of the screen rather than putting the whole text in the tag, redesign the orientation compass, redesign the measurement tool,and add the video recording function. 4
https://products.office.com/en-us/skype-for-business/online-meetings
Chapter 3
3.4
28
Summary
This chapter described the process that was undertaken to design the remote collaboration system, especially the process of how I arrived at the final design of the interface. As described, the target users are insurance customers and claim assessors who need to have clear and timely communication. Based on a series of user needs analysis I sketched out a prototype system which was then evaluated by assessors and insurance company staff. The interface of the final application prototype was modified based on their feedback. The next section will talk about the implementation and prototype development process.
Chapter 4
Implementation and Prototype In this chapter we describe the process of implementing a working and testable prototype that is robust enough to be used in user testing and user evaluation. The system created was consistent with the wireframe design proposed in the previous chapter.
4.1
Hardware
As discussed in the previous chapter, the interface designs for assessors and customers are different according to their specific needs and distinct user characteristic. Not only are their environments to use the application different, the hardware for them could also be different. For a customer, as they need to show the damage which might occur anywhere at home, a mobile hand held device (HHD) will be the most appropriate. For the assessor, most of the time they will work in the office, where stable and powerful computers like laptops or desktops are fit for use.
4.1.1
Google Project Tango
There are many choices available for mobile hand held devices, and smart phones and tablets are the most popular amongst the customers. Initially, we considered using the Samsung Galaxy Tab 8.9 as the customer device. This tablet has an accelerometer and an gyroscope sensor which can be applied to detect the orientation of the device. However, its functionality is still limited like most tablets on the market, and it is difficult 29
Chapter 4
30
to support fluent and stable tracking of real object in 3D environment. Owing to the need to use robust area learning and stable motion tracking, we decided to use a tablet with special spatial sensors —— Google Project Tango1 (see figure 4.1) as the customer device.
Figure 4.1: Googel Project Tango1
Project Tango is integrated with advanced vision sensors (see figure 4.2) including a Motion Tracking Camera, 3D depth sensing and Barometer sensors with common GPS, Accelerometer and Gyroscope sensors. It brings a new kind of spatial perception to the Android device platform by adding advanced computer vision, image processing and motion sensors. Even though Project Tango is mainly for developers, the world’s first Project Tango Smartphone 2 will launch in Summer 2016, which will allow customers to easily access the technology. There are three advanced technologies that made Project Tango a powerful and special tablet: (1) Motion Tracking. It allows the device to understand its position and orientation by using custom sensors. This gives the user real-time information about the 3D motion of a device. (2) Depth Perception. Project Tango devices have 3D sensors that measure the distance from a device to objects in the real world. Depth sensors help users to understand the shape of the world around them. 1 2
https://www.google.com/atap/project-tango/hardware/ http://www.lenovo.com/projecttango/
Chapter 4
31
Figure 4.2: Hardware Diagram for the Project Tango Tablet [2]
(3) Area Learning. Project Tango devices can use visual cues to help recognize the world around them. They can self-correct errors in motion tracking and relocalize in areas they have seen before.
4.1.2
Laptop
The assessor device used in this project is a common laptop with Windows 10 64-bit operating system, 4GB RAM, 2.4GHz CPU. It has a 1366 x 768 pixel resolution screen and an integrated 1MP front camara 3 . With this condition, we can directly run a developed application which is designed for the assessor and also run the application server to support data processing between the Project Tango tablet and laptop.
4.2
Software
After all hardware components for this project were selected and available to use, the assessor and customer applications had to be developed. The prototype application consisted of three parts. One is a Windows-based application which was built for the 3
http://shop.lenovo.com/us/en/laptops/lenovo/u-series/u430p/
Chapter 4
32
assessor. The second part is an Android platform AR application for the insurance customer. The last section is a third-party software, named Mobizen 4 , which enables streaming of the Project Tango tablet screen to laptop and enable video recording. Following the prototype concept described in the previous chapter, the final features of the laptop and tablet application have been defined: Assessor application (see figure 4.3)
• Using 3D orientation compass to show the remote customer’s viewpoint. • Free-hand drawing AR annotation. It can be used to help the user understand where is the particular area/point that they are talking about in the video call. • Adding tags on objects and note details about this tag, it is used to write reminders. • Obtaining measurement by clicking target points on the screen, it is used to get the dimensions of real world objects. • Using screenshot to save the current screen view as a picture. • Using Mobizen functionality to record video. • Capturing assessors video and input data, then send these data to the server.
Figure 4.3: Interface of Assessor application prototype
Customer Apllication (see figure 4.4) 4
https://www.mobizen.com/?locale=en
Chapter 4
33
• Showing assessor’s live video. • Enable drawing AR annotation. • Enable adding and editing AR tag.
Figure 4.4: Interface of Customer application prototype
One of the most important parts of the development of these application is sharing the video and input data stream between the two applications. As shown in figure 4.5, the customer input data and environment sensing data was captured by Project Tango. The tablet program then processes them and generates AR annotation on the screen. A third-party software Mobizen was used for streaming the screen to laptop via a Wi-Fi router. The laptop application captured its input and assessor face video, in this site a server application was used to send these data to the tablet via wireless network.
Figure 4.5: System diagram
Chapter 4
4.2.1
34
IDE and SDK
All the software development in this project was done using Unity 3D. Unity 3D
5
is a
popular and flexible development platform that can be used for creating 2D or 3D games and interactive applications targeted for multiple platforms. The availability of plugins for AR and VR makes it the most desirable game engine for making the development of sophisticated systems simple. The Project Tango Software Development Kit (SDK) for Unity was used in the application development procedure which includes sample files, packaged APIs, and library files. This SDK provides developers functionality and APIs that Unity projects can call to access the Project Tango backend[3]. Using this SDK made the prototype development faster and easier.
4.2.2
Interaction
3D orientation compass As shown in figure 4.3, the 3D orientation compass displayed at the center top of the screen, like other functional buttons, is a part of the application UI. It is a visual cue updated automatically based on the tracking sensor on the device. The ”Front”, ”Back”, ”Left” and ”Right” text are fixed in the screen space and indicate the 4 directions of the room or space. The arrow rotates when the remote customer turns and changes his direction. In addition to indicating the bearing (left-right rotating), the arrow can also show the pitch (turn up or turn down) of the remote customer’s tablet (see figure 4.6 ).
Figure 4.6: Compass status(Left: looking up, Right: looing down) 5
https://unity3d.com
Chapter 4
35
Annotation Annotation is done by drawing a freehand line on the screen (figure 4.7). The laptop application user could draw by pressing the button and dragging. The tablet user could draw by touching the screen. The annotations are spatially attached to real world objects so that they remain fixed at the location of interest, even when the viewer moves around with the tablet.
Figure 4.7: Annotation
Measurement When local and remote users need to measure the size of a target area or a particular item, they simply need to click the target points one by one. The target points will then be marked with red pins, and the first target point to the last will be shown (see figure 4.8). With the aid of Project Tango’s point cloud depth perception technology and point cloud function, the pins placed by the user will be aligned to the real objects. The software will find the closest physical point after capturing a (x,y) touch position and convert this position into the physical point’s position. Tag The original tag design was like a sticky note. The difference between the real and virtual sticky notes is that when we write a real sticky note, the user first writes the note then sticks the note on a certain location. However, the virtual sticky note needs to be first tagged on a target object before text can be added to it. As an assessor suggested in the wireframe evaluation meeting, instead of putting text in the tag, using
Chapter 4
36
Figure 4.8: Measurment
a symbol to represent the text, then showing comments on the side of the screen could make screen less cluttered. Thus, our final design has adopted this idea. A user can tap or click an object to put a tag with a name. Tapping on a tag allows the user to add text. This text will be displayed at the bottom of the screen (see figure 4.9).
Figure 4.9: Tag with text
Chapter 4
4.3
37
Summary
This chapter described the process that I undertook in implementing a testable prototype of the system for remote claim assessment and the specification of that prototype. Project Tango device and a laptop were used as the hardware. On the software side, a Windows-based application was built for an assessor and Android platform AR application for insurance customer. The communication between the customer device and the assessors laptop was achieved using the third-party software Mobizen. These components enabled me to create a prototype of a system that included a 3D orientation compass, annotation tool, measurement tool and tagging functionality.
Chapter 5
User Evaluation This chapter describes an experimental user study comparing two different orientation compasses. The aim, design and results analysis of this user study are explained.
5.1
Evaluation Goal
When watching a remote video of a certain location, the user can get disoriented with varying camera movements of a tablet, which will decrease the understanding of the spatial configuration of the remote site. The purpose of this experiment is to evaluate the effects of different 3D orientation cues on the users experience and understanding of a remote environment when using a video conferencing application. The results of this study will be used to determine the design of the orientation compass in prototype application, and also answer the research questions of this thesis.
5.2
Research Questions
As described in section 2.4, the differences between the World-fixed compass and the User-fixed compass on a remote collaboration system have never been previously evaluated. Both orientation compasses have been used to enhance remote perception, and they have their own advantages and disadvantages when compared to other types of orientation compass.
38
Chapter 5
39
In order to know the difference between the World-fixed compass and the User-Fixed compass and if there is a difference between these two interfaces and one without an orientation compass, the following research questions were set: • RQ1: Do different types of compasses affect the user’s spatial situation awareness? • RQ2: Do different types of compasses affect the user’s disorientation? • RQ3: Do different types of compasses affect the user’s ease of use? • RQ4: Do different types of compasses affect the user’s efficiency and effectiveness?
5.3 5.3.1
User study design Environment
This user study was set up in a controlled lab environment at the HIT Lab NZ (see figure 5.1). One laptop and an extension monitor were set to display the videos and an online questionnaire page.
Figure 5.1: Set up of user study
A file folder was used to hang the front map and set in front of the participant. A white board was used to hang the back map at an arm length distance from the back of the participant. There was a camera behind the participant to record their performance.
Chapter 5
40
There were Five walls (front, top, floor, left and right wall) shown in the front map and one wall (Back wall) drawn on the back map (see figure 5.2). The combination of front and back map represented is aimed to mock up a 3D space and imitate the perception in a real space. We also used a square space outside the room to have a practice section
(a) Front
maps
(b) Back map
Figure 5.2: Maps used in user study tasks
as a requirement in the study. Ten markers and two maps were hung on the wall of this space.
5.3.2
Materials
• Laptop • Monitor • File folder • Camera and tripod • One table • One chair
5.3.3
Conditions
There were three conditions in this experiment as listed below and the order of conditions had been counter-balanced.
Chapter 5
41
No compass. Like a normal video call system, there are no orientation cues to indicate remote user’s position or orientation. This is the baseline condition. World-Fixed Compass. The direction text was tagged and fixed in the screen space and the arrow icon rotated as the remote user turned (Figure 5.3).
(a) Forward facing—North
(c) Downward—East
(b) Forward facing—Southwest
(d) Upward—West
Figure 5.3: World-fixed Compass
User-Fixed Compass. The arrow icon remained pointing towards the front side, and the direction text rotated to show which direction the remote user was looking at (Figure 5.4).
5.3.4
Experimental Procedure
The experiment was held in the following procedure: (1) Introduce the aim and process of experiment to participants. In this part, a participant was shown the target markers (see figure 5.5) which they need to mark on the map and disturbing markers which they need to ignore (see figure 5.6) during the task.
Chapter 5
42
(a) Forward facing—East
(b) Forward facing—Northeast
(c) Downward—Northwest
(d) Upward—East
Figure 5.4: User-fixed Compass
Figure 5.5: Target markers
(2) Participant read the information sheet and signed the consent form. (3) Participant filled in the pre-task questionnaire. (4) A practice session was held to let participants know how to use the map, what the map meant and how to mark objects on the map.
Chapter 5
43
Figure 5.6: Disturbing markers
• Maps: The front map was mounted on the front wall of the practice space and the back map was mounted on the back wall of the practice space. • Mark Minions: The participants were asked to find all target markers (Minions) in the space and mark their location, orientation and the number of Minions on the map. Figure 5.7 shows an example of marking minions on the map.
Figure 5.7: Example of mark minions
(5) Experimental task. In this session the participant was asked to sit in front of a laptop and watch a video of a remote space with different orientation cues depending on the condition which was recorded prior to the user study, find the minions in the video and mark them on the maps. Rewinding and pausing the video was allowed, which was later counted through video analysis. After finishing the task, the participant was asked
Chapter 5
44
to fill a per-task questionnaire. As there were three different conditions and their tasks are the same, participants needed to repeat those steps three times. (6) After the participant finished all of the experimental tasks in the three conditions, the participant was asked to answer a questionnaire asking for feedback on the overall study. The whole procedure took approximately 30-40 minutes. Participants received a $ 5 voucher for time compensation.
5.3.5 5.3.5.1
Measures Pre-experiment questionnaire
The Pre-experiment questionnaire collected demographic about the participants before the task. In this study, the questionnaire gave an idea about the participant’s experience with Augmented Reality, video call and their ability to comprehend visual spatial imagery (VPI). As a part of the MEC Spatial Presence Questionnaire (MEC-SPQ) [36], the VPI scales were validated together with other scales which belong to MEC-SPQ.
5.3.5.2
Per-condition questionnaire
After completing the task in each condition, the participants were asked to answer the per-condition questionnaire. The questionnaire included the following components: Spatial situation model Like VPI scales, the Spatial situation model (SSM) scale is also a part of the MEC Spatial Presence Questionnaire [36]. It measures spatial situation awareness on a 5 point Likert scale (1: totally disagree ∼ 5: totally agree). Disorientation perception This scale was designed to measure the degree to which participants felt disoriented. It was a 5 point Likert scale (1: totally disagree ∼ 5: totally agree). It included the following 4 items: “It was easy to know the positions of all the walls”, “I felt disoriented during the task”, “I didn’t need to guess the location of markers (minions)”, and “It
Chapter 5
45
was easy to know which direction I was looking at”. Higher scores represent lesser disorientation. Perspicuity The perspicuity scale is part of the User Experience Questionnaire (UEQ)
1
which was
designed and validated by Laugwitz et al. [28] and is a quick assessment for the user experience of interactive products. It is a seven stage semantic differential scale. The perspicuity scale is designed to answer these questions: Is it easy to get familiar with the product? Is it easy to learn how to use the product?
5.3.5.3
Post-experiment questionnaire
At the end of the experiment, the participant was asked to rank three conditions and answer several questions about what they most liked or disliked regarding the conditions.
5.3.5.4
Performance Measures
The task completion time, number of times rewinding the video, location error, and orientation error were measured in this section.
• Task completion time: This is the time measured from the when the participant starts the video until he/she declared the task completed and measured in a unobtrusive way with a video recorder. • Number of rewind times: How many times the participant rewind the video. • Location error: How many times the participant marked the Minions in the wrong position (either on the wrong wall or on the wrong quadrant). • Orientation error: How many times the participant marked the Minions in wrong direction (only four directions up/down/left/right were considered). 1
http://www.ueq-online.org/
Chapter 5
5.3.6
46
Participants
In this study participants were recruited at the University of Canterbury by using posters advertised around the campus, and all the participants were students from the university. They were offered a $5 voucher for their participation. Out of the 20 participants, 6 were female and 14 were male. Their age ranged from 23 to 48 years old with a mean age of 30.75 years. Based on the pre-experiment questionnaire analysis, 18 out 20 participants use a video call system at least once per month. Fourteen out of 20 participants use a mobile navigation application at least once per week. 11 out of 20 participants use an AR application at least once per month. However, fewer participants regularly use a compass with 4 participants having no prior experience with it and 10 participants using it on yearly basis. Moreover, most participants considered themselves as having a slightly above average ability with visual spatial imagery (M = 3.60, SD = 0.62).
5.4
Results
Before the detailed analysis each measurement, the normality of data was tested. The results show that the data of Spatial Situation Model, Disorientation and Perspicuity were normally distributed based on the Kolmogorov-Smirnov test and visual data analysis. Therefore, for these questionnaires I conducted one-way repeated measures analysis of variance (ANOVA). However, the data of user performance (task completion time, number of rewind times, location errors and orientation errors) was not normally distributed based on the Kolmogorov-Smirnov test and visual data analysis. Therefore, this data was analyzed using Friedman test.
5.4.1
Spatial situation awareness
The perceived spatial situation of the three conditions was measured by the Spatial Situation Model. The scale had high reliability - Cronbach’s alpha = 0.882. Figure 5.8 shows the summary of the result with SSM. The conditions with the higher scores in SSM represent that the participant got better spatial situation awareness. The
Chapter 5
47
normality testing result showed that the SSM mean of the three conditions were normally distributed. We then conducted a one-way repeated measures ANOVA comparing the mean scores. The analysis showed that there was a overall significant difference between the conditions [F (2, 38) = 3.31, p = 0.047]. Post-hoc tests were done with the Bonferroni correction to discover which specific means differed. There was no significant difference found between the World-fixed compass and User-fixed compass scores(p = 1.000), as well as between the no compass and User-fixed compass(p = 0.251). A marginally significant difference was found between the World-fixed compass and no compass scores(p = 0.085). Participants in the World-fixed compass condition(M = 3.875, SD = 0.607) had higher spatial situation awareness than in the condition with no orientation compass(M =
4 3 2 1
Spatial Situation Model
5
3.408, SD = 0.879).
No compass
World−fixed
User−fixed
Conditions Figure 5.8: Boxplot showing SSM scores across conditions. Red dot indicates mean scores
Chapter 5
5.4.2
48
Disorientation perception
Following the SSM scales participants answered four questions regarding how they felt about disorientation in the remote space. The scale had high reliability - Cronbach’s alpha = 0.814. A one-way repeated measures ANOVA determined that there was an overall statistically significant difference between the conditions [F (2, 38) = 4.65, p = 0.016], Figure 5.9. Post-hoc tests were done using the Bonferroni correction and a significant difference was found between the World-fixed compass and no compass scores (p = 0.023). The Worldfixed compass(M = 4.025, SD = 0.682) decreased disorientation perception compared to the no compass condition(M = 3.437, SD = 0.913). There was no statistically significant difference between the World-fixed compass and User-fixed compass scores (p = 0.207),
3 2 1
Disorientation
4
5
as well as between the no compass and User-fixed compass (p = 0.808).
No compass
World−fixed
User−fixed
Conditions Figure 5.9: Boxplot showing disorientation perception scores across conditions. Red dot indicates mean scores
Chapter 5
5.4.3
49
Perspicuity
The perspicuity scale had very high reliability - Cronbach’s alpha = 0.941. Figure 5.10 summarizes the results of the questions regarding perspicuity. The analysis showed that there was an overall significant difference between the conditions [F (2, 38) = 5.854, p = 0.006]. Post-hoc tests were done using the Bonferroni correction. A significant difference was found between the World-fixed compass and no compass scores(p = 0.027), as well as between the User-fixed and no compass(p = 0.045) scores. There was no significant difference found between the World-fixed compass and User-fixed compass scores(p = 1.000). The result determined that both World-fixed compass(M = 5.675, SD = 1.272) and User-fixed compass(M = 5.625, SD = 0.879) are easier to learn and use than no
5 4 3 2 1
Perspicuity
6
7
compass (M = 4.675, SD = 1.577).
No compass
World−fixed
User−fixed
Conditions Figure 5.10: Boxplot showing Perspicuity scores across conditions (the higher the score, the less disorientation). Red dot indicates mean scores
Chapter 5
5.4.4
50
User Performance
An analysis of orientation error data with a Friedman test shows a significant difference between the conditions (χ2 (2) = 7.722, p = 0.021), see Figure 5.11. Post-hoc analysis was done using Wilcoxon signed tests with a Bonferroni correction applied. With three comparisons being done, the resulting significance level was set at p < 0.017. There is a significant difference between World-fixed compass and User-fixed compass (Z =
1.5 1.0 0.5 0.0
Orientation Errors
2.0
−2.714, p = 0.007), with World-fixed compass leading to less orientation errors.
No compass
World−fixed
User−fixed
Conditions Figure 5.11: Boxplot showing orientation errors across conditions
The number of rewind times was analysed using a Friedman test which found no statistical significant difference between the conditions (χ2 (2) = 1.194, p = 0.551), see Figure 5.12. Task completion time was analysed using a Friedman test which found no statistical significant difference between the conditions (χ2 (2) = 1.194, p = 0.551), see Figure 5.13.
51
5 4 3 2 0
1
Rewind Times
6
7
Chapter 5
No compass
World−fixed
User−fixed
Conditions
400 300 200 100 0
Completion Time (sec)
500
Figure 5.12: Boxplot of the number of Rewind Times
No compass
World−fixed
User−fixed
Conditions
Figure 5.13: Boxplot of Task Completion Time
Location errors was analysed using a Friedman test which found no statistical significant difference between the conditions (χ2 (2) = 4.537, p = 0.103), see Figure 5.14.
52
5 4 3 2 0
1
Rewind Times
6
7
Chapter 5
No compass
World−fixed
User−fixed
Conditions
Figure 5.14: Boxplot of Task Completion Time
5.4.5 5.4.5.1
Post-study interview feedback Ranking
Following the completion of the three conditions, participants were asked to rank the conditions (which is best, which is worst and so on) based on their preferences. Due to the software failure, one participant’s ranking data was lost, the results obtained were from only 19 participants. As shown in Table 5.1, the number of times which World-fixed compass (M = 1.79, SD = 0.855) and User-fixed compass (M = 1.74, SD = 0.733) were ranked at first place are similar but much higher than the no compass condition(M = 2.74, SD = 0.697). No Compass Best Middle Worst
2 6 11
World-fixed Compass 9 5 5
User-fixed Compass 8 8 3
Table 5.1: Ranking result of three conditions
Chapter 5 5.4.5.2
53 Feedback
Following the ranking question participants were asked why they liked or disliked these conditions. Those who responded that they liked the World-fixed compass provided the following reasons: “The orientation was quite clear and it was easy to judge” “I can easily find which direction is the start” Those who responded that they liked the User-fixed compass provided the following reasons: “Easy to imagine the transition between different directions” “It was more in line with the way I want to read a compass” “Easily identifiable compass based positions that showed up clearly only when I faced a particular direction” Those who responded that they liked the no orientation compass provided the following reasons: “I found using my own spatial awareness made it easy to figure out the locations of the walls”
5.5
Summary
In this chapter the details of the experimental user study comparing two different orientation compasses were presented. A study with 20 participants in controlled lab settings was conducted and the impact of the interfaces with no compass, World-Fixed compass and User-Fixed compass on spatial awareness, disorientation in the remote space, perspicuity of the system as well as performance were evaluated. The results indicate that on subjective measures (questionnaires) there was no statistically differences between the World-Fixed compass and User-Fixed compass. However, objective measure of performance (the number of orientation errors) show that the User-Fixed compass lead to significantly more orientation errors than the World-Fixed compass.
Chapter 6
Discussion The results of the user study show that the World-fixed compass has the best overall performance. It is significantly better than the no orientation compass in disorientation perception and perspicuity. It also has less orientation errors than User-Fixed compass. In the ranking section, about half of participants chose the World-fixed compass as the best condition based on their preference. The User-fixed compass was only significantly better than interface with no orientation compass in perspicuity. Spatial situation awareness In the user study we found that there was an overall significant difference between the conditions. Participants in the World-fixed compass condition had marginally higher spatial situation awareness than in the no orientation compass condition. On the other hand, User-fixed compass did not improve spatial awareness compared to the baseline condition. Therefore, in tasks which require greater spatial awareness, World-fixed compass is preferred. Disorientation decreasing One of the questions that this thesis sought to figure out is whether these 3D orientation compasses could help decrease user disorientation in remote collaboration system. From the result of the disorientation scale, the World-fixed compass significantly decreased user’s disorientation compared with no orientation compass. Thus, we can conclude that the World-fixed compass could help user decrease disorientation in remote collaboration. It also matches participants’ feedback in post-task questionnaire, like “I 54
Chapter 6
55
can easily find which direction is the start one”, “I know the direction easily, don’t need to imagine and guess”, “The orientation was quite clear and it was easy to judge”. However, there was no significant difference found between the User-fixed compass and no orientation compass. This might be because using the User-fixed compass makes it difficult for people to remember which direction they started with during the task. In contrary, because the direction in World-fixed compass was fixed, it is easy for users to know which is the front wall by simply remembering the starting direction. Perspicuity Perspicuity results represent whether the interface is easy to understand or learn. The results show that both compasses in participants’ subjective impression are significantly more understandable or easier than an interface without orientation compass. The possible explanation for these results may be that participants easily get disoriented with varying camera movements when watching the video and finding the target markers. The compass provides references for the orientation and location of markers, which may lead to improved understandability of the system in a fast changing remote environment. Performance The results of user performance showed that there was a significant difference between the World-fixed compass and the User-fixed compass in the number of orientation errors. The World-fixed compass led to fewer orientation errors than the User-fixed compass. This result answered the research question regarding the difference in user performance between the World-fixed and User-fixed compasses. Some design problems were found and some of the measures showed no statistically significant difference between the orientation compass and no orientation compass conditions, such as task completion time or number of times of video rewind. To understand the reasons for this, I reviewed participants feedback which was gathered in the postexperiment questionnaire. According to their responses, the reason may be that the absolute direction text (N,S,W,E) is not the same as the direction on the map (Front, Back, etc.). As a result participants invested a lot of concentration and cognitive processing on tracking and matching the two different types of direction. In the pilot study I was using the matching labels, such as Front or Back, in the application. However, the results of the pilot study with 3 participants showed that using
Chapter 6
56
these labels was was too easy and obvious as all participants completed the task without making a single error. Moreover, the real world compass is more likely to use the absolute orientation (N,S,W,E). In the context of the remote claim assessment in insurance industry understanding the absolute orientation of a damaged object is important in preparing a claim report. Therefore, the absolute orientation labels were used on the compass in the actual experiment.
Chapter 7
Conclusions and Future Work 7.1
Conclusions
Augmented Reality supplements the real world with virtual (computer-generated) objects that appear to coexist in the same space as the real world [35]. The main goal of an AR system is to “enhance reality with digital content in a non-immersive way”. In this research we focused on how AR based remote collaboration can be used to support the insurance claim process. Following a user-centered design process, the prototype concept and remote Augmented Reality collaboration system was envisaged. This system provides AR annotation and text marker functionality in both customer and assessor (or other expert) application. There are 3 additional features for assessor: A visual orientation compass, AR based measurement tool and screen shot. A testable system prototype has been developed, including a tablet application running on a Project Tango device and a laptop application. After developing the prototypes, a formal user study was conducted to evaluate the effects of different 3D orientation compass on user’s experience and understanding of a remote environment when using the video conferencing application. In this user study, twenty participants tested the three conditions: no cue, World-fixed, and User-fixed. We found that although both World-fixed and User-fixed compasses were subjectively rated as equally preferred, World-fixed compass showed performance improvement in
57
Chapter 7
58
terms of less orientation error, and participants became less disoriented with better understanding of the spatial situation.
7.2
Future Work
This research has just completed the first step to explore the design of remote Augmented Reality collaboration system for insurance customer and assessor. There are still many problems that need to be solved and many areas left to explore. For example, we can improve the current interface based on user feedback, and further investigate how to apply them to other similar applications. This section discusses interesting areas for future work.
7.2.1
Interface
In this project we have conducted a user study to evaluate two types of orientation compass. However, we have not tested other interfaces like annotation, measurement, and tag. A body of research around AR annotation has been done by HIT Lab NZ researchers in remote collaboration area. They suggested that using annotation is more effective than using pointer cues or no annotation for communicating object position and orientation information in remote collaboration [24] [25]. However, no evaluation had been conducted to compare a temporary annotation tool (automatically disappears after few seconds and no more removing acting needed) with a permanent annotation tool (exists until manually deleted). Augmented Reality-based measurement tool research has been done in medical area. However, the interaction evaluated have not been applied to remote AR collaboration area. The tag interface in the prototype of this project could still be improved. The world stabilized AR tags and their text were separately displayed on different parts of the screen. Future studies could explore ways to make them intuitively interconnected. Few prior work used screen stabilized content having a pointing line/arrow towards world stabilized AR tags, but not much user studies have been done on this.
Bibliography
7.2.2
59
Application
As shown in the prototype development, the current remote AR collaboration system could only be used by one local user and one remote user. However, in many cases people need support from more than one expert. In that case a multi-party remote collaboration is needed. Even though a multi-party video call system is common now (eg. Skype for business), multi-party remote AR collaboration systems have yet to arrive to the market. Therefore, future work should be dedicated to the development and evaluation of AR systems that would enable several users to use them simultaneously and collaboratively. AR remote collaboration is a novel way to connect people who are located in geographically separate locations. AR interfaces can help improve the quality of their online communication, as well as provide seamless interaction between real and virtual environments. Such collaboration can lead to reduced costs that would otherwise require a physical presence of an expert as well as reduce the time needed by users to receive the necessary support. The insurance industry is one of the fields that can look forward to the introduction of this new technology.
Bibliography [1] ”how science and technology is changing the insurance industry”, 2014. [online]. available: http://www.strategic-risk-global.com/how-science-and-technologyis-changing-the-insurance-industry/1408527.article. [accessed: 10- feb- 2016]. [2] ”project tango tablet development kit user guide”, 2015. [online]. available:
https://developers.google.com/project-tango/hardware/tablet.article. [ac-
cessed: 12- feb- 2016]. [3] ”tango
sdk
documentation”,
2016.
[online].
http://doc.sdk.tango.me/gettingstarted/startingonunity.html.article.
available: [accessed:
10- feb- 2016]. [4] A. Aaltonen. A context visualization model for wearable computers. In Wearable Computers, 2002.(ISWC 2002). Proceedings. Sixth International Symposium on, pages 158–159. IEEE, 2002. [5] M. Adcock and C. Gunn. Annotating with’sticky’light for remote guidance. In ACM SIGGRAPH ASIA 2010 Posters, page 62. ACM, 2010. [6] L. Alem, F. Tecchia, and W. Huang. Remote tele-assistance system for maintenance operators in mines. 2011. [7] R. T. Azuma. A survey of augmented reality. Presence: Teleoperators and virtual environments, 6(4):355–385, 1997. [8] M. Billinghurst, A. Clark, and G. Lee. A survey of augmented reality. Foundations and Trends in Human-Computer Interaction, 8(2-3):73–272, 2015. [9] M. Billinghurst and H. Kato. Collaborative augmented reality. Communications of the ACM, 45(7):64–70, 2002. 60
Bibliography
61
[10] V. Buchmann, M. Billinghurst, and A. Cockburn. Directional interfaces for wearable augmented reality. In Proceedings of the 9th ACM SIGCHI New Zealand Chapter’s International Conference on Human-Computer Interaction: Design Centered HCI, pages 47–54. ACM, 2008. [11] R. A. Chadwick and S. Pazuchanics. Spatial disorientation in remote ground vehicle operations: Target localization errors. In Proceedings of the Human Factors and Ergonomics Society Annual Meeting, volume 51, pages 161–165. Sage Publications, 2007. [12] T.-C. Chang, C.-H. Hsieh, C.-H. Huang, J.-W. Yang, S.-T. Lee, C.-T. Wu, and J.-D. Lee. Interactive medical augmented reality system for remote surgical assistance. Appl. Math, 9(1L):97–104, 2015. [13] J. Y. Chen, E. C. Haas, and M. J. Barnes. Human performance issues and user interface design for teleoperated robots. Systems, Man, and Cybernetics, Part C: Applications and Reviews, IEEE Transactions on, 37(6):1231–1245, 2007. [14] M. Fjeld and B. M. Voegtli. Augmented chemistry: An interactive educational workbench. In Mixed and Augmented Reality, 2002. ISMAR 2002. Proceedings. International Symposium on, pages 259–321. IEEE, 2002. [15] S. R. Fussell, L. D. Setlock, and R. E. Kraut. Effects of head-mounted and sceneoriented video systems on remote collaboration on physical tasks. In Proceedings of the SIGCHI conference on Human factors in computing systems, pages 513–520. ACM, 2003. [16] S. Gauglitz, B. Nuernberger, M. Turk, and T. H¨ollerer. In touch with the remote world: Remote collaboration with augmented reality drawings and virtual navigation. In Proceedings of the 20th ACM Symposium on Virtual Reality Software and Technology, pages 197–205. ACM, 2014. [17] S. Gauglitz, B. Nuernberger, M. Turk, and T. H¨ollerer. World-stabilized annotations and virtual scene navigation for remote collaboration. In Proceedings of the 27th annual ACM symposium on User interface software and technology, pages 449–459. ACM, 2014.
Bibliography
62
[18] W. W. Gaver, A. Sellen, C. Heath, and P. Luff. One is not enough: Multiple views in a media space. In Proceedings of the INTERACT’93 and CHI’93 Conference on Human Factors in Computing Systems, pages 335–341. ACM, 1993. [19] P. Gurevich, J. Lanir, B. Cohen, and R. Stone. Teleadvisor: a versatile augmented reality tool for remote assistance. In Proceedings of the SIGCHI Conference on Human Factors in Computing Systems, pages 619–622. ACM, 2012. [20] B. Hestnes, S. Heiestad, P. Brooks, and L. Drageset. Real situations of wearable computers used for video conferencing and for terminal and network design. In Wearable Computers, 2001. Proceedings. Fifth International Symposium on, pages 85–93. IEEE, 2001. [21] C. M. Humphrey and J. A. Adams. Compass visualizations for human-robotic interaction. In Proceedings of the 3rd ACM/IEEE international conference on Human robot interaction, pages 49–56. ACM, 2008. [22] J. Jaafari.
”4 technologies that are revolutionizing the insurance industry”,
2016. [online]. available:
http://www.propertycasualty360.com/2015/02/03/4-
technologies-that-are-revolutionizing-the-insura?page=3. [accessed: 10- feb- 2016]. [23] S. Kim, G. Lee, N. Sakata, and M. Billinghurst. Improving co-presence with augmented visual communication cues for sharing experience through video conference. In Mixed and Augmented Reality (ISMAR), 2014 IEEE International Symposium on, pages 83–92. IEEE, 2014. [24] S. Kim, G. A. Lee, and N. Sakata. Comparing pointing and drawing for remote collaboration. In Mixed and Augmented Reality (ISMAR), 2013 IEEE International Symposium on, pages 1–6. IEEE, 2013. [25] S. Kim, G. A. Lee, N. Sakata, A. Dunser, E. Vartiainen, and M. Billinghurst. Study of augmented gesture communication cues and view sharing in remote collaboration. In Mixed and Augmented Reality (ISMAR), 2013 IEEE International Symposium on, pages 261–262. IEEE, 2013. [26] G. Kortuem, M. Bauer, and Z. Segall. Netman: the design of a collaborative wearable computer system. Mobile Networks and Applications, 4(1):49–58, 1999.
Bibliography
63
[27] R. E. Kraut, S. R. Fussell, and J. Siegel. Visual information as a conversational resource in collaborative physical tasks. Human-computer interaction, 18(1):13–49, 2003. [28] B. Laugwitz, T. Held, and M. Schrepp. Construction and evaluation of a user experience questionnaire. Springer, 2008. [29] J. Lehikoinen and R. Suomela. Accessing context in wearable computers. Personal and Ubiquitous Computing, 6(1):64–74, 2002. [30] N. Navab, M. Feuerstein, and C. Bichlmeier. Laparoscopic virtual mirror new interaction paradigm for monitor based augmented reality. In Virtual Reality Conference, 2007. VR’07. IEEE, pages 43–50. IEEE, 2007. [31] W. Piekarski and B. Thomas. Arquake: the outdoor augmented reality gaming system. Communications of the ACM, 45(1):36–38, 2002. [32] J. Siegel, R. E. Kraut, B. E. John, and K. M. Carley. An empirical study of collaborative wearable computer systems. In Conference companion on Human factors in computing systems, pages 312–313. ACM, 1995. [33] R. Suomela and J. Lehikoinen. Context compass. In Wearable Computers, The Fourth International Symposium on, pages 147–154. IEEE, 2000. [34] B. Thomas, W. Piekarski, and B. Gunther. Using augmented reality to visualise architecture designs in an outdoor environment. International Journal of Design Computing Special Issue on Design Computing on the Net (DCNet), 1:4–2, 1999. [35] D. Van Krevelen and R. Poelman. A survey of augmented reality technologies, applications and limitations. International Journal of Virtual Reality, 9(2):1, 2010. [36] P. Vorderer, W. Wirth, F. R. Gouveia, F. Biocca, T. Saari, F. J¨ancke, S. B¨ocking, H. Schramm, A. Gysbers, T. Hartmann, et al. Mec spatial presence questionnaire (mec-spq): Short documentation and instructions for application. Report to the European Community, Project Presence: MEC (IST-2001-37661), 3, 2004. [37] D. Wagner and D. Schmalstieg. Artoolkitplus for pose tracking on mobile devices. na, 2007.
Bibliography
64
[38] B. G. Witmer and W. J. Sadowski. Nonvisually guided locomotion to a previously viewed target in real and virtual environments. Human Factors: The Journal of the Human Factors and Ergonomics Society, 40(3):478–488, 1998. [39] F. Zhou, H. B.-L. Duh, and M. Billinghurst. Trends in augmented reality tracking, interaction and display: A review of ten years of ismar. In Proceedings of the 7th IEEE/ACM International Symposium on Mixed and Augmented Reality, pages 193–202. IEEE Computer Society, 2008.
Appendix A. Home Claims Customer Journey
Claims Handling
Assessment
Incident occurs
· Client Manager decides to · Claim details collected, engage Assessor if required · Policy checked · Arrange repair quotes · Excess collected · Arrange specialists (e.g. · Decide if make safe repairs engineers) required · Maintain contact with · Complete claim lodgement and Customer to update on claim ensure notification sent to progress Claims and Assessing Teams
· Safety · Emergency assistance · Reassurance
· Reassurance · Claim covered · Expert advice · Clear process · Timeliness · Understanding/Empathy
· Expert advice · Clear process · Timeliness · Decision maker · Promises met · Understanding/empathy
· Expert advice (Claims Staff not qualified) · Clear process (Often lack clarity) · Timeliness (Could be drawn out or not meet customer expectations)
· Expert advice (more qualified not quite expert) · Timeliness (Could be drawn out or not meet customer expectations) · Promises met (Dependant on the outcome of the above previous expectations set)
"Oh no, what am I going "I hope the repairs can be to do?" completed quickly" "Is it really safe toleave the "Who am I insured with damage as it is until the again?" Assessor/Repairer arrives?" "Why can't someone come out "Am I covered for this?" straight away?"
Staff/User Quotes Tool
Assessor contacts customer to confirm assessment time. Client Manager and Assessor Assessor assesses damage on site and receive claim notification. determines repairer quote required. Client manager confirms Assessor notifies CM to arrange Assessor booking and advised quotes. customer of next steps. Assessor assesses and authorises once quotes to hand.
· Phone · Smartphone · PC · Internet Connection
· Safety inspection · Damage assessment · Check policy criteria · Measure area · Create scope of works · Capture and upload photos · Explain next steps to customer · Determine if specialists required · Notify Client Manager to arrange quotes from repairers · Notify Client Manager to arrange specialist if required · Authorise job and notify repairer · Expert reassurance · Expert advice · Clear process · Timeliness · Decision maker · Promises met · Understanding/Empathy
Repair
Completion
Repairer attends onsite to create and submit quote for authority. Repairer arranges repair time with customer once quote is authorised.
Repairer completes repairs. Assessor attends onsite and carries out quality inspection. Customer receives satisfaction survey.
· Inspect damage to clarify scope of works then quote repairs · Once repair authorisation receive contact customer to book in repair time. · Carry out repairs · Repairer provides customer with updates
· Assessor initiated or customer requested onsite quality inspection · Complete repair quality checklist and upload photos of job · Feedback provided to repairer if required · Customer completes satisfaction survey
· Repairer reassurance · Timeliness · Promises met · Quality assurance · Understanding/Empathy
· Quality repairs · Promises met
· Timeliness (Could be drawn out or not meet customer expectations) · Promises met (Dependant on the outcome of the above previous expectations set)
· Timeliness (Could be drawn out or not meet customer · Promises met (Dependant on expectations) the outcome of the above · Promises met (Dependant previous expectations set on the outcome of the above previous expectations set)
"This is so confusing"
"Will the repairs be completed promptly?"
"I hope he knows how I want "That's not how I expected it it to look" to look"
"Why can't I speak to an Assessor now?"
"I wasn't aware that my policy didn't cover that"
"That doesn't look right"
"Are you able to fix that bit up"
"But that will look horrible"
"This is taking too long"
"I'm over it, I'm just glad the door works"
· Correct actions taken by CM · Customer safety · Time · Clear, correct and detailed information · Reliable and effective tools
· Time · Clear, correct and detailed information · Reliable and effective tools
· Clear, correct and detailed information
· Clear and detailed information (Interdepartmental communication gaps lead to unclear information)
"When exactly will an Assessor come out?" · Reduce further · Reduce further damage/costs damage/costs · Customer safety · Customer safety · Time · Time · Clear and detailed information · Clear, correct and detailed information
Gaps in Staff / User Needs Being Met Staff / User Needs
Customer Quotes
Gaps in Customer Needs Being Met
Anecdotes
Customer pressed accelerator instead of brake, colliding into garage door
Key Action
Lodgement
Customer called AAMI call centre to lodge claim and find out next steps. Claims Assist Officer recorded claim/incident details to lodge claim. Determine that no make safe repairs or temporary accommodation required.
Customer Need
Incident
· Customer safety (Misinterpreting the severity of damages can lead to safety risk) · Time (Interpreting Customers' descriptions can take more time) · Clear and detailed information (Interpreting Customers' description can lead to unclear information)
· Time (Misinterpretation can lead to more time taken) · Customer safety (Misinterpreting the severity of damages can lead to safety risk) · Clear and detailed information (Interdepartmental communication gaps lead to unclear information)
· Time (Misinterpretation can lead to more time taken) · Customer safety (Misinterpreting the severity of damages can lead to safety risk) · Clear and detailed information (Interdepartmental communication gaps lead to unclear information) · Reliable and effective tools (Various tools employed can lead to inconsistent quality of work)
· Time (Misinterpretation can lead to more time taken) · Clear and detailed information (Interdepartmental communication gaps lead to unclear information)
"I hope this will be a smooth lodgement"
"This customer just doesn't get our resource constraints"
"This is a simple repair, it will look as good as new"
"The repairs were carried out "I wasn't authorised to repair satifactorily, the customer just that part" has high expectations"
"Why are there so many calls today?"
"The damage is worse than "Given the resource "These are our only options, I "That will rely on when the repairer originally thought, I'll need to constraints, that was the best can't change the process" can come out to carry out the repairs" discuss with the Assessor" we could do"
"I'm doing the best I can"
"Just wait for the Assessor to call you"
· Smart Phone · Phone · PC · Internet connection · Policy system · Claims system
"As per our policy, we will repair this part" · Smart Phone · Surface Pro · Internet connection · Claims system · Trade licence · Vehicle · Ongoing training · Paper+Pen · Laser Measure · Camera · VAMP · ExactWare · My Claim Manager
· Phone · Smart Phone · PC · Internet connection · Claims system
65
"The repairs are acceptable" · Smart Phone · PC · Internet connection · Trade licence · Vehicle · Ongoing training · Paper+Pen · Laser Measure · Camera · VAMP
"The PDS is clear as to what is covered and what is not"
· Phone · Smart Phone · PC · Internet connection