Weighted Principal Component Analysis Zizhu Fan, Ergen Liu, and Baogen Xu School of Basic Science, East China Jiaotong University, Nanchang, Jiangxi 330013, China
[email protected]
Abstract. In this paper, we proposed a weighted PCA (WPCA) method. This method first uses the distances between the test sample and each training sample to calculate the ‘weighted’ covariance matrix. It then exploits the obtained covariance matrix to perform feature extraction. The experimental results show that the proposed method can obtain a high accuracy than conventional PCA. WPCA has the underlying theoretical foundation: through the ‘weighted’ covariance matrix, WPCA takes emphasis on the training samples that are very close to the test sample and reduce the influence of the other training samples. As a result, it is likely that the test sample is easier to be classified into the same class as the training samples that are very close to it. The experimental results show the feasibility and effectiveness of WPCA. Keywords: principal component analysis eigenvectors, dimensionality reduction.
(PCA),
face
recognition,
1 Introduction Face recognition is one of the most attracting pattern classification and computer vision applications [1-9]. As we know, principal component analysis (PCA) has been widely used in the field of face recognition [12, 8]. This method is indeed a classical linear feature extraction method. When this method transforms samples into a lowerdimensional space, it is able to capture the data components that most vary. PCA is also a method that adopts orthogonal projection axes to transform vector data into uncorrelated components. Actually, PCA can be also applied in data compression. People have also extended conventional PCA into other versions of PCA. For example, people have proposed modular PCA [10, 11], two-dimensional PCA [12, 13, 14], sparse kernel principal component analysis [15] and curvelet based PCA [16]. These methods have different justifications and advantages. For instance, twodimensional PCA can overcome the problem of inaccurate evaluation of the covariance matrix that conventional PCA usually encounters and has a low computational cost. Kernel principal component analysis can do well in extracting the information of the samples with a complex distribution. It has been also shown that modular PCA can obtain higher face recognition accuracy than conventional PCA. It achieves by partitioning each face image into a number of blocks and by applying PCA to each block. Moreover, it is noticeable that Xu. et al. has proposed the very promising matrix-based complex principal component analysis (MCPCA) method. MCPCA has achieved very good performance in bimodal biometrics [17]. This H. Deng et al. (Eds.): AICI 2011, Part III, LNAI 7004, pp. 569–574, 2011. © Springer-Verlag Berlin Heidelberg 2011
570
Z. Fan, E. Liu, and B. Xu
method first denotes two biometrics traits of one subject by a complex matrix and then applies the PCA procedure to the complex matrix. It should be pointed out that when conventional PCA is used in feature extraction of a test sample, it treats all the training samples in the same way. Actually, in the pattern recognition problems, it seems that the training samples that are far from the test sample probably have little influence on the test sample, whereas the training samples that are very close to the test sample probably have very great influence. Inspired by this, we proposed a weighted PCA (WPCA) method with this paper. This method first depends on the distances between the test sample and each training sample to calculate the ‘weighted’ covariance matrix. This method then exploits the obtained covariance matrix to perform feature extraction. The experimental results show that the proposed method can obtain a higher accuracy than conventional PCA. WPCA has the following underlying theoretical foundation: through the ‘weighted’ covariance matrix, WPCA takes emphasis on the training samples that are very close to the test sample and reduces the influence of the other training samples. As a result, it is likely that the test sample is easier to be classified into the same class as the training samples that are very close to it. The remainder of the paper is organized as follows: Sections 2 and 3 present conventional PCA and WPCA, respectively. Section 4 shows the experimental results. Section 4 presents the summary of the paper.
2 Conventional PCA The conventional PCA aims at obtaining an optimal projection through which the projected data have the maximal variance. Suppose that there are N training samples (or n-dimensional vectors) xi ∈ R ( i = 1,2,..., N ) and n
m is the mean of the total
training samples. The covariance matrix of the training data set is defined by
C= where
1 N
N
(x i =1
i
− m)( xi − m)T =
1 XX T , N
(1)
X = [ x1 − m, x 2 − m,..., x N − m] . If the dimension of the covariance
matrix C is so larger (usually n>>N) that the eigen-decomposition of C is very difficult even infeasible, we need to define a new matrix D =
1 T X X . It is easy to N
prove that two matrices C and D have the same non-zero eigenvalues denoting as λi (i =1,2,…,r). We denote the normalized eigenvectors of the matrix D by vi (i =1,2,…,r). The normalized eigenvectors of the covariance matrix C should be
ui =
1
λi
Xvi (i =1,2,…,r).
(2)
Weighted Principal Component Analysis
Conventional PCA transforms the arbitrary sample using f = x U and U x , obtained using PCA. T
571
x into the r -dimensional space
= [u1 ...u r ] . f is called feature extraction result, of sample
3 WPCA WPCA implements a ‘weighted’ PCA procedure for each of all the test samples, respectively. Let y be the test sample and x1 ...x N still denote the training samples. WPCA calculates the ‘weighted’ covariance matrix using
Cw = where xi = wi xi , '
wi = exp(−
1 N ' 'T xi xi , N i =1
max_ dist − dist ( xi , y )
μ
(3)
) . dist ( xi , y ) stands for
xi and y . max_ dist represents the maximum value of the distance between x1 ,..., x N and y . μ is a positive constant. wi is called weight coefficient. C w is the so-called weighted variance matrix. It is clear that the smaller dist ( xi , y ) , the larger wi . In other words, if a training sample is close to the test the distance between
sample, then it has a large weight coefficient and has great influence on the variance matrix. Actually, WPCA uses this way to generate different variance matrices for the test samples. As a result, the projection axes generated from the variance matrix will be very suitable for extracting features of the test sample. WPCA takes the eigenvectors corresponding to the first r largest eigenvalues of C w as projection axes and exploits these projection axes to transforms the sample into a r -dimensional space. In other words, for a test sample, if the eigenvectors corresponding to the first r largest eigenvalues of the weighted variance matrix are
u1' ...u r' ( u1' ...u r' can be calculated using a procedure similar to the procedure to compute u1...ur ), respectively, then the feature extraction result of the arbitrary ' T ' ' ' ' ' sample x is f = x U , where U = [u1 ...u r ] . f is called feature extraction result, of sample x , obtained using WPCA. It should be pointed out that the ‘weighted’ PCA procedure must be implemented one time for each of the test samples. WPCA has the following motivation: by using the weighed coefficient, it aims to take emphasis on the training samples that are very close to the test sample and to reduce the influence of the other training samples. As a result, it is likely that the test sample is easier to be classified into the same class as the training samples that are very close to it.
572
Z. Fan, E. Liu, and B. Xu
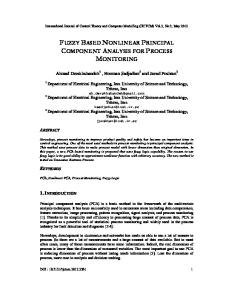
4 Experiments We used the ORL face database to conduct experiments. This database contains a set of face images taken between April 1992 and April 1994 at the lab [18]. The database was used in the context of a face recognition project carried out in collaboration with the Speech, Vision and Robotics Group of the Cambridge University Engineering Department. There are ten different images of each of 40 distinct subjects. For some subjects, the images were taken at different times, varying the lighting, facial expressions (open / closed eyes, smiling / not smiling) and facial details (glasses / no glasses). All the images were taken against a dark homogeneous background with the subjects in an upright, frontal position (with tolerance for some side movement) [18]. Figure 1 shows some face images from this database. We randomly selected five samples of each subject as training samples and took the remaining samples as test samples. We generated 100 sets of training samples and the corresponding sets of test samples in this way and used all the sets to conduct experiments. Each image was converted into a column vector in advance. Every column vector was also normalized to a unit vector. μ was set to 10. We used the neighbor nearest classifier and the feature extraction result of every training and test sample to perform classification. That is, when classifying the test sample, we first calculate the distance between the feature extraction results of the test sample and every training sample. We then classify the test sample into the same class as the training sample whose feature extraction result is the most nearest to that of the test sample. Figure 2 shows the experimental results of conventional PCA and WPCA. The horizontal coordinate shows that the number of projection axes varies from 50 to 100. The horizontal coordinate shows the mean of the classification right rates of 100 sets of test samples. We see that WPCA obtains a higher classification right rate than conventional PCA. We also used the Yale face database to conduct experiments. The Yale Face Database contains 165 grayscale images in GIF format of 15 individuals. There are 11 images per subject, one per different facial expression or configuration: center-light, with/no glasses, happy, left-light, with/no glasses, normal, right-light, sad, sleepy, surprised, and wink [19]. We resized each image into a 40 × 50 image. Each image
Fig. 1. Some face images in the ORL face database
Weighted Principal Component Analysis
573
was also converted into a unit column vector in advance and μ was set to 10. We randomly selected five samples of each subject as training samples and took the remaining samples as test samples. We generated 50 sets of training samples and the corresponding sets of test samples in this way and used all the sets to conduct experiments. Table 1 shows the experimental result. We see again that WPCA obtains a higher classification right rate than conventional PCA.
Fig. 2. Means of the classification right rates of weighted PCA and conventional PCA on 100 sets of test samples of the ORL face database Table 1. The means of the classification right rates of weighted PCA and conventional PCA on the Yale face database
Number of projection axes Conventional PCA Weighted PCA
50
60
70
95.85%
95.94%
95.94%
96.38%
96.87%
96.59%
5 Conclusions By setting different weight coefficients for different training samples, WPCA enables the training samples that are close to the test sample to have great influence on the covariance matrix of the test sample, whereas makes the training samples that are far from the test sample to have little influence. As a result, different training samples also have the similar influence to the feature extraction of the test sample. As a result, the projection axes generated from the variance matrix will be very suitable for extracting features of the test sample.
574
Z. Fan, E. Liu, and B. Xu
Acknowledgements. This work was supported by the National Natural Science Foundation of China (Grant No. 61071179, 11061014, 60803090, 61001037 and 61065003) and Jiangxi Provincial Natural Science Foundation of China (Grant No. 2010GQS0027).
References 1. Turk, M.A., Pentland, A.P.: Face Recognition Using Eigenfaces. In: IEEE Conf. on Computer Vision and Pattern Recognition, pp. 586–591 (1991) 2. Diamantaras, K.I., Kung, S.Y.: Principal Component Neural Networks: Theory and Applications. John Wiley & Sons, Inc., Chichester (1996) 3. Hadid, A., Pietikäinen, M.: Manifold learning for video-to-video face recognition. In: COST 2101/2102 Conference 2009, pp. 9–16 (2009) 4. Xu, Y., Zhong, A., Yang, J., Zhang, D.: LPP solution schemes for use with face recognition. Pattern Recognition 43(12), 4165–4176 (2010) 5. Xu, Y., Yang, J.-Y., Lu, J., Yu, D.: An efficient renovation on kernel Fisher discriminant analysis and face recognition experiments. Pattern Recognition 37(10), 2091–2094 (2004) 6. Phillips, P.J., Grother, P., Micheals, R.J., et al.: Face recognition vendortest 2002: evaluation report. Face Recognition Vendor Test 2002 Results (2003) 7. Zhao, W., Nandhakumar, N.: Linear discriminant analysis of MPF for face recognition. In: Proc. Int. Conf. Pattern Recognition, pp. 185–188 (1998) 8. Turk, M., Pentland, A.: Eigenfaces for recognition. J. Cognitive Neurosci. 3(1), 71–86 (1991) 9. Graham, D.B., Allinson, N.M.: Characterizing virtual eigensignatures for general purpose face recognition. In: Face Recognition: From Theory to Applications. NATO ASI Series F, Computer and Systems Sciences, vol. 163, pp. 446–456 (1998) 10. Pentland, A., Moghaddam, B., Starner, T.: View-Based and Modular Eigenspaces for face recognition. In: Proceedings of 1994 IEEE Computer Society Conference on Computer Vision and Pattern Recognition, pp. 84–91 (1994) 11. Gottumukkal, R., Asari, V.K.: An improved face recognition technique based on modular PCA approach. PRL 25(4), 429–436 (2004) 12. Xu, Y., Zhang, D., Yang, J., Yang, J.-Y.: An approach for directly extracting features from matrix data and its application in face recognition. Neurocomputing 71(10-12), 1857–1865 (2008) 13. Xu, L., Wang, Y., Sun, C.: Face recognition based on two dimension double PCA and affinity propagation. In: ICNC, vol. 5, pp. 43–47 (2009) 14. Yang, J., Zhang, D., Frangi, A.F., Yang, J.-Y.: Two-dimensional PCA: A new approach to appearance-based face representation and recognition. IEEE Trans. Pattern Anal. Mach. Intell. 26(1), 131–137 (2004) 15. Tipping, M.E.: Sparse Kernel Principal Component Analysis. In: Leen, T.K., Dietterich, T.G., Tresp, V. (eds.) NIPS 2000: Neural Information Processing Systems, pp. 633–639. MIT Press, Cambridge (2000) 16. Mandal, T., Wu, Q.M.J.: Face recognition using curvelet based PCA. In: 19th International Conference on Pattern Recognition, ICPR 2008 (2008) 17. Xu, Y., Zhang, D., Yang, J.-Y.: A feature extraction method for use with bimodal biometrics. Pattern Recognition 43, 1106–1115 (2010) 18. http://www.cl.cam.ac.uk/research/dtg/attarchive/ facedatabase.html 19. http://www.abc-directory.com/site/956163