SECTION 3
Water Pollution Objectives 왘 Compare point-source pollution
and nonpoint-source pollution. 왘 Classify water pollutants by five
types. 왘 Explain why groundwater pollution is difficult to clean. 왘 Describe the major sources of ocean pollution, and explain the effects of pollution on ecosystems. 왘 Describe six major laws designed to improve water quality in the United States.
Key Terms water pollution point-source pollution nonpoint-source pollution wastewater artificial eutrophication thermal pollution biomagnification
You might think that you can tell if a body of water is polluted by the way that the water looks or smells, but sometimes you can’t. There are many different forms of water pollution. Water pollution is the introduction of chemical, physical, or biological agents into water that degrade water quality and adversely affect the organisms that depend on the water. Almost all of the ways that we use water contribute to water pollution. However, the two underlying causes of water pollution are industrialization and rapid human population growth. In the last 30 years, developed countries have made great strides in cleaning up many polluted water supplies. Despite this progress, some water is still dangerously polluted in the United States and in other countries. In developing parts of the world, water pollution is a big problem. Industry is usually not the major cause of water pollution in developing countries. Often, the only water available for drinking in these countries is polluted with sewage and agricultural runoff, which can spread waterborne diseases. To prevent water pollution, people must understand where pollutants come from. As you will learn, water pollution comes from two types of sources: point and nonpoint sources.
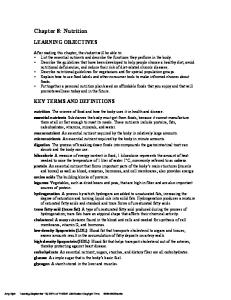
Figure 15 왘 Point-source pollution
comes from a single, easily identifiable source. In this photo, the waste from an iron mine is being stored in a pond. Table 3 왔
Sources of Point Pollution • leaking septic-tank systems • leaking storage lagoons for polluted waste • unlined landfills • leaking underground storage tanks that contain chemicals or fuels such as gasoline • polluted water from abandoned and active mines • water discharged by industries • public and industrial wastewater treatment plants
284 Chapter 11 Water
Copyright© by Holt, Rinehart and Winston. All rights reserved.
Point-Source Pollution When you think of water pollution, you probably think of a single source, such as a factory, a wastewater treatment plant, or a leaking oil tanker. These are all examples of point-source pollution, which is pollution discharged from a single source. Table 3 lists some additional examples of point-source pollution. Point-source pollution can often be identified and traced to a source. But even when the source of pollution is known, enforcing cleanup is sometimes difficult.
Nonpoint-Source Pollution Nonpoint-source pollution comes from many different sources that are often difficult to identify. For example, a river can be polluted by runoff from any of the land in its watershed. If a farm, a road, or any other land surface in a watershed is polluted, runoff from a rainstorm can carry the pollution into a nearby river, stream, or lake. Figure 16 shows common sources of nonpoint pollutants. Table 4 lists some additional causes of nonpoint pollution. Because nonpoint pollutants can enter bodies of water in many different ways, they are extremely difficult to regulate and control. The accumulation of small amounts of water pollution from many sources is a major pollution problem—96 percent of the polluted bodies of water in the United States were contaminated by nonpoint sources. Controlling nonpoint-source pollution depends to a great extent on public awareness of the effects of activities such as spraying lawn chemicals and using storm drains to dispose of used motor oil.
FIELD ACTIVITY Identifying Sources of Pollution Walk around your neighborhood, and record potential sources of nonpoint pollution. See Table 4 for examples. Count the number of potential sources of nonpoint pollution, and suggest ways to reduce each source of pollution in your EcoLog.
Table 4 왔
Nonpoint Sources of Pollution • chemicals added to road surfaces (salt and other de-icing agents) • water runoff from city and suburban streets that may contain oil, gasoline, animal feces, and litter • pesticides, herbicides, and fertilizer from residential lawns, golf courses, and farmland • feces and agricultural chemicals from livestock feedlots • precipitation containing air pollutants • soil runoff from farms and construction sites • oil and gasoline from personal watercraft
Figure 16 왘 Sources of Nonpoint Pollution Examples of nonpointsource pollution include livestock polluting water holes that can flow into streams and reservoirs, oil on a street, which can wash into storm sewers and then drain into waterways, and thousands of watercraft, which can leak gasoline and oil.
Section 3 Water Pollution 285 Copyright© by Holt, Rinehart and Winston. All rights reserved.
Table 5 왔
Pollutant Types and Sources Type of pollutant
Agent
Major sources
Pathogens
disease-causing organisms, such as bacteria, viruses, protozoa, and parasitic worms
mostly nonpoint sources; sewage or animal feces, livestock feedlots, and poultry farms; sewage from overburdened wastewater treatment plants
Organic matter
animal and plant matter remains, feces, food waste, and debris from food-processing plants
mostly nonpoint sources
Organic chemicals
pesticides, fertilizers, plastics, detergents, gasoline and oil, and other materials made from petroleum
mostly nonpoint sources; farms, lawns, golf courses, roads, wastewater, unlined landfills, and leaking underground storage tanks
Inorganic chemicals
acids, bases, salts, and industrial chemicals
point sources and nonpoint sources; industrial waste, road surfaces, wastewater, and polluted precipitation
Heavy metals
lead, mercury, cadmium, and arsenic
point sources and nonpoint sources; industrial discharge, unlined landfills, some household chemicals, and mining processes; heavy metals also occur naturally in some groundwater
Physical agents
heat and suspended solids
point sources and nonpoint sources; heat from industrial processes and suspended solids from soil erosion
Principal Water Pollutants There are many different kinds of water pollutants. Table 5 lists some common types of pollutants and some of the possible sources of each pollutant.
Wastewater Do you know where water goes after it flows down the drain in a sink? The water usually flows through a series of sewage pipes that carry it—and all the other wastewater in your community— to a wastewater treatment plant. Wastewater is water that contains waste from homes or industry. At a wastewater treatment plant, water is filtered and treated to make the water clean enough to return to a river or lake.
Treating Wastewater A typical residential wastewater treatment process is illustrated in Figure 17. Most of the wastewater from homes contains biodegradable material that can be broken down by living organisms. For example, wastewater from toilets and kitchen sinks contains animal and plant wastes, paper, and soap, all of which 286 Chapter 11 Water
Copyright© by Holt, Rinehart and Winston. All rights reserved.
are biodegradable. But wastewater treatment plants may not remove all of the harmful substances in water. Some household and industrial wastewater and some storm-water runoff contains toxic substances that cannot be removed by the standard treatment.
Sewage Sludge If you look again at Figure 17, you will see that one of the products of wastewater treatment is sewage sludge, the solid material that remains after treatment. When sludge contains dangerous concentrations of toxic chemicals, it must be disposed of as hazardous waste. The sludge is often incinerated, and then the ash is buried in a secure landfill. Sludge can be an expensive burden to towns and cities because the volume of sludge that has to be disposed of every year is enormous. The problem of sludge disposal has prompted many communities to look for new uses for this waste. If the toxicity of sludge can be reduced to safe levels, sludge can be used as a fertilizer. In another process, sludge is combined with clay to make bricks that can be used in buildings. In the future, industries will probably find other creative ways to use sludge.
Connection to
History
Cryptosporidium Outbreak In 1993, a pathogen called Cryptosporidium parvum contaminated the municipal water supply of Milwaukee, Wisconsin. The waterborne parasite caused more than 100 deaths, and 400,000 people experienced a flulike illness. Cryptosporidium is found in animal feces, but the parasite usually occurs in low levels in water supplies. The outbreak in Milwaukee was probably caused by an unusual combination of heavy rainfall and agricultural runoff that overburdened the city’s water treatment plants.
Figure 17 왘 Wastewater Treatment Process
Copyright© by Holt, Rinehart and Winston. All rights reserved.
Section 3 Water Pollution 287
QuickLAB Measuring Dissolved Oxygen Procedure 1. Start with three water samples, each in a plastic jar that is 3⁄4 full. Two water samples should be tap water from a faucet without an aerator. One sample should be water that has been boiled and allowed to cool. 2. Using a dissolved-oxygen test kit, test the boiled water and one other water sample. 3. Tighten the lid on the third sample, and then vigorously shake the sample for one minute. Unscrew the lid, and then recap the jar. 4. Repeat step 3 twice. Then, uncap the jar quickly, and test the sample. Analysis 1. Which sample had the highest dissolved oxygen level? Which sample had the lowest level? 2. What effects do rapids and waterfalls have on the levels of dissolved oxygen in a stream? What effect does thermal pollution have?
Artificial Eutrophication Most nutrients in water come from organic matter, such as leaves and animal waste, that is broken down into mineral nutrients by decomposers such as bacteria and fungi. Nutrients are an essential part of any aquatic ecosystem, but an overabundance of nutrients can disrupt an ecosystem. When lakes and slow-moving streams contain an abundance of nutrients, they are eutrophic (yoo TROH fik). Eutrophication is a natural process. When organic matter builds up in a body of water, it will begin to decay and decompose. The process of decomposition uses up oxygen. As oxygen levels decrease, the types of organisms that live in the water change over time. For example, as a body of water becomes eutrophic, plants take root in the nutrient-rich sediment at the bottom. As more plants grow, the shallow waters begin to fill in. Eventually, the body of water becomes a swamp or marsh. The natural process of eutrophication is accelerated when inorganic plant nutrients, such as phosphorus and nitrogen, enter the water from sewage and fertilizer runoff. Eutrophication caused by humans is called artificial eutrophication. Fertilizer from farms, lawns, and gardens is the largest source of nutrients that cause artificial eutrophication. Phosphates in some laundry and dishwashing detergents are another major cause of eutrophication. Phosphorus is a plant nutrient that can cause the excessive growth of algae. In bodies of water polluted by phosphorus, algae can form large floating mats, called algal blooms, as shown in Figure 18. As the algae die and decompose, most of the dissolved oxygen is used and fish and other organisms suffocate in the oxygen-depleted water.
Figure 18 왘 In an effort to limit
artificial eutrophication, some states have either banned phosphate detergents or limited the amount of phosphates in detergents.
288 Chapter 11 Water
Copyright© by Holt, Rinehart and Winston. All rights reserved.
Figure 19 왘 Fish kills, such as this
Thermal Pollution If you look at Figure 19, you might assume that a toxic chemical caused the massive fish kill in the photo. But the fish were not killed by a chemical spill—they died because of thermal pollution. When the temperature of a body of water, such as a lake or stream, increases, thermal pollution can result. Thermal pollution can occur when power plants and other industries use water in their cooling systems and then discharge the warm water into a lake or river. Thermal pollution can cause large fish kills if the discharged water is too warm for the fish to survive. But most thermal pollution is more subtle. If the temperature of a body of water rises even a few degrees, the amount of oxygen the water can hold decreases significantly. As oxygen levels drop, aquatic organisms may suffocate and die. If the flow of warm water into a lake or stream is constant, it may cause the total disruption of an aquatic ecosystem.
Groundwater Pollution Pollutants usually enter groundwater when polluted surface water percolates down from the Earth’s surface. Any pollution of the surface water in an area can affect the groundwater. Pesticides, herbicides, chemical fertilizers, and petroleum products are common groundwater pollutants. Leaking underground storage tanks are another major source of groundwater pollution. It is estimated that there are millions of underground storage tanks in the United States. Most of the tanks—located beneath gas stations, farms, and homes—hold petroleum products, such as gasoline and heating fuel. As underground storage tanks age, they may develop leaks, which allow pollutants to seep into the groundwater. Copyright© by Holt, Rinehart and Winston. All rights reserved.
one in Brazil, can result from thermal pollution.
Connection to
Chemistry
Dissolved Oxygen One of the most important measures of the health of a body of water is the amount of dissolved oxygen in the water. Gaseous oxygen enters water by diffusion from the surrounding air, as a byproduct of photosynthesis, and as a result of the rapid movement (aeration) of water. The amount of oxygen that water can hold is determined by the water’s temperature, pressure, and salinity. Slow-moving waters tend to have low levels of dissolved oxygen, while rapidly flowing streams have higher levels. Artificial eutrophication and thermal pollution also reduce levels of dissolved oxygen. When dissolved oxygen levels remain below 1 to 2 mg/L for several hours, fish and other organisms suffocate, and massive fish kills can result.
Section 3 Water Pollution 289
MATHPRACTICE Parts per Million Water contamination is often measured in parts per million (ppm). If the concentration of a pollutant is 5 ppm, there are 5 parts of the pollutant in 1 million parts of water. If the concentration of gasoline is 3 ppm in 650,000 L of water, how many liters of gasoline are in the water?
Figure 20 왘 This diagram shows
some of the major sources of groundwater pollution. Runoff and percolation transport contaminants to the groundwater.
290 Chapter 11 Water
The location of aging underground storage tanks is not always known, so the tanks often cannot be repaired or replaced until after they have leaked enough pollutants to be located. Modern underground storage tanks are contained in concrete and have many features to prevent leaks. Other sources of groundwater pollution include septic tanks, unlined landfills, and industrial wastewater lagoons, as shown in Figure 20.
Cleaning Up Groundwater Pollution Groundwater pollution is one of the most challenging environmental problems that the world faces. Even if groundwater pollution could be stopped tomorrow, some groundwater would remain polluted for generations to come. As you have learned, groundwater recharges very slowly. The process for some aquifers to recycle water and purge contaminants can take hundreds or thousands of years. Groundwater is also difficult to decontaminate because the water is dispersed throughout large areas of rock and sand. Pollution can cling to the materials that make up an aquifer, so even if all of the water in an aquifer were pumped out and replaced with clean water, the groundwater could still become polluted.
Copyright© by Holt, Rinehart and Winston. All rights reserved.
Figure 21 왘 Major North American Oil Spills
Ocean Pollution Although oceans are the largest bodies of water on Earth, they are still vulnerable to pollution. Pollutants are often dumped directly into the oceans. For example, ships can legally dump wastewater and garbage overboard in some parts of the ocean. But at least 85 percent of ocean pollution—including pollutants such as oil, toxic wastes, and medical wastes—comes from activities on land. If polluted runoff enters rivers, for example, the rivers may carry the polluted water to the ocean. Most activities that pollute oceans occur near the coasts, where much of the world’s human population lives. As you might imagine, sensitive coastal ecosystems, such as coral reefs, estuaries, and coastal marshes, are the most affected by pollution.
Oil Spills Ocean water is also polluted by accidental oil spills. Disasters such as the 1989 Exxon Valdez oil spill in Prince William Sound, Alaska, make front-page news around the world. In 2001, a fuel-oil spill off the coast of the Galápagos Islands captured public attention. Each year, approximately 37 million gallons of oil from tanker accidents are spilled into the oceans. Figure 21 shows some of the major oil spills that occurred off the coast of North America in the last 30 years. Such oil spills have dramatic effects, but they are responsible for only about 5 percent of oil pollution in the oceans. Most of the oil that pollutes the oceans comes from cities and towns. Every year, as many as 200 million to 300 million gallons of oil enter the ocean from nonpoint sources on land. That’s almost 10 times the amount of oil spilled by tankers. In fact, in one year, the road runoff from a coastal city of 5 million people could contain as much oil as a tanker spill does. Limiting these nonpoint sources of oil pollution would go a long way toward keeping the oceans clean. Copyright© by Holt, Rinehart and Winston. All rights reserved.
Ecofact Cruise Ship Discharges In one year, ships dump almost 7 billion kilograms of trash into the ocean. About 75 percent of all ship waste comes from cruise ships. According to most international law, cruise ships are allowed to dump nonplastic waste—including untreated sewage—into the ocean. Increasing public pressure has begun to cause the cruise-ship industry to change this practice, however.
www.scilinks.org Topic: Water Pollution SciLinks code: HE4122
Section 3 Water Pollution 291
Water Pollution and Ecosystems Water pollution can cause immediate damage to an ecosystem. For example, toxic chemicals spilled directly into a river can kill nearly all living things for miles downstream. But the effects of water pollution can be even more far reaching. Many pollutants accumulate in the environment because they do not decompose quickly. As the pollutant levels increase, they can threaten an entire ecosystem. Consider a river ecosystem. Soil tainted with pesticides washes into the river and settles to the river bottom. Some of the pesticides enter the bodies of tiny, bottom-dwelling organisms, such as insect larvae and crustaceans. A hundred of these organisms are eaten by one small fish. A hundred of these small fish are eaten by one big fish. A predatory bird, such as an eagle, eats 10 big fish. Each organism stores the pesticide in its tissues, so at each step along the food chain, the amount of the pesticide passed on to the next organism increases. This accumulation of pollutants at successive levels of the food chain is called biomagnification. Biomagnification, which is illustrated in Figure 22, has alarming consequences for organisms at the top of the food chain. Biomagnification is one reason why many U.S. states limit the amount of fish that people can eat from certain bodies of water.
Cleaning Up Water Pollution Figure 22 왘 The accumulation of
pollutants at successive levels of the food chain is called biomagnification.
Figure 23 왘 The Cuyahoga River
was so polluted with petroleum and petroleum byproducts that it caught on fire and burned in 1969.
292 Chapter 11 Water
In 1969, the Cuyahoga River in Cleveland, Ohio, was so polluted that the river caught on fire and burned for several days, as shown in Figure 23. This shocking event was a major factor in the passage of the Clean Water Act of 1972. The stated purpose of the act was to “restore and maintain the chemical, physical, and biological integrity of the nation’s waters.” The goal of the act was to make all surface water clean enough for fishing and swimming by 1983. This goal was not achieved; however, much progress has been made since the act was passed. The percentage of lakes and rivers that are fit for swimming and fishing has increased by about 30 percent, and many states have passed stricter water-quality standards of their own. Many toxic metals are now removed from wastewater before the water is discharged. The Clean Water Act opened the door for other water-quality legislation, some of which is described in Table 6. For example, the Marine Protection, Research, and Sanctuaries Act of 1972 strengthened the laws against ocean dumping. The Oil Pollution Act of 1990 requires all oil tankers traveling in U.S. waters to Copyright© by Holt, Rinehart and Winston. All rights reserved.
Table 6 왔
Federal Laws Designed to Improve Water Quality in the United States 1972 Clean Water Act (CWA) The CWA set a national goal of making all natural surface water fit for fishing and swimming by 1983 and banned pollutant discharge into surface water after 1985. The act also required that metals be removed from wastewater. 1972 Marine Protection, Research, and Sanctuaries Act, amended 1988 This act empowered the EPA to control the dumping of sewage wastes and toxic chemicals in U.S. waters. 1975 Safe Drinking Water Act (SDWA), amended 1996 This act introduced programs to protect groundwater and surface water from pollution. The act emphasized sound science and risk-based standards for water quality. The act also empowered communities in the protection of source water, strengthened public right-to-know laws, and provided water system infrastructure assistance.
FIELD ACTIVITY Coastal Cleanups You can be a part of a coastal cleanup. Every September, people from all over the world set aside one day to help clean up debris from beaches. You can join this international effort by writing to The Center for Marine Conservation. If you do participate in a coastal cleanup, keep a record of the types of trash you find in your EcoLog.
1980 Comprehensive Environmental Response Compensation and Liability Act (CERCLA) This act is also known as the Superfund Act. The act makes owners, operators, and customers of hazardous waste sites responsible for the cleanup of the sites. The act has reduced the pollution of groundwater by toxic substances leached from hazardous waste dumps. 1987 Water Quality Act This act was written to support state and local efforts to clean polluted runoff. It also established loan funds to pay for new wastewater treatment plants and created programs to protect major estuaries. 1990 Oil Pollution Act This act attempts to protect U.S. waterways from oil pollution by requiring that oil tankers in U.S. waters be double-hulled by 2015.
have double hulls by 2015 as an added protection against oil spills. Legislation has improved water quality in the United States, but the cooperation of individuals, businesses, and the government will be essential to maintaining a clean water supply in the future.
SECTION 3
Review
1. Explain why point-source pollution is easier to control than nonpoint-source pollution. 2. List the major types of water pollutants. Suggest ways to reduce the levels of each type of pollutant in a water supply. 3. Describe the unique problems of cleaning up groundwater pollution. 4. Describe the source of most ocean pollution. Is it point-source pollution or nonpoint-source pollution?
Copyright© by Holt, Rinehart and Winston. All rights reserved.
CRITICAL THINKING 5. Interpreting Graphics Read the description of biomagnification. Draw a diagram that shows the biomagnification of a pollutant in an ecosystem. READING SKILLS
6. Applying Ideas What can individuals do to decrease ocean pollution? Write and illustrate a guide that gives at least three examples. WRITING SKILLS
Section 3 Water Pollution 293
CHAPTER
11
Highlights Key Terms
Main Ideas
surface water, 270 river system, 271 watershed, 271 groundwater, 272 aquifer, 272 porosity, 273 permeability, 273 recharge zone, 274
왘 Only a small fraction of Earth’s water supply is fresh water. The two main sources of fresh water are surface water and groundwater. 왘 River systems drain the land that makes up a watershed. The amount of water in a river system can vary in different seasons and from year to year. 왘 Groundwater accumulates in underground formations called aquifers. Surface water enters an aquifer through the aquifer’s recharge zone. 왘 If the water in an aquifer is pumped out faster than it is replenished, the water table drops, which can affect humans and animals that depend on the groundwater.
2 Water Use and Management
potable, 277 pathogen, 277 irrigation, 278 dam, 280 reservoir, 280 desalination, 283
There are three main types of water use: residential, industrial, and agricultural. Worldwide, most water use is agricultural. 왘 Dams and water diversion projects are built to manage surface-water resources. Damming and diverting rivers can have environmental and social consequences. 왘 Water conservation is necessary to maintain an adequate supply of fresh water. Desalination and transporting water are options to supplement local water supplies.
3 Water Pollution
water pollution, 284 point-source pollution, 285 nonpoint-source pollution, 285 wastewater, 286 artificial eutrophication, 288 thermal pollution, 289 biomagnification, 292
Water can become polluted by chemical, physical, or biological agents. Most water pollution in the United States is caused by nonpoint-source pollutants. 왘 Groundwater pollution is difficult to clean up because aquifers recharge slowly and because pollutants cling to the materials that make up an aquifer. 왘 Ocean pollution is mainly caused by coastal, nonpoint-source pollutants. 왘 Government legislation, such as the Clean Water Act of 1972, has succeeded in reducing surface-water pollution. Future challenges include reducing nonpoint-source pollution and groundwater pollution.
1 Water Resources
294 Chapter 11 Highlights
왘
왘
Copyright© by Holt, Rinehart and Winston. All rights reserved.
CHAPTER
11
Review
Using Key Terms
Use each of the following terms in a separate sentence. 1. aquifer 2. recharge zone 3. irrigation 4. wastewater 5. biomagnification For each pair of terms, explain how the meanings of the terms differ. 6. surface water and groundwater 7. porosity and permeability 8. watershed and river system 9. point-source pollution and nonpoint-source pollution
STUDY TIP Root Words To practice vocabulary, write the key terms and definitions on a piece of paper and fold the paper lengthwise so that the definitions are covered. First, see how many definitions you already know. Then, write the definitions you do not know on another piece of paper, and practice until you know all of the terms.
Understanding Key Ideas 10. Which of the following processes is not a part of the water cycle? a. evaporation b. condensation c. biomagnification d. precipitation 11. Most of the fresh water on Earth is a. located underground in aquifers. b. frozen in the polar icecaps. c. located in rivers, lakes, streams, and wetlands. d. found in Earth’s atmosphere.
Copyright© by Holt, Rinehart and Winston. All rights reserved.
12. Which of the following processes is not used in a conventional method of water treatment? a. filtration b. coagulation c. aeration d. percolation 13. Which of the following is not an example of point-source pollution? a. oil that is escaping from a damaged tanker b. heavy metals that are leaching out of an underground mine c. water runoff from residential lawns d. untreated sewage that is accidentally released from a wastewater treatment plant 14. Which of the following pollutants causes artificial eutrophication? a. heavy metals from unlined landfills b. inorganic plant nutrients from wastewater and fertilizer runoff c. toxic chemicals from factories d. radioactive waste from nuclear power plants 15. Pumping large amounts of water from an aquifer may cause the a. water table to rise. b. recharge zone to shrink. c. wells in an area to run dry. d. percolation of groundwater to stop. 16. Oil pollution in the ocean is mostly caused by a. major oil spills, such as the 1989 Exxon Valdez oil spill. b. the cumulative effect of small oil spills and leaks on land. c. decomposed plastic materials. d. intentional dumping of excess oil. 17. Thermal pollution has a harmful effect on aquatic environments because a. water has been circulated around powerplant generators. b. it increases the number of disease-causing organisms in aquatic environments. c. it reduces the amount of dissolved oxygen in aquatic environments. d. it decreases the nutrient levels in aquatic environments.
Chapter 11 Review 295
11
CHAPTER
Short Answer
Review Concept Mapping
18. What effect can buildings and parking lots have on an aquifer’s recharge zone? 19. Why is the use of overhead sprinklers for irrigation inefficient? What is a more efficient method of irrigation? 20. List three advantages and three disadvantages of dams. 21. What is the process of eutrophication, and how do human activities accelerate it? 22. Describe the steps that are involved in the primary and secondary treatment of wastewater.
Interpreting Graphics The graph below shows the annual flow, or discharge, of the Yakima River in Washington. Use the graph to answer questions 23–25. 23. In which months is the river’s discharge highest? What might explain these discharge rates? 24. What might cause the peaks in river discharge between November and March? 25. How might the data be different if the hydrograph readings were taken below a large dam on the Yakima River? Hydrograph of the Yakima River 10,000
?
26. Use the following terms to create a concept map: Earth’s surface, rivers, underground, fresh water, water table, 3 percent, and icecaps.
Critical Thinking 27. Making Comparisons Read the description of artificial eutrophication in this chapter. Do you think artificial eutrophication is more disturbing to the stability of a water ecosystem than natural eutrophication is? READING SKILLS
28. Analyzing Relationships Water resources are often shared by several countries. A river, for example, might flow through five countries before it reaches an ocean. When water resources are shared, how should countries determine water rights and environmental responsibility? 29. Making Inferences Explain why it takes 36 gallons of water to produce a single serving of rice, but it takes more than 2,000 gallons of water to produce a single serving of steak. What do you think the water is used for in each case? 30. Making Inferences Why is there so little fresh water in the world? Do you think that there would have been more fresh water at a different time in Earth’s history?
Cross-Disciplinary Connection
9,000
Mean daily discharge (ft3/s)
? ?
31. Social Studies Find out how freshwater resources affected the development of one culture in history. Use at least five key terms from this chapter to write a two-paragraph description of how the availability of fresh water affected the culture you chose. WRITING SKILLS
8,000 7,000 6,000 5,000 4,000
Portfolio Project
3,000 2,000 1,000
O
N
D
1988
J
F
1989
296 Chapter 11 Review
M
A
Months
M
J
J
A
S
32. Investigation Find out about the source of the tap water in your home. Where does the tap water come from, and where does your wastewater go? Does the water complete a cycle? Make a poster to illustrate your findings. You may want to work with several classmates and visit the sites you discover. Copyright© by Holt, Rinehart and Winston. All rights reserved.
MATH SKILLS The graph below illustrates the pumping rates for a set of wells that provide water to a small community. Use the graph to answer question 33. Pumping rate (gal/min)
10 8 6 4 2 0
Well A
Well B
Well C
Well D
Well E
33. Analyzing Data How many gallons does Well B pump per day? What is the average pump rate for all of the wells? In one hour, how many more gallons of water will Well A pump than Well C? 34. Making Calculations If placing a container of water in your toilet tank reduces the amount of water per flush by 2 L, how much water would be saved each day if this were done in 80 million toilets? (Assume that each toilet is flushed five times per day.) Convert your answer into gallons (1 L = .26 Gal).
WRITING SKILLS 35. Communicating Main Ideas Why is water pollution a serious problem? 36. Writing Persuasively Write a letter to a senator in which you voice your support or criticism of a hypothetical water diversion project.
READING FOLLOW-UP Now that you have read the chapter, take a moment to review your answers to the Reading Warm-Up questions in your EcoLog. If necessary, revise your answers. Copyright© by Holt, Rinehart and Winston. All rights reserved.
Read the passage below, and then answer the questions that follow. Water use is measured in two ways: by withdrawal and by consumption. Withdrawal is the removal and transfer of water from its source to a point of use, such as a home, business, or industry. Most of the water that is withdrawn is eventually returned to its source. For example, much of the water used in industries and in homes is treated and returned to the river or lake it came from. When water is withdrawn and is not returned to its source, the water is consumed. For example, when a potted plant is watered, almost all of the water eventually enters the atmosphere by evapotranspiration through the leaves of the plant. The evaporated water was consumed because it was not directly returned to its source. 1. According to the passage, which of the following statements is true? a. Water that is consumed was never withdrawn. b. Water that is withdrawn cannot be consumed. c. A fraction of the water withdrawn is usually consumed. d. All of the water withdrawn is consumed. 2. Which phrase best describes the meaning of the term evapotranspiration? a. the absorption of water by plant leaves b. the process by which potted plants transpire their leaves by evaporation c. the process by which the atmosphere maintains water levels in plant leaves d. the process by which water evaporates from plant leaves 3. Which of the following statements is an example of consumption? a. A river is diverted to irrigate crops. b. A power plant takes in cool water from a lake and returns the water to the lake. c. A dam forms a reservoir on a river. d. An aquifer is recharged by surface water. Chapter 11 Review 297
CHAPTER
Objectives
11
왘 Construct a model of the Earth’s
natural groundwater filtering system. 왘 USING SCIENTIFIC METHODS Test the ability of your groundwater filters to filter contaminants out of different solutions.
Materials beakers, 750 mL (5) glucose solution glucose test paper graduated cylinder gravel metric ruler soda bottles, 2 to 3L (4) red food coloring sand soil stirring rod wax pencil optional contaminants: cooking oil, detergent, fertilizer, vinegar, soda optional filter materials: alum, charcoal
Exploration Lab:
MODELING
Groundwater Filters As surface water travels downward through rock and soil, the water is filtered and purified. As a result, the water in aquifers is generally cleaner than surface water. In this investigation, you will work in small teams to explore how layers of the Earth act as a filter for groundwater. You will make models of the Earth’s natural filtration system and test them to see how well they filter various substances.
Procedure 1. Label four beakers as follows: “Contaminant: glucose,” “Contaminant: soil,” “Contaminant: food coloring,” and “Water (control).” 2. Fill these beakers two-thirds full with clean tap water. Then add to each beaker the contaminant listed on its label. (The table on the next page shows how much of each contaminant you should use.) Stir each mixture thoroughly. 3. Copy the data table into your notebook. Carefully observe each beaker, and record your observations. Use some of the glucose test paper to test the glucose level in the glucose beaker. 4. Make four separate filtration systems similar to the one shown below. Your teacher will provide you with bottle caps that have holes poked through them. Fasten each cap to a bottle. Cut the bottom off of each soda bottle, and fill each bottle with layers of gravel, sand, and soil. Consider using the optional filter materials, such as alum or charcoal, but be sure to make each model identical to the next.
왘 Filter Apparatus Your ground filtration models should be layered as shown here.
298 Chapter 11 Exploration Lab
Copyright© by Holt, Rinehart and Winston. All rights reserved.
Observations of Substances in Surface Water Contaminant
Before filtration
Glucose (15 mL)
DO NOT WRITE IN THIS BOOK
Soil (15 mL) Food coloring (15 drops) Water (control)
After filtration
5. You are now going to pour each mixture through a filtration system. But first predict how well the filters will clean each water sample. Write your predictions in your notebook. 6. Stir a contaminant mixture in its beaker, and immediately pour the mixture through a filtration system into a clean beaker. Observe the resulting “groundwater,” and record your observations in the table you created. CAUTION: Do not taste any of the substances you are testing. 7. Repeat this procedure for each mixture. Clean and relabel the contaminant beakers as you go along.
Analysis 1. Analyzing Results Test the glucose-water mixture for the presence of glucose. Can you see the glucose? 2. Analyzing Results Was the soil removed from the water by filtering? Was the food coloring removed? How do you know?
Conclusions 3. Drawing Conclusions How accurate were your initial predictions? 4. Drawing Conclusions What conclusions can you draw about the filtration model and the materials you used?
왘 Step 6 Pour each sample of con-
taminated surface water through a filter.
Extension 1. Making Predictions Choose a substance from the materials list that has not been tested. Predict what will happen if you mix this substance in the water supply. 2. Evaluating Results Now test your prediction. Use the filter that was the control in the earlier experiment. How did your results compare with your prediction? 3. Analyzing Results Compare your results with the results of other teams. What precautions do you recommend for keeping groundwater clean?
Copyright© by Holt, Rinehart and Winston. All rights reserved.
Chapter 11 Exploration Lab 299
THE THREE GORGES DAM China’s Yangtze River is the thirdlongest river in the world after the Nile and the Amazon. The Yangtze River flows through the Three Gorges region of central China, which is famous for its natural beauty and historical sites. For thousands of years, the area’s sheer cliffs have inspired paintings and poems. This idyllic region seems like the sort of place that would be protected as a park or reserve. But in fact, it is the construction site for the Three Gorges Dam—the largest hydroelectric dam project in the world. When the Yangtze River is dammed, it will rise to form a reservoir that is 595 km (370 mi) long— as long as Lake Superior. In other words, the reservoir will be about as long as the distance between Los Angeles and San Francisco!
Benefits of the Dam The dam has several purposes. It will control the water level of the Yangtze River to prevent flooding.
About 1 million people died in the last century from flooding along the river. The damage caused by a severe flood in 1998 is estimated to cost as much as the entire dam project. The dam will also provide millions of people with hydroelectric power. China now burns airpolluting coal to meet 75 percent of the country’s energy needs. Engineers project that when the dam is completed, its turbines will provide enough electrical energy to power a city that is 10 times the size of Los Angeles, California. When the Yangtze’s flow is controlled, the river will be deep enough for large ships to navigate on it, so the dam will also increase trade in a relatively poor region of China.
Some Disadvantages The project has many drawbacks, however. The reservoir behind the dam will flood an enormous area. Almost 2 million people living in
왘 The reservoir that will form behind the Three Gorges Dam is shown
in yellow.
왘 The Three Gorges Dam is named
for the beautiful canyons it will flood. When completed, the dam may meet 20 percent of China’s energy needs with hydroelectric power.
the affected areas must be relocated—there are 13 cities and hundreds of villages in the area of the proposed reservoir. As the reservoir’s waters rise, they will also destroy fragile ecosystems and valuable archeological sites. Opponents of the project claim that the dam will increase pollution levels in the Yangtze River. Most of the cities and factories along the river dump untreated wastes directly into the water. Some people think the reservoir will become the world’s largest sewer when 1 billion tons of sewage flow into the reservoir every year.
Long-Term Concerns People have also raised long-term concerns about the project. The dam is being built over a fault line. Scientists question whether the dam would be able to withstand earthquakes that may occur along the fault. If the dam burst, towns and 300 Chapter 11 Points of View
Copyright© by Holt, Rinehart and Winston. All rights reserved.
cities downstream would be flooded. Another concern is that the dam may quickly fill with sediment. The Yangtze picks up enormous amounts of yellowish soil and sediment as it flows across China. When the river is slowed by the dam, much of the silt will be deposited in the new reservoir. As sediment builds up behind the dam, the deposited sediment will reduce the size of the reservoir—limiting the floodprevention capacity of the dam. In addition, productive farming regions below the dam will be deprived of the fertile sediment that is deposited every year when the river floods. The enormous reservoir may also cause disease among the local population. The potential heath risks include an increase in encephalitis and malaria. The most deadly disease spread by the Three Gorges Dam could be a parasitic disease called schistosomiasis.
Hidden Costs? Supporters of the dam claim that the project will cost $25 billion, while opponents claim that the costs will be closer to $75 billion. The true cost of the dam may never be known because corruption and inefficiency have plagued the project from the start. Controversy over the dam has prompted the U.S. government and the World Bank to withhold money for the project. Public opposition to the project has been silenced since the Tiananmen Square crackdown. But with help from private investment companies from the United States, the Chinese government is continuing with the project, and the dam is slowly being built. The world’s third-longest river will soon swell in the middle, and China will change along with it.
왘 Engineers discuss plans at the dam construction site. More than 20,000
people are working at the construction site.
왘 When the dam waters rise, these
ancient temples will be flooded.
What Do You Think? Hundreds of dams in the western United States provide electrical energy, drinking water, and food for crops, but the dams also flooded scenic canyons and destroyed ecosystems. Now that the environmental consequences of large dams are known, do you think that China should reconsider the Three Gorges Dam project?
Copyright© by Holt, Rinehart and Winston. All rights reserved.
Chapter 11 301