V I S I O N - B A S E D
L E A R N I N G
Visual Learning with Navigation as an Example Juyang Weng and Shaoyun Chen, Michigan State University
T
HE SUCCESS OF AUTONOMOUS navigation (or any sensor-based control system) depends largely on how much we can control the environment. In a controlled environment, we can define a few known landmarks (transponders, visual markers, and so on) before system design, and the navigation system can employ landmark detectors. Such navigation systems typically employ a model-based design method. However, as we show, these methods have difficulties dealing with learning in complex, changing environments. Model-free design methods present a potentially powerful alternative. To overcome the limitations of modelbased methods, we have developed Shoslif (Self-organizing Hierarchical Optimal Subspace Learning and Inference Framework), a model-free, learning-based approach. Shoslif belongs to the class of appearancebased methods, which apply statistical tools directly to normalized image pixels.1,2 Shoslif introduces mechanisms such as automatic feature derivation, a self-organizing tree structure to reach a very low logarithmic time complexity, one-instance learning, and incremental learning without forgetting prior memorized information. In addition, we’ve created a state-based version of Shoslif that lets humans teach robots to use past history (state) and local views that are useful for disambiguation. Shoslif-N, which we started developing in SEPTEMBER/OCTOBER 2000
THE STATE-BASED LEARNING METHOD PRESENTED HERE IS APPLICABLE TO VIRTUALLY ANY VISION-BASED CONTROL PROBLEM. THE AUTHORS USE NAVIGATION AS AN EXAMPLE. THE SHOSLIF-N NAVIGATION SYSTEM AUTOMATICALLY DERIVES, DURING TRAINING, THE VISUAL FEATURES THAT ARE BEST SUITED FOR NAVIGATION. USING SYSTEM STATES ENABLES SHOSLIF-N TO DISREGARD UNRELATED SCENE PARTS AND ACHIEVE BETTER GENERALIZATION. 1994, is a prototype autonomous navigation system using Shoslif. We have tested ShoslifN primarily indoors, because our robot’s Helpmate drivebase runs only on flat surfaces. Indoor navigation encounters fewer lighting changes than outdoor navigation. However, it offers other, considerable challenges for vision-based navigation. Such challenges include a large variation in scenes, the lack of stable prominent local features, the lack of stable global contrast regions, and other optical phenomena such as the ubiquitous specularity (mirror-like surface) of waxed floors and painted walls. Shoslif-N has shown that it can navigate in real time reliably in an unaltered indoor environment for an extended amount of time and distance, without any special image-processing hardware. 1094-7167/00/$10.00 © 2000 IEEE
The problem with modelbased methods As an example of the application of a model-based method, consider road following. For a road vehicle to automatically follow a road or a marked lane, the system designer must first model the driving environment (world). For example, you can model a single-lane road as a stretch of uniform intensity of a certain shape with a high contrast between the road and nonroad areas. This modeling task becomes extremely challenging when the driving environment is less controlled. For instance, the environment might include multiple lanes, a driving surface marked with traffic signs, roads with tree 63
Related work Several experimental road-following systems have used modelfree design methods. Two such systems are Carnegie Mellon’s Alvinn1 and the University of Maryland’s Robin.2 For its learning architecture, Alvinn used a multilayer feed-forward network, trained by a back-propagation learning algorithm. Robin used a radial basis function network with hand-selected centers for the radial basis functions. RBFN reportedly achieved smoother behavior than MFFN in a road-following experiment.2 Both systems used offline batch learning (see “Incremental online learning” in the main article). MFFN uses the training set to tune the network’s size parameters, including the number of hidden nodes. RBFN uses the training set to tune the number of radial basis functions and the center of each radio basis function. Each additional environment situation requires retraining the
shadows, or rainy or snowy conditions. Other driving tasks require more than just a road-following capability, such as driving a forklift in a warehouse, a cart in an airport building, or a wheelchair during everyday indoor and outdoor use. Manually modeling every possible case and designing a reliable case detector for all possible cases become intractable. In addition, the human designer must analyze all the visual scenes that the vehicle might encounter and then develop a model for each scene. Each model characterizes the corresponding type of scene content and defines a set of type-specific parameters to be determined through experiments. For example, two straight lines in the image plane model a straight single-lane road, and two quadratic curves model a smooth-turning single-lane road. The lines’ and curves’ parameters are the roads’ parameters. Figure 1 illustrates such a model-based
entire network and retuning the manually selected parameters. Both MFFN and RBFN are stateless networks. Unlike Shoslif, MFFN and RBFN are not appearance-based methods because they do not use statistical tools to derive feature subspaces. For example, they do not use the covariance of the input vector. References 1. D.A. Pomerleau, “Efficient Training of Artificial Neural Networks for Autonomous Navigation,” Neural Computation, Vol. 3, No. 1, Jan. 1991, pp. 88–97. 2. M. Rosenblum and L.S. Davis, “An Improved Radial Basis Function Network for Visual Autonomous Road Following,” IEEE Trans. Neural Networks, Vol. 7, No. 5, June 1996, pp. 1111–1120.
approach. As the figure indicates, unless the scene with which we’re dealing is very restricted, a single model is insufficient. So, this approach uses multiple models, which requires a model selector. The model selector determines which model is the most appropriate given the current scene. To avoid catastrophic accidents due to unpredicted visual scenes, this approach requires an applicability checker. The applicability checker determines whether the current scene fits one of the models with a sufficient confidence. The model-based approach has these advantages: • The system design uses specific human
knowledge about the environment, so the system can be efficient for predictable cases. • Because a human designer explicitly writes the control algorithms, humans can
Model 1 Applicability checker
Model selector
Model 2
Model-specific rules
Model-specific Control signal control
Figure 1. The model-based approach to navigation control. Dashed lines indicate that the human must create the corresponding module’s content during system design and development. 64
It has these disadvantages: • The human-designed models are restric-
tive; they are not always applicable in a more general setting. • The applicability checker, which is crucial for a safe application, is difficult to develop because it must be able to deal with virtually any scene. • This approach requires a potentially huge number of models, unless the scene is very well known. An everyday real-world traffic situation might require potentially tens of thousands of complex models. Designing and fully testing all these models takes considerable effort. Furthermore, the model selector and applicability checker become increasingly complex, unreliable, and slow when the number and complexity of the models increase.
Model-free methods
Model n Sensory input
interpret them more easily. (For example, the programmed behavior “When the reading from the front range detector is less than 0.5 meters, back up” is easier to interpret than an artificial neural network’s weights.) • Computational requirements are lower because, given a scene model, this approach processes only a relatively small part of an image in a specific way.
Model-free methods lack any predefined model of the driving environment during system design. In other words, a human programmer does not specify any environment model, either explicit or implicit; the system itself must automatically derive the model. IEEE INTELLIGENT SYSTEMS
Vector representation for an image In model-free methods, we consider the vision-based navigation controller as the function Yt+1 = f(Xt).
(1)
Xt is a vector consisting of all the sensory inputs at time t with possibly other navigational instructions at time t (such as the desired heading direction at an intersection). Yt+1 is a vector consisting of the desired vehicle control signal at time t + 1. Without loss of generality, we have assumed discrete time instances: t = 0, 1, 2, .... The challenge of model-free learning is to construct an approximate function f^so that f^(X) is very close to the desired output f(X) for all the possible X inputs. To accomplish this goal, we use a set of training samples L = {(Xi, f(Xi)) | i = 0, 1, ..., n}, which come from either synthetically generated inputs or the real sensory inputs. We use this set to train a system implemented by some learning architecture. For a look at two other model-free methods, see the “Related work” sidebar.
We can represent a digital image with r pixel rows and c pixel columns by a vector in (rc)-dimensional space S without any information loss. For example, we can write the set of image pixels {I(i, j) | 0 ≤ i < r, 0 ≤ j < c} as a vector X = (x1, x2, L, xd)t where xri+j+1 = I(i, j) and d = rc. The actual mapping from the 2D position of every pixel to a component in the d-dimensional vector X is not essential but is fixed once it is selected. Because the pixels of all the practical images can only take values in a finite range, we can view S as bounded. If we consider X as a random vector in S, the corresponding element of the covariance matrix Σx of X represents the cross-pixel covariance. Using this vector representation, our appearance-based method considers the correlation between any two pixels in Σx, not just between neighboring pixels.
Building trees. Shoslif uses a tree approximator; Figure 3 illustrates the concept. In that figure, the bounded space S is twodimensional. To characterize the distribution of the training samples shown in Figure 3a, the tree approximator automatically generates the recursive partition tree (RPT) in Figure 3b.3 Statistical researchers call such a tree that outputs numerical values a regression tree.4 In the tree, each leaf node represents a
array. However, the system makes no assumption that the world is 2D. For the same reason, the human retina is 2D, but humans perceive a 3D world. What matters is how the 2D information is mapped to perception and actions. So, as we explained earlier, the learning task is to efficiently approximate function f, which maps space S into space C, using an appropriate architecture.
Control signal Learner (learning mode)
Sensory input
Sensory input
Learner (performance mode)
Control signal
Learning-based navigation control Because a learning-based approach (see Figure 2) such as Shoslif uses a model-free design method, it relieves the human designer from hand-developing world models. (A method that uses some learning techniques is not necessarily free of world models. For example, a line-fitting method estimates the predefined line parameters based on a set of observed image points. However, a line model for an image is a specific aspect of a world model.) In this approach, the learning system deals with raw image input directly, so its image representation must be very general. We consider a digital image X of r rows and c columns as a point in a rcdimensional space S (see the sidebar, “Vector representation for an image”). For example, for images of size 30 × 40, S has a dimensionality of 30 × 40 = 1,200. The control signal vector Y, which might contain navigation signals such as heading direction and speed, is a point in the output space C. We perform a normalization so that the average intensity is zero and the variance of pixels of the image is a unit; the system uses the resulting image pixel SEPTEMBER/OCTOBER 2000
Memory
Memory
(a)
(b)
Figure 2. The learning-based approach to navigation control: (a) the learning phase; (b) the performance phase. The dashed lines indicate that the human must create the corresponding module’s content during learning.
0,1
2,8
1,2
1,3
2,7 2,10
2,2 2,3
2,4 0,1 2,5
1,1
1,2
1,3
1,4
1,5
1,4 1,5
(a)
2,1 2,2 2,3 2,4 2,5 2,6 2,7 2,8 2,9 2,10
(b)
Figure 3. The Shoslif tree approximator: (a) A 2D view of the partition. A label indicates a cell’s center. Because of position overlap, the figure does not show the child’s label if the parent covers the child. A number pair i,j marks each training sample X in space S; i is the level number and j the child number in the (b) corresponding resulting recursive partition tree. 65
Principal-component analysis This method computes an orthonormal basis from a set of sample vectors.1 Computationally, it computes the eigenvectors and the associated eigenvalues of the sample covariance matrix Γ of the samples. When the number of samples n is smaller than the dimensionality d of the sample vectors, we can compute the eigenvectors and eigenvalues of a smaller n × n matrix instead of a large d × d matrix. Reference 1. K. Fukunaga. Introduction to Statistical Pattern Recognition, 2nd ed., Academic Press, New York, 1990.
single training sample (X, Y) = (X, f(X)) (or a set of nearby training samples in S that have the same control vector Y). Given an unknown input image X′, Shoslif uses the RPT to find the nearest X among all the training samples. It then uses the corresponding control vector Y = f(X) stored in the corresponding leaf node as the next control vector. In practice, we preprocess an image represented by a vector X. First, we perform the normalization mentioned earlier by transforming the value of every pixel by a linear function. This reduces the effect of the lighting’s absolute brightness and the global contrast. Time complexity motivated us to use a tree for finding the match. Given an unknown input, finding the nearest neighbor from a set of n samples using linear search requires O(n) time, which is impractical for real-time navigation with even a moderately large n. The time complexity for retrieving the output from an RPT with n stored samples is O(log(n)). This scheme tends to build trees that are roughly balanced, as we see in the section “Automatic feature derivation.” Also, we do not need to store every training sample, as we see in the section “Incremental online learning.” The learning phase. We discuss the batch learning method here; we look at incremental learning later. Batch learning requires that all the training samples are available before the training starts. In the learning phase, the approximator generates an RPT based on the training data set. The RPT serves as the memory in Figure 2. The RPT’s root represents the entire input space S. The approximator analyzes the training set L, dividing the space S into b (b > 1) cells, each represented by a child of the root. We define the mean of the samples falling into each cell as that cell’s center, as marked in Figure 3a. The analysis involves automatic derivation of linear features, each of which corresponds to the normal of a hyperplane in Figure 3a. (We 66
discuss the feature derivation for each nonleaf node in “Automatic feature derivation.”) The analysis proceeds this way recursively, based on the samples falling into each cell, to subdivide the cell into smaller cells. Such a recursive partition proceeds for each node until the resulting node contains only one sample or several samples that all have virtually the same output vector Y. The performance phase. In this phase, the learning-based approach grabs the current input image X′ and uses it to retrieve the control signal from the RPT. To do this, it examines the center of every child of the root. In the same way, it further explores the cell whose center is closest to X′ recursively until it reaches a leaf node. Then, it uses the corresponding Y vector stored in the leaf node as the resulting control vector for X′. The faster our approach can search the RPT this way, the faster it will update the control parameters. To speed up the processing, we use a binary RPT (b = 2), taking into account the computation in each node and the tree’s depth. To reduce the chance of missing the best-matched leaf node, we explore k > 1 paths down the tree, instead of the single-path exploration we described earlier. At each level of the tree, our modified approach explores the top k cells and compares their children, kb of them in general, to find the top k nearest centers. Finally, it finds k leaf nodes. The output control vector is the weighted sum of all the corresponding Y vectors of these leaf nodes. A faraway leaf node uses a smaller weight than the near ones. So, faraway leaf nodes do not affect the output vector much. Automatic feature derivation. Automatic feature derivation is different from feature selection or feature extraction. Feature selection selects a few features from a set of human-defined features. Feature extraction extracts selected features (for example, edges and color) from images. Automatic feature derivation must derive features from high-
dimensional raw vector inputs. The programmers program rules for deriving features, but not the actual features. The dimensionality of the image space S is large, typically larger than the number of training images. For effective space partition, finding the subspace S′ in which the training samples lie is useful. Principal-component analysis5 is appropriate for this purpose. Figure 4a shows how we use PCA to partition the space S recursively on the basis of the training samples points. In Figure 4a, various symbols in the entire space S represent samples. Suppose we use n samples, from which PCA computes n principal component vectors V1, V2, ..., Vn in S, ranked by the decreasing eigenvalues (see the sidebar, “Principal-component analysis”). Given a number m (m ≤ n), we call the top m vectors the most expressive features because they best explain the variation of the sample distribution. Each MEF vector corresponds to an image. The first principal component vector V1 indicates the direction with the most significant variation for the samples in S. We need only to compute a single MEF V1 for the binary RPT construction. Put geometrically, we determine a hyperplane that has V1 as its normal vector and that goes through the centroid of the samples. This plane defines the level-0 splitter that partitions the corresponding cell (root). The samples that fall on one side of the splitter are assigned to the root’s left child; the samples falling on the other side go to the right child. In Figure 4a, the thickest line indicates the hyperplane, partitioning the entire space into two cells. The PCA for each child uses the samples that fall into the cell represented by the child. However, if we know the class information of the training samples, we can generally do better. The symbols of the same type in Figure 4a denote input images associated with the same control vector—that is, belonging to the same class. The MEF-based recursive partition in Figure 4a does not give an ideal partition, because the partition’s boundaries do not cut along the class boundary. For example, the normal of the thickest line does indicate the sample cluster’s long axis, but the long axis does not necessarily align with most class boundaries, as Figure 4a indicates. Consequently, the resulting tree is larger than necessary. The main reason for this phenomenon is that such an MEF-based recursive partition does not use the class information in the training samples. How do we define classes for navigation IEEE INTELLIGENT SYSTEMS
Linear discriminant analysis control? For example, we can predivide the training samples into different classes, according to the scene’s type (for instance, a straight passageway or a corner) and the desired control signal in each type (for instance, heading increments of 10o, 5o, 0o, −5o, or −10o). We can use these preclassified training samples to more effectively partition the sample space (see Figure 4b), using multiclass, multidimensional linear discriminant analysis (see the related sidebar). LDA computes the basis of a linear subspace of a given dimensionality so that, projected onto the linear subspace,
Ronald Aylmer Fisher developed linear discriminant analysis to discriminate two classes; researchers have extended the result to more than two classes. LDA defines two matrices from the preclassified training samples: the within-class scatter matrix W and the between-class scatter matrix B. It computes a basis of a linear subspace of a given dimensionality in S so as to maximize the ratio of the between-class scatter over the within-class scatter in the subspace. This basis defines the MDF (most discriminating feature) vectors. Computationally, these vectors are the eigenvectors of W−1B associated with the largest eigenvalues.1 When W is a degenerate matrix, we can perform LDA in the subspace of principal-component analysis (see the related sidebar). Reference 1. K. Fukunaga. Introduction to Statistical Pattern Recognition, 2nd ed., Academic Press, New York, 1990.
• samples of different classes are far apart
as much as possible, and • the average size of clusters of samples
from the same class is constant. We call the top basis vectors the most discriminating features. As in the MEF case, the binary RPT needs only a single MDF vector; this vector gives the hyperplane’s normal. First, we compute the first MDF as the splitter of the root, given all the preclassified samples. Then, also as in the MEF case, the samples that fall on one side of the hyperplane go to the left child and the other samples go to the right child. We perform LDA for each child on the basis of the samples each has received. This process continues until each cell contains only samples of the same class. Figure 4b shows the recursive partition represented by the MDF RPT. The partition boundary tends to cut along the class boundary, resulting in a tree much smaller than the
MEF RPT in Figure 4a. Such a concise tree not only enables faster retrieval but also tends to approximate the class boundary better. Figure 5 shows sample training images collected by Michigan State University’s ROME (robotic mobile experiment) robot inside the MSU Engineering Building. In one of our tests, we used 210 images along a straight corridor and 108 images at a corner, grouped into six classes. The first five classes are straight corridors classified according to the next heading direction needed to recover the correct heading—that is, Class 0 for 10o, Class 1 for 5o, Class 2 for 0o, Class 3 for −5o, and Class 4 for −10o. Class 5 consists of the 108 corner images. Figures 6a and 6b show the first five of the computed MEFs and MDFs. The MEFs mainly record large areas of contrast, while MDFs record locations of edges with increasing spatial resolutions. These MEFs and MDFs play the same role that traditional edge
** *** * *
** *** * * *
*
-
-
--
+
+
+
+ @
+
@
+ + @@ + @@
+
+ + +
--
+
+
+ + @ + @ + @@ + @@
@
(a)
-
-
+
+
*
*
+
+ +
+
+
+ + +
+
+ @
(b)
Figure 4. Recursive partitions represented by (a) the MEF (most expressive feature) binary tree and (b) the MDF (most discriminating feature) binary tree, which is smaller. Symbols of the same type indicate samples of the same class.
SEPTEMBER/OCTOBER 2000
detectors (for example, the Laplacian-ofGaussian operator) do. However, they are much better because they are not local (not just single edges, but a combination of edges) and are optimal (expressiveness for MEF or disciminativeness for MDF). Figure 6c shows the training samples projected onto the subspace spanned by the first two MEFs, and Figure 6d shows those corresponding to the first two MDFs. In the MEF subspace, each class’s samples spread out widely, and the samples of different classes tend to mix together. But in the MDF subspace, each class’s samples are clustered more tightly, and the samples from different classes are farther apart. From Figure 6, we can see that for classifying an unknown image from the same environment using the nearest-neighbor rule, the MEF subspace is not as good as the MDF subspace.
Shoslif with states In the previous section, we explained a stateless system. Because the visual variation among views can be very large, such a stateless system is sufficient only for relatively benign scenes. Why states? In principle, the nearest-neighbor rule will perform well as long as we use enough samples to cover all the cases with sufficient density. MDFs can disregard unrelated parts of the image, if enough of the provided images show that the parts are indeed unrelated. However, in practice, providing all the necessary images is impossible. For example, if the navigation scene contains a big poster on a wall and that poster changes every day, training the system for all the possible posters is impractical. (Vision-based navigation is much more difficult than range67
(a)
(b) Figure 5. Sample learning images: (a) a straight corridor; (b) a left turn.
based navigation that uses, for example, laser range finders.) Therefore, a monolithic treatment of an input image significantly limits the generalization power. So, our objective is to train the system to actively pay attention to critical parts of the scene—landmarks—according to each situ-
ation, and to disregard unrelated parts in the scene. For learning-based methods, using landmarks is not trivial. We must systematically incorporate the attention selection mechanism into the learning system instead of explicitly programming it into a navigation program. This is because of human lim-
itations in deriving rules for complex attention selection. States. We define a system state vector St at each time t. This state keeps information about the context needed for task execution. For example, the information about attention
(a)
(b)
MEF2
1
0
2 5 3
–500
0 0 0 0 0 1 1 0 0 00 0 1 0 1 0 0 00 50 1 1 0 0 001 0 55255 0 0 0 0 1 1 0 1 1 5 055 5 10 0 1 1 1 51 5 1150 1201 1 10 1 0011 2501 5 1 0 1 1 0 5 2 5525 21 2551525 322 5 1 2 2 0 1 525 53555 2 1 5 01 125 555 255 555 1 1 1 2 2 1 2 22 2 2 1 5 5 5 3 2 2 23 553 53 3335 55435 2 2 3 2 2 35 5 55 444 54 5 55 2 55 2 523 52 5 5 4 5 4 2 5 4 5 5 3 3 23 2 2 3 5 44 5 3 3 55 3 2 2 5 33 5555455 3 5 3 33 4 4 4 5 5 45 23 555 5 33 3 3 4 43 4 55 3 3 3 5 44 34 4 44 55 3 4 3 4 55 4 44 3 4 4 4 55 5 4 44 55 4 4 4 3 4 4 4
5 5
–1,000
(c)
5
–500
50
0
–50
–100
55
0 MEF1
5
100
MDF2
0
500
500
2 2 2 2 2 222222 3 3 22 2 2 2 2222 22 2 333 2 2 2 2 2 2 22 2 3 33 3 2 2 2 3 3 333 3 1 3 2 22 3 33 3 3 3 3 1 1 33 3 3 3 3 3 333 3333 3 1 11 1111 1 1 1 1 1 3 1 3 1 1 1111 11 11 1 1 11 11 1 1 1 1 11 1 1 0 00 000 0000 5 0 0 0 0000000 00 00 0 0 00000 0 00 0 0 5 5 5 00 00 55 5 5 55 5 5 55 5 5 55 5 5555 5 555 5555555 5 5 5 5 55 5 555555 55555 5 55555 5 5 5 555 555555 55 5 5 5 5 55 5 5 55 5 5 5 55 55 5 55 5 5
–100
(d)
0
4 4 44 44 4 4 4 44 4 444 4 4 4 4 4 44444 4 4 4 4 4 44 4 4 44 4 4
4
4
5
100
200
MDF1
Figure 6. The difference between MEFs and MDFs in representing learning samples from a straight corridor and a corner. The first five (a) MEFs and (b) MDFs of the learning set. Each MEF is a vector in the space S, the space of all possible images. Each MEF and MDF is a weighted sum of all the training images and is automatically derived. The bottom graphs illustrate the learning samples projected onto the subspace spanned by the first two (c) MEFs and (d) MDFs. The numbers in the plot space are the class labels of the learning samples. 68
IEEE INTELLIGENT SYSTEMS
action is a part of the state. In scenes that require visual attention, the system moves into the particular state defined for that attention need. At the next time instant, the system directs its visual attention to a part of the view, as a learned behavior depending on that state. The attention’s relative position can also be associated with the state. Symbolically, at time t, the system is at state St and observes image Xt. It gives control vector Yt+1 and enters the next state St+1. So, we can represent the corresponding mapping as (St+1, Yt+1) = f (St, Xt)
(2)
where Yt+1 includes the attention control parameters. The formulation in Equation 2 would correspond to a finite-state machine if the number of states were finite. However, this is not the case, because the state space and the sensory input space are both continuous. The programmer designs the vector representation of each state in the state space, but Shoslif automatically derives the composite features that it uses to analyze the combined space of St, Xt. So, we consider state St and input Xt as random, to take into account the uncertainty in these observations and estimates. This results in an observationdriven Markov model (ODMM).6 Computational considerations. However, we must avoid the computationally intractable task of estimating the high-dimensional distribution density conditioned on the current state and observation. Fortunately, Shoslif effectively approximates the mean of (St+1, Yt+1) given the estimated (St, Xt) using training samples. We can still consider the mapping in Equation 2 as a mapping from input (St, Xt) to output (St+1, Yt+1). The fundamental difference between this state-based Shoslif and the stateless version is that statebased Shoslif uses a part of output St+1 at time t as a part of the input at time t + 1. Figure 7 shows several types of corridor segments on the third floor of MSU’s Engineering Building. For our experiments, the trainer created several states corresponding to some of these segment types. A special state A (ambiguous) indicates that local visual attention is needed. The trainer defined this state for a segment right before a turn. In this segment, the image area that revealed the visual difference between different turn types (that is, a landmark) was mainly in a small part of the scene. The local SEPTEMBER/OCTOBER 2000
ficult. So, a batch learning method requires repeated cycles of collecting data, training, and testing. The limited space available to store training images and the need for more images for better performance are two conflicting factors. Thus, experience has taught us that collecting a sufficiently rich yet small set of training samples is tedious. Furthermore, batch learning must occur offline, because processing the entire training set takes considerable time. With an incremental learning method, training samples are available only one at a time. This method discards each sample as soon as it is used for training. The required stream of training samples is typically so long that the number of samples is virtually
attention action in A directs the system to look at such landmarks through a prespecified image subwindow so that the system issues the correct steering action before it is too late. Figure 8 shows the states and their transitions, which the trainer teaches Shoslif incrementally and online. Incremental online learning. Learning methods fall into two categories: batch or incremental. As we mentioned before, a batch learning method requires that all the training data are available at the same time when the system learns. Figuring out beforehand how many and what kinds of training images we need to reach a required performance level is dif-
Ll
Lr
Zl
Zr
T
X
S
Figure 7. Different types of corridor segments in an indoor environment.
S/g
L l /g
L r /g
Z l /g
Z r /g
A /a
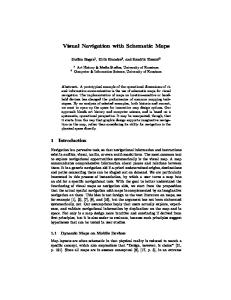
Figure 8. An observation-driven Markov model for indoor vision-based navigation. The label of the form x/y denotes a state x with associated attention action y. Actions a and g denote local-view and global-view attentions, respectively. At each state, the transition to the next state depends on the image view, either local or global, indicated by the attention action. Each arrow corresponds to a very complex set of image appearances learned by Shoslif-N. In our experiments, we taught our robot to turn in a specific direction at each intersection. However, the robot must disambiguate each current situation from many other perceptually similar but physically different situations, based on the current visual input and estimated state. 69
infinite. In incremental learning, many similar samples are not stored at all if they are found very close to a stored element. In other words, the system can look at a spot for a long time, but the memory does not grow. With a batch method, all those similar images of the same spot must be stored first. So, batch learning is not practical for very long training streams. We have developed an incremental-learning version of Shoslif. This version builds the RPT incrementally online. During training, the human operator controls the navigator through a joystick. At each time instant, Shoslif grabs an image from the camera and uses it to query the current RPT. If the difference between the current RPT’s output and the desired control signal (given by the human operator) is beyond a prespecified tolerance, Shoslif learns the current sample to update the RPT. Otherwise, it rejects the image case without learning it. This selective-learning mechanism effectively prevents redundant learning, keeping the RPT small. This incremental-learning mode also makes learning convenient. As soon as the system rejects most of the recent training samples at a given location, we know that we can move to other locations. Little time is wasted. As long as the system has rejected most samples at all locations, we can set the system free to navigate on its own.
Experimental results A major issue of visual learning is how well Shoslif compares with other constrained-search methods such as regression trees and neural networks. We discuss our comparison experiments before presenting the results of our navigation tests. Shoslif versus other methods. AI research on methods using classification and regression trees has been extensive. The book by Leo Breiman and his colleagues gives a balanced exposition.4 However, in statistics, available samples for statistical decisions are typically human-provided feature vectors where each component corresponds to the measurement of a meaningful parameter. Consequently, each node there uses only one component of the input vector. We face the challenging problems of dealing with highdimensional input such as images or image sequences, where each component corresponds to a pixel. Univariate trees (based on 70
a single component at a time), such as CART and C5.0, or multivariate trees for lowerdimensional data, such as OC1, certainly were not designed for high-dimensional, highly correlated data. Our method uses all input components at each node to derive features that utilize the information of correlation among input components, not just a single component. In our tests using highly correlated Feret image data sets (5,632-dimensional), we obtained these error rates: CART, 41%; C5.0, 41%; OC1, 56%; and our incremental Shoslif tree, 0.00% (perfect). The error rates of our prior versions of the Shoslif tree range from 3% to 7%. (The error rates of CART, C5.0 and OC1 are comparable with Shoslif only
THE RESULTING ISSUE IS HOW TO ENABLE THE MACHINE LEARNER TO AUTOMATICALLY GENERATE INTERNAL REPRESENTATION ONLINE IN REAL TIME.
in tests for lower-dimensional data sets) Because the Shoslif RPTs perform automatic feature derivation, they are more than just classification and regression trees. In our previous work, we compared Shoslif with feedforward neural networks and radial basis function networks for approximating stateless appearance-based navigation systems.7 We selected the best FFN from 100 FFNs, each with a random initial guess. FFNs performed the worst. RBF was slightly better than FFN, but only when humans, using human vision, manually selected its centers. Shoslif performed significantly better than FFNs and RBFs. Navigation tests. We have tested the statebased Shoslif-N navigator on our ROME robot (see Figure 9) with a single video camera, without using any other sensor. A slow, onboard Sun Sparc-1 workstation with a SunVideo frame grabber performed the computation, without any special-purpose imageprocessing hardware. We trained ROME online and interactively, on the third floor of
our Engineering Building. After the system accepts 272 samples to update the tree, it can navigate on its own. It successfully extended its experience to many hallway sections where we had not trained it. The refresh rate is 6 Hz, meaning that the system processes six image frames and performs six state-transitions with the trained RPT per second. We have conducted many test runs to observe the trained robot’s performance stability. Moving at 40 to 50 millimeters per second, ROME finished one large loop in our building in approximately 20 minutes. Figure 10 shows a few frames from a video of the robot roaming during a test. As Figures 5 and 10 illustrate, the scene presents very severe specularities and a wide variety of floor tile patterns. The corridor structure changes drastically from one spot to another. Our prior stateless system could only navigate correctly through approximately onequarter of the long loop. The state-based system can now reliably cover the entire loop. ROME continuously roamed for longer than five hours until the onboard batteries became low. It has performed flawlessly in dozens of such tests, in the natural presence of passersby. Our experiment also demonstrated that if we do not use states, the robot will run into walls during complex turns.
A
S WE’VE SHOWN, OUR LEARNing method does not require human programmers to program information that is specific to the environment (such as indoors or outdoors) and the actions (such as heading direction or arm joint increments). In fact, we have also used this method for other tasks, such as face recognition, hand gesture recognition, speech recognition, and vision-based robot arm action learning.3 These tasks can be learned reliably if the environment, although very complex, does not vary too much. If the number of environment types increases, the number of required states will also increase. So, defining internal states for training can become overwhelming for humans. The resultIEEE INTELLIGENT SYSTEMS
ing issue is how to enable the machine learner to automatically generate internal representation online in real time—that is, to fully automate the learning process. Some work in this direction has been reported.8
5. K. Fukunaga. Introduction to Statistical Pattern Recognition, 2nd ed., Academic Press, New York, 1990. 6. D.R. Cox, “Statistical Analysis of Time Series: Some Recent Developments,” Scandinavian J. Statistics, Vol. 8, No. 2, June 1981, pp. 93–115. 7. J. Weng and S. Chen, “Vision-Guided Navigation Using Shoslif,” Neural Networks, Vol. 11, Nos. 7–8, Oct./Nov.1998, pp. 1511–1529.
Acknowledgments National Science Foundation grant IRI 9410741 and Office of Naval Research grant N00014-951-0637 supported this work. We thank Yuntao Cui, Sally Howden, and Dan Swets for discussions and development of Shoslif subsystems.
References 1. M. Kirby and L. Sirovich, “Application of the Karhunen-Loève Procedure for the Characterization of Human Faces,” IEEE Trans. Pattern Analysis and Machine Intelligence, Vol. 12, No. 1, Jan. 1990, pp. 103–108. 2. M. Turk and A. Pentland, “Eigenfaces for Recognition,” J. Cognitive Neuroscience, Vol. 3, No. 1, Jan. 1991, pp. 71–86. 3. J. Weng, “Cresceptron and Shoslif: Toward Comprehensive Visual Learning,” Early Visual Learning, S.K. Nayar and T. Poggio, eds., Oxford Univ. Press, New York, 1996, pp. 183–214. 4. L. Breiman et al., Classification and Regression Trees, Chapman & Hall, New York, 1993.
8. J. Weng et al., “Developmental Humanoids: Humanoids that Develop Skills Automatically,” Proc. First IEEE-RAS Int’l Conf. Humanoid Robotics (CD-ROM), IEEE Press, Piscataway, N.J., 2000.
Juyang Weng is an associate professor in the Department of Computer Science at Michigan State University. His research interests include mental development, computer vision, autonomous navigation, and human–machine interfaces using vision, speech, gestures, and actions. He is an originator and proponent of a new research direction called developmental robots—robots that can autonomously develop cognitive and behavioral capabilities through online, real-time interactions with their environments through their sensors and effectors. He received his BS from Fudan University, Shanghai, China, and his MS and PhD from the University of Illinois, Urbana-Champaign, all in computer science. Contact him at 3115 Eng. Bldg., Dept. of Computer Science and Eng., Michigan State Univ., East Lansing, MI 48824-1226;
[email protected]; www.cse.msu.edu/~weng. Shaoyun Chen works on wafer inspection at KLA-Tencor. Previously, he worked on active vision and iris recognition at Sensar. His major interests lie in computer vision, image processing, pattern recognition, and their applications, includ-
Figure 9. The ROME (robotic mobile experiment) robot, which Shoslif-N controls.
ing fingerprint recognition and iris recognition. He received his BS from Xiamen University, his ME from Tsinghua University, China, and his PhD from Michigan State University, all in computer science. Contact him at KLA-Tencor Corp., Bldg. I, Mailstop I-1009, 160 Rio Bobles, San Jose, CA 95134;
[email protected].
(a)
(b)
(c)
(d)
(e)
(f)
(g)
(h)
Figure 10. Controlled by the state-based Shoslif-N, ROME navigates autonomously: (a)–(e) behind ROME; (f)–(h) in front of ROME. SEPTEMBER/OCTOBER 2000
71