rd
PLEA2006 - The 23 Conference on Passive and Low Energy Architecture, Geneva, Switzerland, 6-8 September 2006
Urban Form, Density and Solar Potential Vicky Cheng1, Koen Steemers1, Marylene Montavon2 and Raphaël Compagnon3 1
Department of Architecture, The Martin Centre, University of Cambridge, UK Solar Energy and Building Physics Laboratory (LESO-PB), Ecole Polytechnique Fédérale de Lausanne, Switzerland 3 University of Applied Sciences of Western Switzerland, Ecole d'Ingénieurs et d'Architectes de Fribourg, Switzerland
2
ABSTRACT: Rapid urbanization in recent years has exerted tremendous pressure on urban development. In the face of the largely unexamined fashion for densification, it is vital that the environmental impact of compaction be researched. This study comprises solar simulation of eighteen generic models; each represents a particular combination of built form and density. This paper examines the relationships between built forms, density and solar potential, with reference to three design criteria i.e. openness at ground level, daylight factor on building façade and PV potential on building envelope. The result shows the different effects of horizontal and vertical randomness on urban solar potential and it also reveals the interrelation between randomness, plot ratio and site coverage, which can provide helpful insights for planning solar cities. Keywords: Urban Form, Density, Solar Potential
1. INTRODUCTION 1.1 Background The study was initiated by a research project concerning the sustainable urban design for São Paulo, Brazil. In the earlier stage of the project, the authors conducted a study to investigate the diverse influences of built density on urban daylight access and solar potential. The findings suggested that the two manifestations of density, i.e. plot ratio and site coverage, do have different effects on the potential of urban solar resources. The results revealed that quantities such as daylight factor, sky view factor and solar potential on roofs are more dependent on plot ratio, whilst the solar potential on building façade is more related to site coverage and the degree of horizontal obstruction. Most interestingly, the study also demonstrated the possibilities to increase usable floor area and plot ratio without undermining the opportunities of daylight and solar applications. [1] This paper furthers the discussion by providing a more systematic and comprehensive evaluation of the relationships between urban built form, density and solar potential. It comprises solar simulation of eighteen generic models; each represents a particular combination of built form and density. Parametric analysis has been carried out based on the results of simulation and the effects of each urban form and density parameter have been thoroughly evaluated. 1.2 Methodology The study is parametric in approach, with eighteen generic models representing a range of built forms and densities, compared for daylight performance and solar potential. These generic models can be
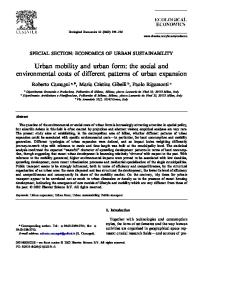
categorized into four different built forms, three classes of plot ratio and two classes of site coverage. The four built forms correspond to different horizontal and vertical layouts, either uniform or random as illustrated in Figure 1. The form of a model is denoted by an expression (H, V), where H represents the horizontal layout and V represents the vertical layout. Hence, the four categories of built forms are: (uniform, uniform), (uniform, random), (random, uniform) and (random, random).
Figure 1: Horizontal and vertical urban layouts Densities are examined in two ways, i.e. plot ratio and site coverage: plot ratio is defined as the ratio of total floor area to site area, and site coverage is the ratio of building footprints to site area. Plot ratios representing three classes of density have been chosen for the study, and they are 1.4 for low density, 3.6 for medium density and 7.2 for high density. On
rd
PLEA2006 - The 23 Conference on Passive and Low Energy Architecture, Geneva, Switzerland, 6-8 September 2006
the other hand, two classes of site coverage have been studied; they are correspondingly 9% for low coverage development and 36% for high coverage development. Table 1 summarizes the eighteen cases included in this study. The assessment of daylight and solar potential are purely based on computer simulation. A solar simulation tool named PPF has been applied for daylight and solar radiation modelling; PPF is Radiance based modelling which uses Monte Carlo ray tracing methods to calculate solar availability. Besides PPF, digital elevation modelling (DEM), an image processing of three-dimensional urban texture, has also been used to predict sky view factor at ground level. Both techniques have been previously developed and employed in the EU project PRECis: Assessing the potential for renewable energy in cities [2] and they also have been used in various urban form studies. [3-8] Table 1: Summary of cases being studied Case Form Site Plot Coverage Ratio (H, V) 1 2 3 4 5 6 7 8 9 10 11 12 13 14 15 16 17 18
(Uniform, Uniform)
(Uniform, Random)
(Random, Uniform) (Random, Random)
9% 9% 9% 36% 36% 36% 9% 9% 9% 36% 36% 36% 9% 9% 9% 9% 9% 9%
1.4 3.6 7.2 1.4 3.6 7.2 1.4 3.6 7.2 1.4 3.6 7.2 1.4 3.6 7.2 1.4 3.6 7.2
Floor Area (m2) 14400 36000 72000 14400 36000 72000 14400 36000 72000 14400 36000 72000 14400 36000 72000 14400 36000 72000
In the simulation, building arrays were either uniformly or randomly laid out on a virtual site of 100m x 100m, as such models with the same plot ratio would provide the same amount of usable floor area. Apart from the model arrays, two extra rows of buildings are placed along the periphery of the virtual site to imitate surrounding obstructions in an urban setting. Figure 2 shows the generic models of Case 5, 7 and 14 used in the simulation.
Figure 2: Generic models for simulation
2. RESULTS AND ANALYSIS 2.1 Sky view factor (SVF) at ground level The sky view factor is a measure of the openness of a surface: a SVF of 1 means an unobstructed view of the sky and a SVF of 0 means a completely obstructed view of the sky. The sky view factor at ground level has been shown to be related to urban environmental phenomena such as heat island effect, air pollution and surface energy budget. [9, 10] The average sky view factor at ground level has been computed using DEM modelling and the results are shown in Figure 3. For a given built form, the sky view factor at ground level decreases with increasing plot ratio and site coverage. This is obvious as increasing built density simply by adding more blocks or building higher would create more obstructions and thus result in less sky viewable from ground. Nevertheless, built forms do have tremendous influence in determining the sky view factor at ground level. Despite the fact that all models within an individual class of plot ratio provide the same amount of usable floor area, a random horizontal layout brought about huge improvement in ground level openness. For models with 9% site coverage, the increments in SVFground from (uniform, uniform) to (random, uniform) are 34%, 88% and 146% respectively for low, medium and high plot ratio. On the other hand, the gains from (uniform, uniform) to (uniform, random) are 25%, 53% and 36% correspondingly, though less impressive compared to horizontal randomness, the differences are still appreciable. The results suggest that random layout is more preferable than uniform layout in improving ground level openness and that horizontal randomness is more influential than vertical randomness in this concern. The improvements with (random, random) setting are significant, when compared to (uniform, uniform), the increments are 56%, 112% and 173% respectively for low, medium and high plot ratio. The findings also suggest that random arrangement is more beneficial in high density settings than low density settings, as can be seen when comparing the 173% increase at high plot ratio (Case 3 & 18) to 56% in low plot ratio (Case 1 & 16). Comparisons of sky view factor at ground level between high density random models (e.g. Case 17 & 18) and low density uniform models (e.g. Case 1 & 4) also reveal the possibilities to increase usable floor area and at the same time, maintain and even increase ground openness. For the effect of site coverage, models of 36% site coverage, even though with lower average building heights, see less sky at ground level than those of 9% site coverage. The result is straightforward as high site coverage development contains more building blocks which obscure the view of the sky at ground level.
rd
PLEA2006 - The 23 Conference on Passive and Low Energy Architecture, Geneva, Switzerland, 6-8 September 2006
ratio. On the other hand, the effect of vertical randomness is significant in all classes of plot ratio. The improvements from (uniform, uniform) to (random, random) are 6%, 36.4% and 41.2% correspondingly. The findings are parallel to the observation found in SVFgound that random arrangement is most beneficial in high density settings.
Figure 3: Average sky view factor at ground level 2.2 Daylight availability (DA) on building facade Daylight performance is assessed in terms of daylight availability under average annual sky conditions in Sao Paulo; this sky model was developed for solar simulation in a prior study. The façade daylight availability is defined as the ratio of global illuminance on building façade resulting from sunlight, skylight and reflected light, to the global illuminance on an unobstructed horizontal plane. Figure 4 shows the results.
Figure 4: Average daylight availability on building facade
Close examination of the results at high plot ratio reveals that, simply by rearranging the layout of building blocks, significant improvement in daylight performance can be achieved, without reducing the amount of usable floor area. The daylight availability on building façade with a (random, random) arrangement and low site coverage (Case 18) could be as much as triple of that obtained with (uniform, uniform) arrangement and high site coverage (Case 6). The effect of site coverage agrees with those reported in SVFground, models with high site coverage are always inferior to their low site coverage counterparts, in terms of daylight access. 2.3 Solar Potential Solar potential for photovoltaic systems (PV) has been examined in the parametric study. PV potential is defined as the percentage of building envelope which receives an amount of solar radiation greater than or equal to the preset thresholds. In this study, the thresholds for PV application were set as 800 kWh/m2 for building façade and 1000 kWh/m2 for roof; these values were determined based on current technical limitations as well as economic considerations. [11] Figure 5 shows the results of PV potential on building envelope, which take into account both façade and roof applications.
Similar to the findings in sky view factor, for a given built form, the average daylight availability on building façade decreases with increasing plot ratio and site coverage. As previously explained, increasing built density simply by adding more blocks or building higher would create more obstructions and thus reduce the access of daylight on building façades. Built form plays a significant role in determining the façade daylight availability, however the influences of horizontal and vertical randomness appear to be inconsistent. For models with 9% site coverage, the increments in DAfacade from (uniform, uniform) to (random, uniform) are 0%, 13.6% and 29.4% respectively for low, medium and high plot ratio, whilst the increments from (uniform, uniform) to (uniform, random) are 6%, 36.4% and 23.5% respectively for low, medium and high plot ratio. The results show that, at low plot ratio, the effect of horizontal randomness seems to be negligible; nevertheless, its importance is noticeable at high plot
Figure 5: PV potential on building envelope The relationship between built density and PV potential on envelope as a whole is remarkably different from those reported in SVground and DAfacade. Models with (uniform, uniform) layout and high site coverage (Case 4, 5 & 6) perform significantly better than other models. This is mainly due to the fact that these models contain a large amount of unobstructed roof area which is highly suitable for PV application. The results suggest that high site coverage is
rd
PLEA2006 - The 23 Conference on Passive and Low Energy Architecture, Geneva, Switzerland, 6-8 September 2006
favourable as it provides an extensive roof area which is a major source of high level solar radiation. However, in such high coverage layout, random vertical layout is disadvantageous as it creates overshadowing of roof area which in turn, undermines the solar availability on roof surface. Contrarily, in low site coverage development, random vertical layout is preferable. This is because in low site coverage layout, availability of roof surface is relatively limited and building façade becomes the major surface for PV application. Random vertical layout allows better solar access on façade, therefore results in higher solar potential. Horizontal randomness, on the other hand, does not affect the results very much. The PV potential is generally low in models with high plot ratio; this is probably due to the relatively compact setting of the model arrays which makes it difficult to meet the high solar radiation threshold for photovoltaic systems. In addition to the parametric analysis of PV potential, a frequency analysis has also been conducted to understand the breakdown of global solar radiation received at building envelope (façade and roof) in each of the eighteen cases. The analysis provides deeper insight into the composition of solar radiation available on the building envelope which is useful for the planning of different kinds of solar applications. Figure 6 shows the percentage of envelope area with different levels of solar radiation. A noticeable difference between the three classes of plot ratio is the proportion of low level solar radiation (0-200 kWh/m2) to the full range of solar radiation received. For models with high plot ratio, the proportion of low level solar radiation ranging from 3080% which is indeed very high when comparing to those below 20% with low plot ratio. Furthermore, the proportion of low level solar radiation reduces with decreasing site coverage and increasing randomness in layout. Nevertheless, the proportion of high level solar 2 radiation (800-1200 kWh/m ) increases with increasing site coverage, this agrees with the observation in PV potential. Hence, based on this chart, one would be able to estimate the potential of different solar strategies in different built forms. For instance, the threshold for solar thermal collectors is about 600 kWh/m2 and according to the chart, it appears that vertical randomness is as influential as site coverage.
Figure 6: Frequency distribution of solar radiation
3. DISCUSSION & CONCLUSION The paper examines the relationships between built forms, density and solar potential with reference to three design criteria, including 1) openness at ground level, which is highly related to pedestrian comfort; 2) daylight availability on the building façade, which indicates the daylight performance in buildings and 3) PV potential on the building envelope, which represents a significant portion of renewable energy application at the urban scale. Table 2 summarizes the findings. Table 2: Summary of findings Form (H, V)
SVFground
DAfacade
PVenvelope
SC 0.09 (U,U) – Case 1 (U,R) – Case 7 (R,U) – Case 13 (R,R) – Case 16
0.32 0.40 0.43 0.50
0.33 0.35 0.33 0.35
6% 8% 6% 7%
SC 0.36 (U,U) – Case 4 (U,R) – Case 10
0.20 0.30
0.27 0.29
17% 18%
SC 0.09 (U,U) – Case 2 (U,R) – Case 8 (R,U) – Case 14 (R,R) – Case 17
0.17 0.26 0.32 0.36
0.22 0.30 0.25 0.30
2% 3% 3% 4%
SC 0.36 (U,U) – Case 5 (U,R) – Case 11
0.11 0.18
0.15 0.18
8% 5%
SC 0.09 (U,U) – Case 3 (U,R) – Case 9 (R,U) – Case 15 (R,R) – Case 18
0.11 0.15 0.27 0.30
0.17 0.21 0.22 0.24
1% 1% 2% 2%
SC 0.36 (U,U) – Case 6 (U,R) – Case 12
0.06 0.09
0.08 0.13
4% 2%
PR 1.44
PR 3.6
PR 7.2
rd
PLEA2006 - The 23 Conference on Passive and Low Energy Architecture, Geneva, Switzerland, 6-8 September 2006
In summary, the results suggest that random layout is, in general, beneficial. In terms of ground openness, horizontal randomness is more influential than vertical randomness. However, from the daylight point of view, the impact of horizontal randomness depends on plot ratio. Its effect is negligible in low plot ratio setting but significant in high plot ratio setting. On the other hand, the influence of vertical randomness is important in all cases. Moreover, for both SVFground and DAfacade, randomness is more beneficial in high density setting than low density setting. In view of PV potential, the effect of vertical randomness depends more on site coverage. It is favourable in low site coverage setting as it allows better solar access on façade. However, it would be disadvantageous in high site coverage setting as it creates overshadowing of roof area. Horizontal randomness, on the other hand, does not have significant influence on PV potential. High site coverage is in general not preferable as it undermines daylight and solar potential on ground and building façade, however, the extensive roof surface provided by high site coverage development is a major source for high level solar radiation which makes it advantageous for PV application. The results also suggest that significant improvement can be achieved, in terms of daylight and solar potential, by simply rearranging the layout of building blocks without reducing the amount of usable floor area. According to the findings, within an individual class of plot ratio, the differences between the best and the worst layouts are in the order of 100300% (except DAfacade at low plot ratio), which represent huge improvements. Comparisons between good layouts at high plot ratio and poor layouts at low plot ratio reveal the possibilities to increase usable floor area and at the same time, maintain and even increase daylight and solar potential. The results contrast to the conventional assumption that increasing built density would lead to deterioration of the immediate environment, in relation to solar access and lessening the potential for renewable energy application at the urban scale. Finally, the global solar radiation breakdown chart provides a means for estimating the potential of different solar strategies with various built forms; it could be useful for the planning of different kinds of solar applications at the urban scale.
4. IMPLICATIONS IN URBAN DESIGN The findings of this study provide some helpful insights for the planning of high density solar cities. One of the most important recommendations is randomness in horizontal layout. Given the same amount of usable floor area, it is more desirable to
arrange building blocks in scattered layouts than uniform arrays. (Figure 7)
Figure 7: Horizontal randomness is preferable Second, arrangements with higher buildings, less site coverage and more open space are more preferable than those with lower buildings and higher site coverage. (Figure 8)
Figure 8: Low site coverage is preferable Randomness in vertical layout should also be encouraged. In order to make this happen, building and planning regulations on building height would have to be made more flexible. (Figure 9)
Figure 9: Vertical randomness is preferable To illustrate the implications of the findings, a city centre site in São Paulo, Brazil has been taken as a case study of urban renewal. Figure 10a shows the morphology of the existing site. It is characterized by high site coverage; buildings are closely packed together and open spaces are scarce. The existing morphology significantly undermines the potential for daylighting in buildings and PV applications on building facades. A new design as shown in Figure 10b is proposed. The new configuration provides the same amount of usable floor area as the existing site, nonetheless, it results in better daylight and solar potential.
rd
PLEA2006 - The 23 Conference on Passive and Low Energy Architecture, Geneva, Switzerland, 6-8 September 2006
REFERENCES [1]
[2]
Figure 10: New design for a case study site After all, the key message of this paper is that the intention for densification and the concept of sustainability are not mutually exclusive. Given proper urban design and layout, compact cities can be a respectable solution to rapid urbanization and urban regeneration.
[3] [4]
[5]
5. LIMITATIONS OF THE STUDY As a final remark, there are some limitations of the study, which have to be observed. First, the random layouts used in the study were generated by the random number function in the Excel program. Given the same built density, the configurations of random layout could vary significantly; therefore it is suspected that the findings might be different if other configurations of random layout were considered. This is a preliminary study; further investigation with a range of random layouts will be carried out to examine their performance more thoroughly. Second, the study is fundamentally based on computer simulation. Although the simulation programs employed have been widely validated, variations in architectural features, for instance, projections from building facades, could significantly affect the outcome. Third, the Radiance modelling is based on the average annual sky conditions of Sao Paulo, which is of low geographic latitude (23.5oS). This sky model is characterized by high solar altitudes, which results in appreciable difference between façade and roof irradiation. Hence, the findings might not be applicable in locations with different sky conditions.
6. ACKNOWLEDGEMENTS The authors thank the British Academy Research Grant for funding this research project.
[6]
[7]
[8]
[9]
[10]
[11]
Cheng, V., Steemers, K., Montavon, M., and Compagnon, R. 2006. Compact cities in a sustainable manner. Energy and Buildings. (submitted). Steemers, K., Raydan, D., Ratti, C., and Robinson, D. 2000. PRECis: Assessing the Potential for Renewable Energy in Cities. Final Report. Cambridge. Compagnon, R. 2004. Solar and daylight availability in the urban fabric. Energy and Buildings, 36, pp. 321-328. Montavon, M., Robinson, D., Scartezzini, J.L., and Compagnon, R. 2005. Urban daylight and solar radiation potential: analysis of three Swiss districts. International Journal of Solar Energy. (submitted). Montavon, M., Scartezzini, J.L., and Compagnon, R. 2004. Comparison of the solar energy utilization potential of different urban environment. in PLEA 2004 Conference, Eindhoven, Netherlands: Technische Universität Eindhoven. Nikolopoulou, M. ed. 204. Designing open spaces in the urban environment: a bioclimatic approach. Centre for Renewable Energy Sources, Department of Buildings: Greece. Ratti, C., Raydan, D., and Steemers, K. 2003. Building form and environmental performance: archetypes, analysis and an arid climate. Energy and Buildings, 35, pp. 49-59. Scartezzini, J.L., Montavon, M., and Compagnon, R. 2005. Computer evaluation of the solar energy potential in an urban environment. in Eurosun 2002 Conference. Bologna. Oke, T.R. 1981. Canyon geometry and the nocturnal urban heat island: comparison of scale model and field observations. Journal of Climatology, 1, pp. 237-254. Svensson, M.K. 2004. Sky view factor analysis - implications for urban air temperature differences. Meteorological Applications, 11, pp. 201-211. Compagnon, R. 2000. PRECis: Assessing the Potential for Renewable Energy in Cities. Annexe 3: Solar and Daylight availability in urban areas. Cambridge.