• Turkish Airlines from Rating Agencies Perspective • • • • •
Industry Risk Business Risk / Competitive Position Financial Risk Country Risk / Government Support Turkish Airlines Corporate Rating
• Turkish Airlines Financing Today & Tomorrow • Capital Markets EETC Experience • Innovative Financing and the Role of Rating Agencies
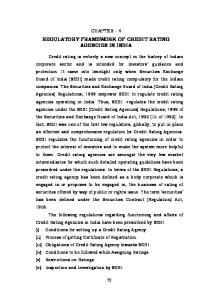
While Perceived «High RISK», Remains a Growth Market Passenger air traffic growth has been resilient over the past 40 years with the market declining in only three years following major industry crises.
1
Historical and Forecast World Traffic
Latest Financial Crisis
RPKs (billions)
5.500 15.000
13.500
12.000
5.200 4.900 4.600 4.300 4.000 2006
2
10.500
2007
2008
2009
2010
2011
September 11th, 2001 3.400
RPKs (billions)
RPKs (billions)
9.000
7.500
6.000
3.300 3.200 3.100 3.000 2.900
1
4.500
1998
3
2
RPKs (billions)
3 1.500
1975
1980
1985
1990
1995
2000
2000
2001
2002
2003
1989
1990
1991
1992
1993
Gulf War 2.100
3.000
0 1970
1999
2005
2010
2015
2020
2025
2030
2.000 1.900 1.800 1.700 1.600 1988
Source: Airline Monitor.
3
Center of Aviation is Moving Towards Istanbul 2015 World Aviation Market Size: $730 Billion
Europe 50.8% Asia 22.1% N.America 10.6%
M.East 9.2% S.America 3.8%
Africa 3.6%
Turkish Airlines’ Potential Transfer Market: $115 Billion Turkish Airlines’ 2014 Transfer Revenue: $4 Billion Source: Airbus Global Market Forecast (2012-2031), IATA (2015), Boeing CMO (2015), Internal Research : Percentage of international scheduled passengers carried by airlines domiciled in these regions, ICAO (2011)
4
• Turkish Airlines from Rating Agencies Perspective • • • • •
Industry Risk Business Risk / Competitive Position Financial Risk Country Risk / Government Support Turkish Airlines Corporate Rating
• Turkish Airlines Financing Today & Tomorrow • Capital Markets EETC Experience • Innovative Financing and the Role of Rating Agencies
Global Market Share Gains Global Market Share Trends (in ASK) 4.9%
4.4%
4.3%
3.9%
American
United
Delta
Emirates
3.0%
2.8%
2.4%
2.2%
2.1%
2.0%
1.9%
1.9%
1.8%
1.8%
1.7%
China Southwest Air China Lufthansa British Air France Turkish Southern Airways Airlines
China Eastern
Qantas
Cathay Pacific
LATAM
2004
2012
1.6%
1.6%
9% 8% 7% 6%
5% 4% 3% 2% 1% 0%
2002
2003
2005
2006
2007
2008
2009
2010
2011
2013
2014
2015F
Turkish Airlines Market Share Development Capacity (bn ASK)
Global Market Share
1,8%
1,9%
1,6% 1,3% 0,9% 0,6%
0,5%
0,5%
0,6%
0,7%
0,7%
1,2%
0,8%
24
26
30
42
46
24
37
57
2002
2003
2004
2005
2006
2007
2008
2009
Source: 2002 ICAO, 2003-2014 IATA, 2015F OAG, company reports, sorted by 2015F ASK values.
6
1,0%
65
2010
78
2011
94
2012
114
2013
135
2014
156
2015F
Ryanair Singapore
12.000
11.000
Weekly Flights
Turkish Airlines Growth Story
61.7 mn pax
10.000 54.7 mn pax
9.000
2015E - 299
48.3 mn pax 8.000
2014-261 39 mn pax
7.000
2013-233
32.6 mn pax 6.000
25.1 mn pax
2011 - 202 2010 - 153 22.6 mn pax 14.1 mn 2009 - 132 pax 2008 - 127 16.9 mn pax
5.000
4.000
3.000
2012-202
29.1 mn pax
11.9 mn pax
2007 - 101 2006 - 103
2005- 83 2.000
2004-73
19.7 mn pax
10.4 mn pax Destinations
1.000 90
7
100
110
120
130
140
150
160
170
180
190
200
210
220
230
240
250
260
270
280
290
300
Istanbul is a Natural Aviation Hub Wide Body Range
231 International 48 Domestic Destinations 111 Countries
SFO
YVR
LAX IAH
12
ORD MEX ATL JFK YYZ HAV YUL MIA IAD BOS
BOG
34
CCS
106
NRT KIX ICN PEK PVG
CAN
airline
TPE MNL HKG
ISTANBUL
34
45
BKK HKT
SGN KUL SIN
MPM JNB CPT
CGK
Narrow Body Range
Current Wide Body destinations Future Wide Body destinations 8
Highest coverage of secondary cities (189)
Strong presence in growth markets (CEEMEA)
More than 40% of worldwide international traffic within narrow body range
Reaching 76% of all destinations at least daily
TNR MRU
DUR
Number of Destinations in a Region
DPS
GRU
EZE
More country coverage than any other
Geographic Advantage Converts to Cost Advantage Unit Cost (Cost per Available Seat Km) vs Average Stage Lenght 14.0
CASK, Usc
12.0
EU Average 10.0
Asia Average ME Average
US Average 8.0
THY LCC Average
6.0
Stage length, km
4.0 0
9
1,000
2,000
3,000
4,000
5,000
6,000
• Turkish Airlines from Rating Agencies Perspective • • • • •
Industry Risk Business Risk / Competitive Position Financial Risk Country Risk / Government Support Turkish Airlines Corporate Rating
• Turkish Airlines Financing Today & Tomorrow • Capital Markets EETC Experience • Innovative Financing and the Role of Rating Agencies
One of the Highest Profitability Margins in the Industry
9,9%
DL
AF-KL
6,1%
10,4%
12,7%
SQ
13,4%
18,1%
TK
15,9%
18,5%
22,8%
EBITDAR Margin % Comparison (2014)
EK
* Lufthansa Passenger Airlines Source: Calculated based on public company reports.
11
AA
IAG
UA
LH*
Key Leverage Ratios Adjusted Net Debt1 / EBITDAR
EBITDAR / Adjusted Net Interest Cost2 Average: 6.5x
Average: 3.9x
8,3x 7,8x
7,4x 6,5x 4,8x 4,3x 3,6x
3,9x
3,9x
2013
2014
4,5x
4,7x
2010
2011
2,6x
2009
2010
2011
2012
2009
5-year Average Adjusted Net Debt to EBITDAR Target: 3.5x Out of investment grade scope Ignores healthy growth / investment period
1. 2.
12
Adjusted for the capitalization of operating leases including 55% of wet lease (7x) Adjusted by the portion of financial costs within operating leases (33%)
2012
2013
2014
196 Aircraft Financed in 10 years – $12 Billion Funding
33 29 25 20
19 12
20
20
10 5
3
2.500 1.900 1.600 1.100
1.100
1.100
1.000
2012
2013
800 500
300
2005
200
2006
2007
2008
2009
Total Financing(Mn $)
13
2010
2011
Number of A/C Financed
2014
2015
All Financed Through Own Operational Cash Generation
CAPEX (Other)
EBITDAR Margin
21,5% 19,5%
18,8%
16,0%
18,8%
15,3%
2.044 1.118
882
866
2012
577
1.843 506
1.603
652 1.130
407 762
1.024 14
2011
18,5%
16,9% 17,3%
2010
Capex / Revenue
471
21,5%
CAPEX (Rent Payments)
1.228
EBITDAR
2013
2014
• Turkish Airlines from Rating Agencies Perspective • • • • •
Industry Risk Business Risk / Competitive Position Financial Risk Country Risk / Government Support Turkish Airlines Corporate Rating
• Turkish Airlines Financing Today & Tomorrow • Capital Markets EETC Experience • Innovative Financing and the Role of Rating Agencies
Increasingly Diversified Business Revenue by Point of Sale
America 9%
Africa 4%
Africa 8% Europe 27%
3% 4%
Middle East 11%
Revenue by Geography
America 11%
5%
8% 13%
35%
9%
Middle East 13%
9% Far East 13% 32%
39%
16% 21%
Turkey 19%
Internet / Call Center 17%
Europe 30%
6%
Turkey 13%
Far East 24%
Inner circle: 2009 Outer circle: 2015
Passenger Breakdown Increased Int’l to Int’l Transfer Traffic Int'l-Int'l 26% 18% Domestic 43%
8%
47%
Reduced dependency to any region operationally Int'l-Dom 6%
27%
Int'l Direct 25%
16
More than 75% of ticket sales made outside Turkey
Turkish Airlines Significance to Turkey Contribution to Turkey’s Export through Connectivity
10% 6%
8%
Europe
13%
18%
7%
Asia and Far East
North America 21%
$11.1 Billion total revenue 4th largest company in Turkey in revenue
11%
Middle East
Over $8 Billion Service Export 40.000 Employees
19%
15%
Latin America
22%
24%
Africa 19%
15%
Turkish Airlines Annual Destination Point Increase 2003-2014 Annual Turkish Export Growth 2003-2014
17 Strictly Private & Confidential
Main driver of Turkey’s Exports
New Airport in Istanbul to be Completed in 2018 150 million passenger capacity 4 Terminals, 6 Runways 76,5 sqkm area 181 aircraft parking capacity Connected to city center in 25 minutes (via rail) More than 100.000 sqm of retail area Environmental friendly, easily accesible, green facility
Some Stats for Phase 1
18
Ataturk Airport
Third Airport
Traffic Movements/hour
65
90
# of Gates
63
181
Aircraft per Gate (THY)
5,7
3,3
Pax per square meter
162
80
• Turkish Airlines from Rating Agencies Perspective • • • • •
Industry Risk Business Risk / Competitive Position Financial Risk Country Risk / Government Support Turkish Airlines Corporate Rating
• Turkish Airlines Financing Today & Tomorrow • Capital Markets EETC Experience • Innovative Financing and the Role of Rating Agencies
Turkish Airlines Credit Rating
20
• Turkish Airlines from Rating Agencies Perspective • • • • •
Industry Risk Business Risk / Competitive Position Financial Risk Country Risk / Government Support Turkish Airlines Corporate Rating
• Turkish Airlines Financing Today & Tomorrow • Capital Markets EETC Experience • Innovative Financing and the Role of Rating Agencies
Up to $13 Billion Future Financing Need Fleet Development (Year End)
Order Book Delivery Schedule 62
331
299
324
238
216
230
355
349
339
292
261
438
428
384
43
47
30
47
40 62
10 73
84
85
85
83
80
80
11
6 3
2015
2016
2017
2018
2019
2020
2021
2016
2017
Wide Body
Narrow Body
Wide Body
Cargo
14
40
14
2018
2019
Narrow Body
2020
2021
Cargo
Owned (Unencumbered) Aircraft 174 156 125 101 73
29
$453
36
46
83
$4.330
52
$4.712
$3.390 $2.356
$624
$873
$954
$1.374 $1.567
2016 2017 2018 2019 2020 2021 2022 2023 2024 2025
Owned Aircraft Value (mn$)
22
Owned Aircraft #
216 aircraft will be delivered in the next 6 years implying apx. $13 bn financing
Financing Structure Today and Tomorrow 2015 Total Debt : $8.4 Billion Weighted Average Interest Rate: 3.0%
Com. 5%
2021 Total Debt : $14 Billion
EETC 2% Owned 11%
Sukuk Corporate Bond
CHF 3%
JOLCO 20% JPY 31%
262 Aircraft*
USD 36%
Op. Lease 22%
Owned Other
USD
JPY
438 Aircraft
EETC
Op. Lease
Com. ECA 23%
*: excluding wet-lease aircraft 23
EUR 30%
US Exim
EUR US Exim 17%
JOLCO
ECA
A Leading Financing Team : Innovative Structures
2006
The first ever ECA backed French Lease 2008
The first ever US Exim backed French Lease
2011
2013
2014
2014
2015
24
The first ever ECA backed JOLCO Lease The first ever US Exim backed JPY denominated Convertible Bond The first ever ECA Guaranteed Italian Tax Lease in Japanese Yen
The first ever US EXIM guaranteed structure for GE CF6 engines
The first ever JPY Denominated EETC combined with JOLCO Lease
Financing Awards
25
• Turkish Airlines from Rating Agencies Perspective • • • • •
Industry Risk Business Risk / Competitive Position Financial Risk Country Risk / Government Support Turkish Airlines Corporate Rating
• Turkish Airlines Financing Today & Tomorrow • Capital Markets EETC Experience • Innovative Financing and the Role of Rating Agencies
EETC Issue Process 2011 Cape Town Process
Corporate Rating
Turkey adopted CTC and Aircraft Protocol
2012
Implementation of secondary legislations
Kick-off
EETC Structure Rating
2014
2015
Turkey included in OECD List
Rating agency selection Rating agency meetings
Advisor bank selection
EETC Structuring / Documentation
2013
Corporate ratings assigned
Structuring bank selection
Cancellation of JOLCO component Re-kick off Postponement due to legislative concerns Preliminary discussions with agencies on EETC Agency meetings and presentation Rating agency reports and scenario analysis
Discussion on alternative LTV & tenor scenarios Final rating report
Finalize Offering Memorandum
Roadshow & Issuance
Deal roadshow Announcement and execution of the deal
27
Cape Town Convention in Turkey
An international treaty designed to reduce the risk of loss by creditors in aircraft transactions It has made it possible to expand the EETC structure beyond the U.S. air carriers. Turkey adopted the Cape Town Convention and Aircraft Protocol, December 2011. Implementation of secondary legislation have been completed in 2014 As of 20 October 2014, Turkey has been added to the OECD list of countries whose airlines are eligible for the “Cape Town Discount. *
* Applies to the Guarantee Premium charged by any OECD Export Credit Agency under a government guaranteed financing arrangement
28
Enhanced Equipment Trust Certificate (EETC) Asset Backed Corporate Bond
Supporting Structural Elements
Aircraft Colleteralized
Debt tranching
Rated higher than the Airline Corporate Rating
Liquidity facilities Overcollateralization Cross-default principles
Corporate Rating LTV (A Tranch) Cross-collateral / default Jurisdiction Total Notch-up EETC Rating Coupon / YTM * USD Equivalent of 1.228% (JPY coupon rate)
29
Turkish Airlines USD EETC
American Airlines 2015-2A
Turkish Airlines JPY EETC
Ba1 (+2 notches compared to AAL)
Ba3
Ba1
67%
55%
44%
Yes / Yes
Yes / Yes
Yes / No
Cape Town – Turkey
U.S. Section 1110
Cape Town – Turkey
+5 notches
+7 notches
+5 notches
A2
A2
A2
4.2% / 4.9%
4.0% / 4.1%
3.8%* / -
• Turkish Airlines from Rating Agencies Perspective • • • • •
Industry Risk Business Risk / Competitive Position Financial Risk Country Risk / Government Support Turkish Airlines Corporate Rating
• Turkish Airlines Financing Today & Tomorrow • Capital Markets EETC Experience • Innovative Financing and the Role of Rating Agencies
Increasing Importance of Capital Markets / Rated Products
31
Source: Boeing – Current Aircraft Finance Market Outlook 2015
THANK YOU
Please Contact: +90 (212) 463-6363 e-mail:
[email protected]
Disclaimer Türk Hava Yolları A.O. (the “Incorporation” or ‘’Turkish Airlines’’) has prepared this presentation for the sole purpose of providing information about its business, operations, operational and financial results. The information in this presentation is subject to updating, revision and amendment. This presentation is not, and does not support to be comprehensive and to contain all information related to Turkish Airlines. This presentation does not constitute or form part of any offer or invitation to sell or issue, or any solicitation of any offer to purchase or subscribe for, any securities of Turkish Airlines nor any of its subsidiaries or their respective affiliates nor should it or any part of it or the fact of its distribution form the basis of, or be relied on in connection with, any contract or investment decision in relation thereto. This presentation is not intended for distribution to, or use by, any person or entity in any jurisdiction or country where such distribution would be contrary to law or regulation. The information contained in this presentation has not been subject to any independent audit or review and may contain forward-looking statements, estimates and projections. Statements herein, other than statements of historical fact, regarding future events or prospects, are forward-looking statements. Although Turkish Airlines believes that the estimates and projections reflected in the forward-looking statements are reasonable, they may prove materially incorrect, and actual results may materially differ. As a result, you should not rely on these forward-looking statements. Turkish Airlines undertakes no obligation to update or revise any forward-looking statements, whether as a result of new information, future events or otherwise, except to the extent required by law. Any forward-looking statement in this presentation speaks only as of the date on which it is made, and Turkish Airlines undertakes no obligation to update any forward-looking statement to reflect events or circumstances after the date on which the statement is made or to reflect the occurrence of unanticipated events, except to the extent required by law. Industry, market and competitive data and certain industry forecasts used in this presentation were obtained from internal research, market research, publicly available information and industry publications and other market commentaries. Industry publications generally state that the information contained therein has been obtained from sources believed to be reliable at the relevant time, but that the accuracy and completeness of such information is not guaranteed. Similarly, internal research, market research, industry publications and other publicly available information, while believed to be reliable, have not been independently verified, and Turkish Airlines does not make any representation as to the completeness or accuracy of such information. No representation, warranty or undertaking, expressed or implied, is or will be made by Turkish Airlines or its shareholders, affiliates, advisors or representatives or any other person as to, and no reliance should be placed on, the fairness, accuracy, completeness or correctness of the information or the opinions contained in this presentation (or whether any information has been omitted from this presentation). Turkish Airlines, to the extent permitted by law, and each of its respective directors, officers, employees, affiliates, advisors or representatives disclaims all liability whatsoever (in negligence or otherwise) for any loss however arising, directly or indirectly, from any use of this presentation or its contents or otherwise arising in connection with this presentation. This presentation should not be construed as financial, legal, tax, accounting, investment or other advice or a recommendation with respect to any investment. Under no circumstances is this information and material to be construed as a prospectus, supplement, offering memorandum or advertisement, and neither any part of this presentation nor any information or statement contained herein shall form the basis of or be relied upon in connection with any contract, commitment or investment decision. By reading this presentation or attending or listening to any relevant meeting, conference call or webcast organized by the Company, you agree to be bound by the above provisions. 33