Tribology in Industry www.tribology.fink.rs
RESEARCH
Vol. 36, No. 3 (2014) 236-243
Optimization of CO2 Laser Cutting Process using Taguchi and Dual Response Surface Methodology M. Madić a, M. Radovanović a, M. Manić a, M. Trajanović a a Faculty
of Mechanical Engineering, University of Niš, Serbia.
Keywords: CO2 Laser Cutting Taguchi method Dual Response Optimization Surface Roughness Monte Carlo
Corresponding author: Miloš Madić University of Niš, Faculty of Mechanical Engineering, Serbia E-mail:
[email protected]
ABSTRACT Selection of optimal cutting parameter settings for obtaining high cut quality in CO2 laser cutting process is of great importance. Among various analytical and experimental optimization methods, the application of Taguchi and response surface methodology is one of most commonly used for laser cutting process optimization. Although the concept of dual response surface methodology for process optimization has been used with success, till date, no experimental study has been reported in the field of laser cutting. In this paper an approach for optimization of CO2 laser cutting process using Taguchi and dual response surface methodology is presented. The goal was to determine the near optimal laser cutting parameter values in order to ensure robust condition for minimization of average surface roughness. To obtain experimental database for development of response surface models, Taguchi’s L25 orthogonal array was implemented for experimental plan. Three cutting parameters, the cutting speed (3, 4, 5, 6, 7 m/min), the laser power (0.7, 0.9, 1.1, 1.3, 1.5 kW), and the assist gas pressure (3, 4, 5, 6, 7 bar), were used in the experiment. To obtain near optimal cutting parameters settings, multistage Monte Carlo simulation procedure was performed on the developed response surface models. © 2014 Published by Faculty of Engineering
1. INTRODUCTION Laser cutting finds many applications in various manufacturing industries where a variety of components in large numbers are required to be machined with high quality and close tolerance at low costs. Numerous additional advantages such as: convenience of operation, high precision, small heat-affected zone, minimum deformity, low waste, low level of noise, flexibility, ease of automation [1-4] along with
236
technological improvements in laser machines, made laser cutting technology more prevalent in today’s production systems. Finally this technology was found to be suitable for processing a wide variety of materials in [5]. Laser cutting is a complex process characterized by a number of parameters which in turn determine the efficiency of the whole process in terms of productivity, cut quality and costs. Maximization of the productivity and the cut
M. Madić et al., Tribology in Industry Vol. 36, No. 3 (2014) 236-243
quality along with costs minimization are of particular interest to manufacturers. With a limited theoretical and practical background to assist in systematical selection, laser process parameters are usually chosen on the basis of handbook values, manufacturer recommendations and/or previous experience. Above all, optimal cutting parameter settings for achieving a desired goal are not guaranteed. Improper selection of cutting parameters cause high manufacturing costs, low product quality and high waste. On the other hand, the proper selection of these parameters results in improved end product quality [6]. The main disadvantage of laser machining is the high temperatures reached by the material during the laser processing [7]. A correct choice of parameters is that in which there is the minimum quantity of heat contribution in the part necessary for cutting. In this way, the part will be cut with the minimum amount of thermal damage. As the contribution of heat depends on the cutting power and the speed, the speed should be maximized and the power minimized in order to minimize this damage [8]. However, it should be noted that the optimum parameter settings for one quality characteristic may deteriorate other quality characteristics [9]. Consequently, it is of great importance to exactly quantify the relationship between laser cutting parameters and cutting performance through mathematical modeling and subsequently determinate optimal or near-optimal cutting conditions through the use of optimization algorithms. Different methods such as, e.g., design of experiment (DOE), finite difference method, response surface methodology (RSM) and artificial neural networks were used alone or coupled with an optimization algorithm (like genetic algorithm, particle swarm optimization algorithm or simulated annealing algorithm) to optimize the laser cutting process [2,8,10-15].
from the target value of interest. With the ultimate aim to make products and/or processes that are robust (insensitive) with respect to all various causes of variation (noise factors), TM has become very popular in manufacturing practice. It was shown that TM greatly simplifies the optimization procedure and therefore is well suited for real manufacturing environment [21]. However, as it well-known, TM limits the search for the optimal parameters setting only on discrete parameter values used in the experiment matrix. To overcome this shortcoming, an approach of integrating TM with RSM was proposed [22]. Dubey and Yadava [9] applied this hybrid TM and RSM (TMRSM) approach to develop the response surface models and to optimize the Nd:YAG laser cutting process for multiple quality characteristics such as kerf width and material removal rate. The combined TM and dual RSM (DRSM) was applied by Dhavlikar et al. [23] to determine the robust condition for minimization of out of roundness error of workpieces for the centerless grinding process. The approach based on TM and DRSM has not yet been applied for optimization of the laser cutting process. Hence this paper presents an application of combined TM and DRSM (TMDRSM) approach to determine robust condition for minimization of surface roughness in CO2 laser cutting process. For determining the optimum cutting parameter settings that satisfied the given conditions, multi-stage Monte Carlo simulation procedure was employed. To obtain experimental database, laser cutting experiment was planned and conducted according to the Taguchi’s experimental design technique using L25 orthogonal array where three laser cutting parameters, namely cutting speed, laser power and assist gas pressure were arranged.
2. MATERIALS AND METHODS The application of Taguchi methodology (TM) without formulation of any kind of model is an attractive alternative to determination of near optimal cutting parameter settings in laser cutting and is particularly popular when dealing with multiple-performance characteristics [9, 16-20]. The TM focuses on determining of the optimum operating conditions in order to minimize performance variability and deviation
The methodology used and the experimental procedure with results are given below under the appropriate subheadings. 2.1. Methodology RSM is a collection of mathematical and statistical techniques designed to construct an
237
M. Madić et al., Tribology in Industry Vol. 36, No. 3 (2014) 236-243
approximation model for the response variable. In general, second-order polynomial models are developed because first-order models often give lack-of-fit [24]. The selected approximation model is then used to find optimal setting of input (design) variables that maximize (or minimize) the mean value of the response. However, when the variance is not constant, classical RSM can be misleading [25]. An alternative for classical RSM is the DRSM approach proposed by Vining and Myers [26] which utilizes response surfaces in modeling process relationships by separately estimating the response functions for the process mean and the standard deviation. Then, based on the optimization strategy chosen, these functions are optimized simultaneously over the region of interest to determine the system’s optimum operating conditions. In recent years, the TM [27] has become a powerful technique for process/product quality improvement. Taguchi proposed a robust design strategy aimed at simultaneous optimization of the mean and the variance of the response being investigated. Taguchi suggested a summary statistic that combines information about the mean and variance into a single performance measure, known as the signal-to-noise (S/N) ratio. Taguchi found out empirically that S/N ratios give the (near) optimal combination of the factor levels, where the variance is minimum, while keeping the mean close to the target value, without using any kind of model. In the present paper, a combined TM-DRSM for optimization of the CO2 laser cutting process was proposed. The main steps in the applied methodology are as follows: 1. Conduct CO2 laser cutting experiment using DOE technique from which a set of experimental data is generated. 2. Apply TM to determine the S/N ratios for all the experimental trials. 3. Model the mean and the variability of the response using the RSM with data from steps 1 and 2. 4. Select empirical models, formulate DRSM optimization problem, and optimize the response functions using the multi-stage
238
Monte Carlo simulation procedure considering experimental range for each variable. 2.2. Experimental procedure The CO2 laser cutting parameters considered in the present study were cutting speed (v), laser power (P), and assist gas pressure (p). Other parameters were kept constant for the scope of this research and are given in Table 1. The average surface roughness (Ra) was chosen as the target function (response). Table 1. Constant parameters used in experiment. Lens focal length, mm Focal point position, mm Nozzle design Stand-off distance, mm Type of gas
127 0 (sheet top surface) conical shape, ∅ = 1 mm 0.7 O2 with purity of 99.95 %
It is difficult to predict the quality of the cut, due to the coupling of thermal effect of the laser and the oxidation of the material by the oxygen used as assisting gas [8]. Since it was assumed that the effects of laser cutting parameters on the surface roughness were complex and nonlinear, the experiment was set up with parameters with more number of levels. Different settings of cutting speed, laser power and assist gas pressure used in the experiment are summarized in Table 2. The middle level of each factor was chosen by considering normal operating level as recommended by the machine manufacturer. Table 2. Controllable parameters. Cutting parameter
Symbol
v (m/min)
Level 1
2
3
4
5
A
3
4
5
6
7
P (kW)
B
0.7
0.9
1.1
1.3
1.5
p (bar)
C
3
4
5
6
7
Based on the selected cutting parameters and their levels, a design matrix was constructed (Table 3) in accordance with the standard L25 Taguchi orthogonal array (OA). The selected design matrix consists of 25 rows corresponding to the total number of experiment trials.
M. Madić et al., Tribology in Industry Vol. 36, No. 3 (2014) 236-243 Table 3. Experimental design and results. Exp. trial 1 2 3 4 5 6 7 8 9 10 11 12 13 14 15 16 17 18 19 20 21 22 23 24 25
Parameter level A B C 1 1 1 1 2 2 1 3 3 1 4 4 1 5 5 2 1 2 2 2 3 2 3 4 2 4 5 2 5 1 3 1 3 3 2 4 3 3 5 3 4 1 3 5 2 4 1 4 4 2 5 4 3 1 4 4 2 4 5 3 5 1 5 5 2 1 5 3 2 5 4 3 5 5 4
Ra (µm) 1.487 1.290 2.073 2.477 2.937 1.780 1.707 2.337 3.307 1.190 2.013 2.017 2.603 1.173 1.380 1.660 1.710 0.963 1.007 1.143 1.587 0.832 0.903 0.780 1.073
S/N (dB) -3.445 -2.219 -6.342 -7.885 -9.382 -5.023 -4.650 -7.406 -10.391 -1.534 -6.098 -6.108 -8.317 -1.392 -2.843 -4.419 -4.679 0.227 -0.089 -1.235 -4.013 1.553 0.820 2.148 -0.755
All of the experiment trials were conducted on a 2.2 kW CO2 ByVention 3015 laser cutting machine provided by Bystronic Inc. The cuts were performed with a Gaussian distribution beam mode (TEM00) on 2 mm thick structural steel S355J2G3 EN 10025 sheet. Chemical composition for this steel is 0.2% C, 1.5% Mn, 0.5% Si, 0.013% P, 0.007 S. Two straight cuts each of 60 mm in length were made in each experimental trial to ascertain surface finish. The Ra was measured using Surfrest SJ-301 (Mitutoyo) profilometer. Cut off length was 0.8 mm and evaluation length was 4 mm. The measurements were repeated two times to obtain averaged values (Table 3).
response, which is the Ra, is below a specified value. Since it is required that the Ra should be minimum, smaller the better type of S/N ratio was used [27]: 1 n S / N = −10 log ∑ yi2 . n i =1
(1)
where yi is the i-th observed value of the response and n is the number of observations in a trial. The calculated S/N ratio values are given in Table 3. To model the experimental data given in Table 3, response surface models were developed with the help of MINITAB statistical software. Response surface models for the S/N ratio and the Ra were determined in uncoded units as: S / N = 3.7 − 3.83v + 1.86 P + 0.225vp + 0.424v 2 − 0.275 p 2 Ra = −0.064 + 0.746v − 0.248P − 0.0824vp − 0.0614v 2 + 0.0734 p 2
.
(2)
.
(3)
Summary of ANOVA results for the response functions is given in Tables 4 and 5. This analysis was carried out for a level of significance of 5%, i.e., for a level of confidence of 95%. Table 4. ANOVA table for response function of the S/N ratio. Source
DF
SS
MS
Regression
5
275.478 55.096
Residual error
19
15.315
Total
24
290.793
F
P
68.35
0.000
0.806
Table 5. ANOVA table for response function of the Ra. Source
DF
SS
MS
Regression
5
10.3548 2.0710
Residual error
19
0.7074
Total
24
11.0622
F
P
55.62
0.000
0.0372
3. RESULTS AND DISCUSSION 3.1. Model development In the present study, the objective of the proposed methodology is the determination of the laser cutting parameter values, which maximizes the primary response, which is S/N ratio, subject to the condition that the second
From the analysis of Tables 4 and 5, it is apparent that, the F calculated value is greater than the F-table value (F0.05, 5, 19 = 2.74) and hence the response functions developed are quiet adequate. Furthermore, the predicted values of S/N ratio and Ra were compared with the actual values. The results of this comparison are given in Fig. 1.
239
M. Madić et al., Tribology in Industry Vol. 36, No. 3 (2014) 236-243
a)
b) Fig. 1. Comparison of actual and predicted values: a) S/N ratio; b) Ra
It can be seen from the results that the predicted values are close to actual values. Therefore, developed response functions can be used as the objective functions for the optimization. 3.2. Optimization procedure The goal of the optimization process is to determine the near optimal laser cutting parameter values (vopt, Popt and popt) in order to ensure the maximum value of S/N subject to the condition that the Ra is bellow 1.6 µm, which satisfies the real requirement in practice. For CO2 laser cutting of structural steel S355J2G3 EN 10025 sheet, dual response optimization problem can be formulated as follows: Find : vopt , Popt and popt to maximize : S / N ratio (Eq 2) subject to : Ra < 1.6µm (Eq 3) within cutting parameter ranges : . 3 m/min ≤ v ≤ 7 m/min 0.7 kW ≤ P ≤ 1.5 kW 3 bar ≤ p ≤ 7 bar
240
(4)
The maximum value of S/N ratio within the experimental runs was set as the lower limit of acceptable S/N ratio which is 2.148 in the present case. Monte Carlo is an attractive technique which utilizes random numbers in simulation algorithm. The optimization procedure was implemented in the MS Excel package and the procedure employed is described bellow. The first step in the optimization is generation of random numbers ri,j uniformly distributed in the range [0,1] using the function rand. To satisfy the limitations of cutting parameters values, random numbers ri,j were used to generate random numbers qi,j uniformly distributed into the range of interest for each cutting parameter [ qimin , qimax ]. This was accomplished using the following equation:
(
)
qi , j = qimin + ri , j ⋅ qimax − qimin .
(5)
For each cutting parameter, the randomized values which are uniformly distributed in the
M. Madić et al., Tribology in Industry Vol. 36, No. 3 (2014) 236-243
interval of interest are generated and subsequently the objective functions are computed. To obtain near optimal solutions there are basically two approaches: single-stage and multi-stage. The first one is based on performing a large number of iterations in which objective function is computed for each generated stochastic point and the optimum value is selected by comparison. Large number of iterations implies that this approach is computationally more expensive. In order to enhance the accuracy of the method, the multistage approach is proposed in which the computations are performed in several simulations runs [23]. In multi-stage approach the stochastic computations are repeated by modifying the range around the near optimum solution (for each variable) obtained in the previous simulation run. In the optimization procedure the multi-stage approach was implemented by performing 5·103 iterations in the first and 2·103 iterations in the second simulation run. The results of the simulation runs are given in Table 6. The results after simulation run 2 were considered as the acceptable near optimal solutions. Table 6. Results of Monte-Carlo simulation runs. Simulation run 1 Parameter
Range
v (m/min) P (kW)
3-7 0.71.5 3-7
p (bar) Simulation run 2 v (m/min) 6.5-7 P (kW) 1.41.5 p (bar) 3-3.5
Identified S/N value (dB) 6.985 2.514
Ra (µm) 0.692
Table 7. Results of Monte-Carlo simulation runs. v (m/min) 7
P (kW) 1.5
p (bar) 3.5
S/N (dB) 2.728
Ra (µm) 0.729
When comparing the results from Tables 6 and 7 it is seen that there are some deviations between identified near optimal results and the experimental results. One reason for this is that somewhat different cutting parameter values were used. On the other hand, it should be noted that the developed response surface models, used in optimization procedure, already showed some deviation compared to experimental results (Fig. 1). From Table 7, it is seen that cutting speed and laser power converged to the upper limits, while assist gas pressure converged to the lower limit of the cutting parameter range. This indicates that the average surface roughness is directly proportional with assist gas pressure but inversely proportional with cutting speed and laser power. As can be seen, the determined near optimum cutting parameters settings satisfy the requirements of S/N ratio greater than 2.148 and average surface roughness value (bellow 1.6 µm) which is in addition lower than minimum surface roughness of 0.780 µm in Table 3.
1.446 3.305 6.999
2.636 0.6703
1.496 3.349
To experimentally validate the optimization results, one needs to perform the experiment under the optimal cutting conditions (vopt = 6.999 m/min, Popt = 1.496 and popt = 3.349 bar). Considering the technical limitation of CO2 laser machine used for adjusting cutting parameter settings, the confirmation experiment was carried out at a condition closest to the optimum condition. The laser cutting parameters settings in the confirmation experiment with the corresponding average values of S/N ratio and Ra are given in Table 7.
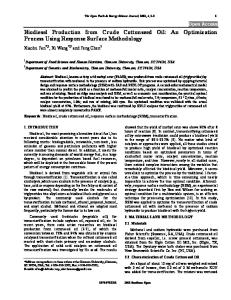
Fig. 2. Cross section sample image of the segment of the cut edge taken at the middle of the cut.
Under the near optimum cutting parameters settings it was observed that size of the HAZ changes from about 30 µm at the laser beam entry side to 40-45 µm at the middle of the the cut edge (Fig. 2). However, maximum transversal penetration of the HAZ in the bulk
241
M. Madić et al., Tribology in Industry Vol. 36, No. 3 (2014) 236-243
material of about 70 µm was measured at the laser exit side. Under the near optimum cutting parameters settings, the kerf width was found to be 0.312 mm.
4. CONCLUSION To achieve high quality and close tolerance along with minimum variability of the laser machined parts, it is of prime importance to determine (near) optimal laser cutting parameter settings. In the context of the laser cutting optimization, this paper presented the application of combined TM-DRSM approach for optimization of the CO2 laser cutting of 2 mm thick structural steel S355J2G3 EN 10025 sheet. To obtain experimental data for surface roughness, the CO2 laser cutting experiment was planned and conducted according to the principles of Taguchi’s experiment design using the L25 orthogonal array. The concept of S/N ratio from TM was used to measure the variance of the average surface roughness. The goal was to determine the near optimal laser cutting parameter values in order to ensure robust condition (maximize the S/N ratio) for minimization of average surface roughness. On the basis of the experimental results for the average surface roughness and calculated S/N ratios, second order response surface models were developed. Using these models the dual response optimization problem was formulated and optimal laser cutting parameter values were obtained by the multi-stage Monte Carlo simulation procedure. Optimization results indicate that the average surface roughness is directly proportional with assist gas pressure but inversely proportional with cutting speed and laser power. The optimized cutting conditions were validated using confirmation experiments.
Acknowledgement This work was carried out within the project TR 35034 financially supported by the Ministry of Science and Technological Development of the Republic of Serbia.
242
REFERENCES [1] C.B. Yang, C.S. Deng, H.L. Chiang: Combining the Taguchi method with artificial neural network to construct a prediction model of a CO2 laser cutting experiment, International Journal of Advanced Manufacturing Technology, Vol. 59, No. 9-12, pp. 1103-1111, 2012. [2] M.J. Tsai, C.H. Li, C.C. Chen: Optimal laser-cutting parameters for QFN packages by utilizing artificial neural networks and genetic algorithm, Journal of Materials Processing Technology, Vol. 208, No. 1-3, pp. 270-283, 2008. [3] M. Kurt, Y. Kaynak, E. Bagci, H. Demirer, M. Kurt, Dimensional analyses and surface quality of the laser cutting process for engineering plastics, International Journal of Advanced Manufacturing Technology, Vol. 41, No. 3-4, pp. 259-267, 2009. [4] B.S. Yilbas: Effect of process parameters on the kerf width during the laser cutting process, Proceedings of the Institution of Mechanical Engineers, Part B: Journal of Engineering Manufacture, Vol. 215, No. 10, pp. 1357-1365, 2001. [5] M. Madić, M. Radovanović, B. Nedić: Correlation between surface roughness characteristics in CO2 laser cutting of mild steel, Tribology in Industry, Vol. 34, No. 4, pp. 232-238, 2012. [6] B.S. Yilbas, F. Al-Sulaiman, C. Karakas, M. Ahsan:, Laser cutting of multilayered kevlar plates, Journal of Materials Engineering and Performance, Vol. 16, No. 6, pp. 663-671, 207. [7] D. Araújo et al.: Microstructural study of CO2 laser machined heat affected zone of 2024 aluminum alloy, Applied Surface Science, Vol. 242, No. 3-4, pp. 210-217, 2003. [8] A. Lamikiz et al.: CO2 laser cutting of advanced high strength steels (AHSS), Applied Surface Science, Vol. 242, No. 3, pp. 362-368, 2005. [9] A.K. Dubey, V. Yadava: Multi-objective optimization of laser beam cutting process, Optics and Laser Technology, Vol. 40, No. 3, pp. 562570, 2008. [10] K. Huehnlein, K. Tschirpke, R. Hellmann: Optimization of laser cutting processes using design of experiments, Physics Procedia, Vol. 5, No. 2, pp. 243-252, 2010. [11] J. Ciurana, G. Arias, T. Ozel: Neural network modeling and particle swarm optimization (PSO) of process parameters in pulsed laser micromachining of hardened AISI H13 steel, Materials and Manufacturing Processes, Vol. 24, No. 3, pp. 358-368, 2009.
M. Madić et al., Tribology in Industry Vol. 36, No. 3 (2014) 236-243 [12] S.K. Dhara, A.S. Kuar, S. Mitra: An artificial neural network approach on parametric optimization of laser micro-machining of die-steel, International Journal of Advanced Manufacturing Technology, Vol. 39, No. 1-2, pp. 39-46, 2008.
[19] A. Sharma, V. Yadava, R. Rao: Optimization of kerf quality characteristics during Nd: YAG laser cutting of nickel based superalloy sheet for straight and curved cut profiles, Optics and Laser Engineering, Vol. 48, No. 9, pp. 915-925, 2010.
[13] D. Dhupal, B. Doloi, B. Bhattacharyya: Optimization of process parameters of nd:yag laser microgrooving of Al2TiO5 ceramic material by response surface methodology and artificial neural network algorithm, Proceedings of the Institution of Mechanical Engineers, Part B: Journal of Engineering Manufacture, Vol. 221, No. 8, pp. 1341-1350, 2007.
[20] M.J. Tsai, C.H. Li: The use of grey relational analysis to determine laser cutting parameters for QFN packages with multiple performance characteristics, Optics and Laser Technology, Vol. 41, No. 8, pp. 914-921, 2009.
[14] S. Chaki, S. Ghosal: Application of an pptimized SA-ANN hybrid model for parametric modelling and optimization of lasox cutting of mild steel, Production Engineering, Vol. 5, No. 3, pp. 251262, 2011. [15] M. Madić, M. Radovanović, B. Nedić: Modeling and simulated annealing optimization of surface roughness in CO2 laser nitrogen cutting of stainless steel, Tribology in Industry, Vol. 35, No. 3, pp. 167-176, 2013. [16] U. Çaydaş, A. Hasçalık: Use of the grey relational analysis to determine optimum laser cutting parameters with multi-performance characteristics, Optics and Laser Technology, Vol. 40, No. 7, pp. 987-994, 2008. [17] A.K. Dubey, V. Yadava: Multi-objective optimization of nd:yag laser cutting of nickel-based superalloy sheet using orthogonal array with principal component analysis, Optics and Laser Engineering, Vol. 46, No. 2, pp. 124-132, 2008. [18] M.F. Chen et al.: Optimized laser cutting on light guide plates using grey relational analysis, Optics and Laser Engineering, Vol. 49, No. 2, pp. 222228, 2011.
[21] C.Y. Nian, W.H. Yang, Y.S. Tarng: Optimization of turning operations with multiple performance characteristics, Journal of Materials Processing Technology, Vol. 95, No. 1-3, pp. 90-96, 1999. [22] N. Chiadamrong: A sequential procedure for manufacturing system design, Science Asia, Vol. 29, No. 1, pp. 57-65, 2003. [23] M.N. Dhavlikar, M.S. Kulkarni, V. Mariappan: Combined Taguchi and dual response method for optimization of a centerless grinding operation, Journal of Materials Processing Technology, Vol. 132, No. 1-3, pp. 90-94, 2003. [24] D.C. Montgomery: Design and Analysis Experiments, Wiley, New York, 1997.
of
[25] R. Ding, D.K.J. Lin, D. Wei: Dual response surface optimization: a weighted mse approach, Quality engineering, Vol. 16, No. 3, pp. 377-385, 2004. [26] G.G. Vining, R.H. Myers: Combining Taguchi and response surface philosophies: a dual response approach, Journal of Quality Technology, Vol. 22, No. 1, pp. 38-45, 1990. [27] M.S. Phadke, Quality Engineering Using Robust Design, Prentice Hall, New Jersey, 1989.
243