74
CHAPTER 6 OPTIMIZATION OF CASTING PROCESS PARAMETERS USING RESPONSE SURFACE METHOD WITH DMAIC
6.1
INTRODUCTION The objectives, quality improvement, including reduction of
variability and improved process and product performance, often are accomplished directly using RSM (Montgomery 2001). It is well known that variation in key performance characteristics will result in poor processes and product quality. Considerable attention is given to process quality, and methodology is developed for using experimental design, specifically for the following: 1. Designing or developing products and processes which are robust to component variation, 2. Minimizing variability in the output response of the product or a process around a target value, 3. Designing products and processes which are robust to environmental condition. Based on the result, Taguchi analysis is significantly varied with the operational conditions and it needs further analysis to make the process more precise. Hence the RSM is applied to optimize the significant parameters of sand casting process through analyzing the process key factors and developing the process fittest in the Six Sigma environment.
75
6.2
PROCESS ANALYSIS FOR DEVELOPMENT More specifically, the green sand casting gives enough green
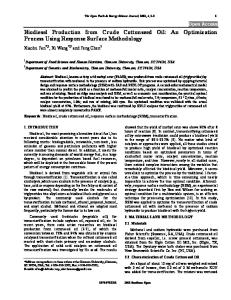
strength to get dimensional stability, provide excellent surface finish and better collapsibility during the knockout. Generally, the moulding procedures of sand casting processes are the same even though the materials used in the processes are different. Hence, detailed analysis is carried out to identify the root causes for the significant parameters impact on casting defects. When the mould is filled with molten metal while the sand is still moist, the method used is called green sand casting. Due to the presence of moisture, the mould lacks permeability and strength and this may result in defects such as blowholes and pinholes in the casting. In spite of this drawback the green sand casting is the most popular of all molding methods and accounts for more than 90% of sand molded castings. With the use of a synthetic sand mixture, this method has gained further popularity. For all mechanized molding, green sand casting is largely employed due to its ease of adaptability and economical operation. The defects can also be minimized by a proper control of process parameters, particularly by keeping moisture initially low. The success of a casting process depends greatly on the properties of the molding sand. These include (i) strength, (ii) permeability, (iii) deformation, (iv) flowability, and (v) refractoriness. In sand-clay ratio, the measure of variation of these properties with effect of water content as shown in Figure 6.1. It is obvious, both from strength and permeability considerations, that there is an optimum water content. At low water content, dry clay powder, being finer than sand grains, fills up the void between the sand particles, and thus reduces the permeability and the effect of volatile matter in the sand casting reduce the molten metal penetration. With higher water content, moist clay forms a coating over the sand particles keeping them further away, thus enhancing the permeability. Beyond the optimum
76
water content, water itself fills up the void and reduces the permeability. Contrary to the common belief that mould strength increases in proportion with the increase in squeeze air pressure, in practice, it is seen that strength increases at a steep rate with pressure only up to about 7kg/cm2. Any further exertion of squeeze pressure causes negligible rise in mould strength. This study of Six Sigma process requires the entire unit of the casting process to be committed to the values towards improvement. During the process planning stage, FMEA method is used to identify the influence on process preparation because outputs from the FMEA analysis are used to determine which failures are likely to appear and what corrective actions are necessary for failure prevention. In order to have efficient process, some additional tools and methods are used in the process optimization. These tools are derived from Six Sigma methodology.
Figure 6.1 Effect of water content on molding sand properties (ASM International Committee, 1990) 6.2.1
Define Phase Earlier there is applied Taguchi analysis to optimize the process
and four of the selected parameters (moisture content, permeability, volatile
77
content and mold air pressure) are more significant to control production defects and therefore, defects occurred per production are stochastic.
Figure 6.2 Process map for flywheel casting process It is this work environment that is taken for analysis and Six Sigma program is tried by the research team to improve the process by application of RSM. In this work, implement group have analyzed the process through DMAIC with RSM. Based on the result of Taguchi analysis the defects are classified and identified. The rejection value is 6.94% and component rejection is mainly due to sand inclusion, blowholes and shrinkage. Process map is used to know the importance of the various processes, their
78
dependence on one another and their influence on quality of castings, it is necessary to understand the entire process in the foundry, which is given in Figure 6.2. 6.2.1.1
SIPOC Diagram Figure 6.3 describes the transformation process of inputs from
suppliers to output for customers and gives a high level understanding of the process, the sub process steps and their correlation to each other as given in Table 6.1. 6.2.1.2
Customer CTQ Requirements The voice of customer data reveals that internal customers are
mainly affected by high rejection percentage of flywheel sand casting process. CTQ characteristics are established and a CTQ Tree, shown in Figure 6.4, is prepared on the basis of the VOC and project objective. Int/National – Automobile suppliers
Supplier
Sand additives ingredients, casting instruments, labors without six sigma training Input
Perform casting process from sand casting techniques using six sigma DMAIC Method
Process
Quality Flywheel castings
Output
Inspection and Logistics, External customers
Customer
Figure 6.3 SIPOC Diagram Flywheel Casting Process
79
Table 6.1 SIPOC Sub Process of flywheel casting process
Process Deliverables
Principal Customers
1. Reduction of rejection percentages. 2. Reduction of cost of poor quality (COPQ). 3. Increase in process sigma level.
Internal customers: 1. Project management group. 2. Manufacturing shops. 3. Inspection departments External customers: 1. Clients / Third party Inspectors. 2. Customer Representatives
Reducing rejection %, Improving customer satisfaction and sigma level of the company Needs
Defining Process Boundaries Process Start Point: Sand preparation , Raw material selection for melting Process Stop Point: Dispatching after Inspection
Defects in the sand casting process
CTQ
Figure 6.4 Critical to Quality (CTQ) Tree The problem has emerged with the application of FMEA method is the large number of KPIV that did not have a significant influence on KPOV. The process planning stage is essential to apply some additional tools to make the process faster and more effective. Six Sigma methodology introduce tools and methods with which the number of KPIV can be reduced to a minimum, or to those variables which have major influence on KPOV. For the case under study, applications of process map and cause-and-effect matrix are proposed and correlated with FMEA for further analysis.
80
6.2.2
Measure Phase Brain storming sessions are conducted by the team working under
chartering and the data are collected for analyzing causes of defects. After intense brain storming, several influencing and controllable process parameters are identified and measured. Out of which, the most significant contributors considered in the current stage, various defects are measured quantitatively and qualitatively due to uncontrollable parameters present in the casting process. Clearly, it is evident from the chart that the process is in control but it requires reducing the defects. The most significant defects considered in the current research are: the blow holes, sand inclusion, cold metal, shrinkage and Slag are responsible for 20.65%, 29.77%, 11.71%, 8.1% and 11.71% of defects in the total production respectively. The most significant defects considered in the current research and it is analyzed in the Pareto diagram as given in Figure 6.5. Only three major defects, which created major changes, are taken into account. Sigma is calculated before implementing DMAIC model and the value is 3.47 at that process capability of 1.16. 6.2.2.1
Process map Normally, a process map as given in Figure 6.2, is a graphical
representation of a process flow that identifies the steps of the process, the input and output variables of a process and the opportunities for improvements. Every process map must be the result of teamwork because it is impossible that just one person could have all the knowledge about the process and hence the importance of the chartering of the team, especially a cross-functional team (Improvement group). 6.2.3
Analyze Phase With the help of the Pareto chart, factors that influenced the
rejection most are identified. Root causes from probable causes are analyzed
81
in order to reduce or eliminate casting defects. Table 4.3, shows the causeand-effect matrix, the summary of problems, with reference to man, machine, method, and materials analysis is prepared. Effect on the right extreme is the quality characteristics that need improvement and on the left are the major causes like work methods, materials, measurement, human source, equipment and the environment.
Pareto Chart of Type of defect 900 100
800 700
80
600 500
60
400 40
300 200
20
100 0 Type of defect No of defect Percent Cum %
0 SI 239 29.8 29.8
BH 161 20.0 49.8
Ohers 150 18.7 68.5
CM 94 11.7 80.2
SL 94 11.7 91.9
SHR 65 8.1 100.0
Figure 6.5 Pareto Chart for Selected Defects 6.2.3.1
Failure Mode Effective Analysis (FMEA) The process capability is calculated for flywheel casting process in
order to know the current casting process performance. According to the results, the process capability of flywheel production is not satisfactory because the Cp is 1.163, which is less than 1.33 (the four-sigma level). FMEA is carried out to identify, define and eliminate known or a potential failure.
82
83
The Risk Priority Number (RPN) is determined by three risk parameters which include Severity Rating (S), Occurrence Rating (O), and Detection Rating (D). FMEA can be divided into two phases as discussed (Theodore T. Allen 2006). The first phase (Measure) is to identify the potential failure modes and to decide the value of Severity, Occurrence and Detection, as given in Table 6.2. In the second phase (Improve), the manager should make recommendations for correct actions, and the RPN needs to be re-calculated after correct actions. The comparison of critical factors of FMEA based on their scale values of cause-and-effect matrix is given in Table 6.3. Table 6.3 The comparison of critical factors based on their scale values Critical factorspriotorised
Cause-andeffect matrix
FMEA
Sand inclusion
315
320
Slag inclusion
260
252
Blow holes
185
175
Shrinkage
135
144
Porosity
126
120
Hot tearing
85
80
Cold shuts
66
64
6.2.3.2
Justification for further process Based on the cause-andeffect matrix, higher values for the corresponding KPOV the critical factors are selected for analysis as second step of cause-andeffect matrix and it is correlated with the FMEA method. Those values are very closer to each other and justified for further range of RSM analysis
Cause-and-effect matrix A Powerful tool in the Six Sigma method, cause-and-effect matrix
which relates the key inputs to the key outputs (customer requirements) using a process map, FMEA and a cause-and-effect diagram as the primary sources
84
of the input information. The key outputs are scored according to their importance, while the key inputs are scored in terms of their relationship to key outputs. In the application of cause-and-effect matrix there are two phases. In the first phase the inputs are correlated to outputs that provide the basis for a Pareto analysis. In the second phase, a new cause-and-effect matrix is started with minimum (three or four critical inputs from the first-phase matrix). The Pareto diagram clearly displays information about the relative importance of the factors of a certain problem. This information helps to identify the most vital and trivial factors, which will be analyzed first. With the help of the Pareto diagram domains of possible improvement are clearly identified and recommended for further action. The results obtained with the cause-and-effect matrix can be used for other analysis and optimizations such as FMEA, DOE and RSM. The Pareto diagram clearly displays information about the relative importance of the factors of a certain problem. This information helps to identify the most vital and the most trivial factors, which will be analyzed first. With the help of the Pareto diagram, Domains of possible improvement are clearly identified and recommended for further action. The detailed Six Sigma process, which helps the entire process of flywheel casting, to reduce the variation in the production is shown in Figure 6.6. The KPIV and KPOV listed in the process map will be used as inputs for the analysis in the Cause-and-effect matrix, as given in Table 6.4. The results of the cause-and-effect matrix are further analyzed with the Pareto diagram and the Pareto diagram helps in prioritizing the different categories taken into account for analysis. The KPOV are rank (score) ordered in accordance with the number of points from the Cause-and-Effect Matrix. The Pareto diagram for the most influential KPOV is shown in Figure 6.7.
85
DOSSIER / OLD PROCESS MAPPING-HISTORY OF FAILURES FOR SIMILAR PRODUCTS
SIX SIGMA
HUMAN FACTORS
TECHNICAL FACTORS
PROCESS MAPPING DEFINITION MEASUREMENT
YES PROCESS CAPABILITY
REDESIGN NO
ANALYSIS
NO
FEASIBILITY TEST
MODIFY DESIGN
YES PROCESS MAP ELABORATION
NO
CAUSE-AND-EFFECT MATRIX JOB SATISFACTION/PROCESS OPTIMIZATION
IMPROVEMENT
PROCESS CAPABILITY
PROCESS PERFORMANCE MEASUREMENT
CONTROL
Figure 6.6 Six Sigma process in foundry
86
Table 6.4 KPIV, KPOV for selected critical factors Operation Process Code OP 1 Raw material OP 1A Sand preparation
KPIV-Key process input variables Not considered Low Compatibility, Use of hot sand Improper moisture, Low Green Strength Low Flow ability, Insufficient Binder Poor Grain Distribution, Insufficient Mulling Time, High moisture Content Operator Unawareness Sharp Corners, Cope Drag Mismatch Design Parameters, Poor Finishing and cleaning, Gating Parameters,Change in runner Dimension, Change In Raiser Dimensions, Impropre air pressure Improper vent holes, Uneven Stripping Improper Ramming, Insufficient Turbulence ,in the Gating System Insufficient permeability, Moisture Content, Insufficient pouring Temperature Operator Unawareness Not considered
OP 1B
Moulding
OP 1C OP 2 OP 3
Inspection Melting Pouring
OP 4 Op 5 OP 5A
Knockout Not considered Inspection Heat treatment Shot Blasting Visual Not considered Inspection Rework Grinding Matching Dispatching
OP 6 OP 7 Op 7A OP 8 OP 9 OP 10
Delay In Pouring Time, Interrupted Pouring, Too long pouring, High pouring rate, Too high height of ladle above pouring cup, Dirty ladles, Strainer core / filter core not used, Repeated use of ladle without replacing linings, Improper Skimming, Insufficient pouring, Temperature, Operator Unawareness
KPOV-Key process output variables Mis run, Cold Shut, Hot Tears, Crack, Shrinkage Slag Inclusion Core Shift Time OF Cycle Core Shift Time of Cycle Sand Inclusion Scabs Cuts and washer Shift Swells Blow Holes Porosity and Pin Holes War page Dirt
Mis run, Cold Shut, Hot Tears, Crack Shrinkage, Slag Inclusion, Core Shift Time of Cycle, Sand Inclusion, Scabs Cuts and washer, Shift, Swells Blow Holes Porosity and Pin Holes War page, Dirt
87
KPOV 350 300
315 260
250 200
185
150
135
126 87
100
85
66
66
60
60
60 4 85
60 4 89
50
48
42
40
50
0 KPOV
Estimation Percent Cum %
Figure 6.7
315 260 185 135 126 87 19 16 11 8 8 5 19 35 47 55 63 68
85 5 73
66 66 4 4 77 82
48 42 3 3 92 94
40 50 2 3 97 100
Pareto diagram for the KPOV based on cause-and-effect matrix
The KPIV are analyzed in the same manner as the KPOV, as shown in Figure 6.8.
KPIV 140 120 100 80 60 40 20 0
123
113 112 97
95
84
77
73
69
67 52
50
50
48
KPIV
ESTIMATION Percent Cum %
Figure 6.8
123113112 97 95 84 77 73 69 67 52 50 50 48 11 10 10 9 9 8 7 7 6 6 5 5 5 4 11 21 31 40 49 56 63 70 76 82 87 91 96 100
Pareto diagram for the KPIV based on cause–and-effect matrix
88
Analysis from the cause-and-effect matrix, score of KPIV, KPOV for operator unawareness, occupied a distinct level (particularly sand inclusion, slag). Hence, before implementing the new methodology, the existing environment is tested as a separate work to this scope of study work by the authors to identify the satisfied level of the workers. The result of enhanced job satisfaction is directed the lower level workers to commit with the sig sigma program implementation before they are motivated by the improvement group and to create the awareness and procedures incorporate with the Six Sigma. 6.2.3.3
Process Performance With the help of FMEA and Pareto Chart, factors that influenced
the most critical factors are identified in the cause - and - effect diagram for corrective action. The selected operational KPIV for the corresponding KPOV factors and variation in the parameters are identified. The improvement on work methods, materials, measurement, human commitment, equipments for the production of defect less flywheel castings is made possible by optimizing process parameters through the application of RSM concepts. 6.2.4
Improve Phase
6.2.4.1
Response surface methodology RSM is applied to green sand moulding process in order to
determine the optimal settings of significant process parameters that make the moulding process “robust”. This is done by systematic planning and execution of experiments and analysis of experimental result based on response methods, followed by validation of results for verifying the correctness of the inferences drawn. The objective of quality improvement, including reduction of variability and improved process and product performance, often are accomplished by directly using RSM. It is well known
89
that variation in key performance characteristics causes poor processes and poor product quality. The following sequential procedure for fitting a series of regression models to the output variables (Montgomery 2005 and Sudhir Kumar et al 2007) is given below 1. The casting defects are selected as the most representative quality characteristics in sand casting process because it is related to many internal defects. The target of the sand casting process is to achieve “lower casting defects” while minimizing the effect of uncontrollable parameters. 2. The most significant parameters that cause variation of the quality characteristics is selected. 3. The sand casting process under the experimental conditions dictated by the RSM and based on the experimental conditions, data is collected. 4. The Analysis of Variance (ANOVA) Table is generated to determine the statistical significance of the parameters. Response graphs are plotted to determine the preferred level for each parameter is analyzed. 5. Decisions regarding optimum settings of the control parameters and record the results of each of the parameters at their new optimum level are analyzed. 6. The optimal results of the casting process are verified and standardized.
90
RSM is basically a sequential procedure for fitting a series of regression models to the output variables (Sahoo et al 2008). The specific objectives of this technique are summarized as follows: 1. Estimating a functional relationship between one or more responses and a number of independent variables that influence the responses. 2. Searching and exploring the optimum operating conditions for the system. Based on the Taguchi’s analysis, F-ratio value shows that the significant factors are the control factors in the order of permeability, moisture content, volatile content and mould pressure in the green sand casting process, since it contributes a greater percentage than all other control factors. Hence these four significant process parameters are taken for surface analysis to optimize the parameter setting to be more accurate. 6.2.4.2
RSM experimental design In many engineering fields, there is a relationship between an
output variable of interest ‘y’ and a set of controllable variables {x1, x2, . . . , xn}. In some systems, the nature of the relationship between y and x values might be known. Then, a model can be written in the form is given in Equation (6.1): y
f x1 , x2 , x3
xn
£
(6.1)
where y represents noise or error observed in the response (percentage of casting defects) between the response y and x1, x2, . . ., xn of n quantitative factors (four factors). The function ‘f ‘ is called response surface or response function. The residual £ measures the experimental errors. For a given set of independent variables, a characteristic surface is responded. When the
91
mathematical form of ‘f’ is not known, it can be approximated satisfactorily within the experimental region by polynomial. Higher the degree of polynomial, better the correlation. But at the same time, costs of experimentation become higher. In applying the RSM, the dependent variable is viewed as a surface to which a mathematical model is fitted. For the development of regression equations related to various quality characteristic of sand casting process is given in Equation (6.2), k
y
b0
k
bii xi2
bi xi i 1
i 1
bij xi x j £ i
(6.2)
j
The ‘y’ is response (percentage of casting defect) and ‘b’ regression coefficients used in the above model and it can be calculated by means of using quadratic method. In order to estimate the regression coefficients, a number of experimental design techniques are available. Usually a second order model is utilized in RSM (Kwak and Anbari 2005 and Montgomery 1991). The casting defects are measured for each run observed and identified by the skilled worker. The present study proposes to measure the performance criteria of the RSM process through investigating the effect of working parameters, namely, moisture content, permeability, volatile content and mold pressure. The experimental results are statistically analyzed and modeled through RSM. Based on the findings, the optimized process parameters are taken for experiment and better performance obtained in the production process is confirmed. The comparison between the existing process and the RSM process has been attempted in this work and the results have been discussed in detail. 6.2.4.3
Response Surface Analysis The accuracy and effectiveness of an experimental program
depends on careful planning and execution of the experimental procedures.
92
With a view to achieving the aforementioned aim, in this study, experiments are carried out according to a central composite second-order rotaTable design based on RSM.. In the present experimental study, the following controllable process parameters are identified to carry out the experiments. The second order response surface representing the casting defects can be expressed as a function of casting parameters such as Moisture Content (A), permeability (B), volatile content (C) and mold pressure (D).The working range is selected on the basis of data given by the company.The experiments are designed at three levels as shown in Table 6.5 . Table 6.5 Casting Parameters and their Levels Parameter Process parameters designation
Range
Level 1
Level 2
Level 3
3-3.6
3
3.3
3.6
A
Moisture content (%)
B
Permeability
120-190
120
155
190
C
Volatile content (%)
2.1-3.5
2.1
2.8
3.5
D
Mould pressure (kg/cm2)
5-7
5
6
7
The working range is selected on the basis of data given by the company.Table 6.6 presents the experimental design matrix and experimental results. 6.2.4.4
Remedial actions for technical factors The following remedial measures are taken and it is tested with the
improvement group. 1.
Timer is provided to make a constant flow of ramming, with the
same
pressure
(70kg/sq.cm./6sec)
given
in
the
design
value
93
2.
As per the direction of sand casting procedures, the designed and calculated number of vent holes per box is provided as min 8/ box. The ramming time is increased to 5-6sec.
3.
The moisture content in green sand should always be maintained at 3.3% to 3.6%. It is continuously checked and maintained during the experiments which provided good results.
4.
Use of dirty ladles (recommended Teapot Pouring Ladles) is avoided. Addition of slag powder prior to magnesium treatment minimizes slag formation.
5.
Slag entering into the ladle from the furnaces and into the gating system from the ladle is prevented by filters / strainers.
Table 6.6 The Response Surface Experimental Design Matrix and Results Factor A Factor C Factor D Factor B Moisture Volatile Mold Run Permeability content content pressure number percentage percentage Kg/sq.cm
Percentage of defects-Response Actual value
Predicted value
1
3.4
155
2.1
7
7.04333
7.09
2
3.3
155
2.8
7
7.07333
7.38
3
3.3
155
2.8
6
7.77333
7.46
4
3.6
155
2.8
5
7
7.33
5
3.5
120
2.1
6
7.12
7.74
6
3
155
2.8
5
7.41333
7.73
7
3
190
2.8
6
7.77333
7.62
8
3.3
120
3.5
6
7.05
7.15
9
3.3
190
2.1
6
7.28
7.83
10
3.3
155
2.8
6
7.31333
7.46
11
3.3
190
2.8
5
8.5
8.19
12
3.3
155
3.5
5
7.42
7.56
13
3.3
155
2.8
7
7.5
7.38
94
Table 6.6 (Continued) Factor A Factor C Factor D Factor B Moisture Volatile Mold Run Permeability content content pressure number percentage percentage Kg/sq.cm
Percentage of defects-Response Actual value
Predicted value
14
3.5
155
3.5
6
7.92667
7.67
15
3.6
155
2.1
6
8.01
7.35
16
3.3
155
2.8
6
7.06
7.46
17
3.3
190
2.8
7
9
8.82
18
3.6
190
2.8
6
8.28
8.35
19
3
120
2.8
6
6.65667
6.69
20
3.6
155
3.5
6
7.5
7.6
21
3
155
2.1
6
6.78667
6.63
22
3.3
155
2.8
6
7.43333
7.46
23
3.3
155
2.1
5
8.24
8.19
24
3.3
155
3.5
7
7.70667
7.94
25
3.6
120
2.8
6
7.45333
7.41
26
3.3
155
2.8
6
7.93
7.46
27
3.3
120
2.8
7
7.05667
6.76
28
3.3
120
2.8
5
8.8
8.38
29
3.3
190
3.5
6
8.8
8.83
6.
Skimming action on the flowing metal in the runner is provided by designing the recess in the runner into which slag is trapped.
7.
Gating is designed with metal filters / strainers to prevent metal spraying and turbulence during metal filling is arranged.
8.
On top of the moulding, slag barriers are used to filter the molten metal. The ladle travel Time is minimized by arranging overhead Trolley, which travelled the distance between the furnace and the mould box very vast. Hence the traveling time of the molten metal is reduced and the molten
95
temperature is maintained effectively. The pouring time also is controlled and interrupted pouring is avoided. 9.
Slag resistance charge materials are used. Sand mixing time is checked and maintained as per the design value. Cooling system of sand from the foundry returns is arranged to increase the sand efficiency.
10. The collection of sand deposited in the bottom of the Muller obstructed the sand mixing process and little amount of sand is deposited without mixing. It reduced the efficiency of the mould. Hence sand mixing is done with help of the timer. 6.2.5
Control Phase The Control stage is the last and final stage and its sole purpose is
to preserve the optimized response obtained from the experiments. For complete success of Six Sigma, proper documentation of the process is recommended. The process stays in control after the solution has been arrived and the out of control state is reduced. The associated special causes are determined and action is taken to correct the problem before non-conformities are produced. The critical process parameters are continuously monitored and the documentation maintained and updated with information like moisture content, permeability, and loss on ignition, compressive strength, volatile content, vent holes, pouring time, pouring temperature and mould pressure at regular intervals. Statiscal process control is a quality control technique to ensure that the key variables remain within the maximum acceptable ranges under this process. The expected results and improvements are achieved and recommended for further approach. Then the company is advised to document the process and provide training to the workers with the help of Six Sigma improvement group.
96
6.3
SUMMARY The RSM optimization procedures and casting process parameters are given in this chapter. Taguchi analysis is significantly varied with the operational conditions and it needs further analysis to make the process more precise. Hence the RSM is applied to optimize the significant parameters of sand casting process. Last chapter, there is applied Taguchi analysis to optimize the process and four of the selected parameters (moisture content, permeability, volatile content and mold air pressure) are more significant to control defects and therefore, defects occurred per production are stochastic. It is this work environment that is taken for analysis and Six Sigma program is tried by the research team to improve the process by application of RSM through DMAIC. The most significant defects considered in the current research and it is analyzed in the Pareto diagram is given. Only four major defects, which created major changes, are taken into account. Sigma is calculated before implementing DMAIC with RSM model and the value is 3.47 at that process capability of 1.16. The FMEA, cause and effect diagram are also used. The detailed result analysis given in the chapter 10.