JOURNAL OF BACTERIOLOGY, May 1982, p. 572-581 0021-9193/82/050572-10$02.00/0
Vol. 150, No. 2
Transcription in Bacteria at Different DNA Concentrations GORDON CHURCHWARD,t HANS BREMER,* AND RY YOUNGt The University of Texas at Dallas, Richardson, Texas 75080 Received 19 June 1981/Accepted 9 December 1981
The effect of changing the DNA concentration on RNA synthesis, protein synthesis, and cell growth rate was studied in Escherichia coli B/r. The DNA concentration was varied by changing the replication velocity or by changing replication initiation in a thymine-requiring strain with a mutation in replication control. The results demonstrate that changes in DNA concentration (per mass) have no effect on the cell growth rate and the rates of synthesis (per mass) of stable RNA (rRNA, tRNA), bulk mRNA, or protein or on the concentration of RNA polymerase (total RNA polymerase per mass). Thus, transcription in E. coli is not limited by the concentration of DNA, but rather by the concentration of functional RNA polymerase in the cytoplasm. Changing the DNA concentration does, however, affect fully induced lac gene activity, here used as a model for constitutive gene expression. The magnitude of the effect of DNA concentration on lac gene activity depends on the distribution of replication forks over the chromosome, which is a function of the replication velocity. Analysis of these data reinforces the conclusion that transcription is limited by the concentration of functional RNA polymerase in the cytoplasm. Is the rate of transcription initiation in bacteria limited by the concentration of DNA or by the concentration of functional RNA polymerase? Furthermore, is the rate-limiting step the binding of RNA polymerase to the promoter or the formation of an active initiation complex? These questions are important for a quantitative understanding of bacterial gene expression, especially for the class of genes that are constitutively expressed. The growth rate-dependent variation in the expression of such genes has been called "metabolic regulation" (35). It has been argued that such regulation results wholly, or in part, from a limitation by the DNA concentration (9, 16, 27) or, alternatively, by functional RNA polymerase (3, 6, 32). The question has eluded experimental solution because of the difficulty in manipulating the two parameters in vivo without changing additional parameters that affect transcription (see below). We have previously studied the properties of a mutant of Escherichia coli B/r, strain TJK16, which has a lower DNA concentration than its wild-type parent due to a mutationally altered control of initiation of chromosome replication (10, 12). TJK16 is auxotrophic for thymine, and its DNA concentration can be further lowered by growing it at low thymine concentrations (12). Therefore, this strain is useful for studying t Present address: Universitd de GenFve, Departement de Biologie Moleculaire, CH-1211 GenEve 4, Switzerland. t Present address: Texas A&M University, Department of Medical Biochemistry, College Station, TX 77843.
572
the effects of varying DNA concentration on the rate of in vivo transcription. The results suggest that in both B/r and TJK16, DNA is transcribed under conditions of DNA excess; i.e., transcription is limited by the concentration of active RNA polymerase rather than by DNA. In E. coli only 20 to 30% of the total RNA polymerase enzyme is actively engaged in transcription (RNA chain elongation) at any given time, whereas 70 to 80% of the RNA polymerase appears to be inactive (39). Since the results here indicate that DNA is not limiting the rate of transcription, the inactivity of RNA polymerase must be caused by other factors rather than a low DNA concentration. MATERLALS AND METHODS Bacterial strains and growth conditions. The bacteria used were E. coli B/r A (ATCC 12407; 22) and E. coli TJK16, which is a thyA deoB derivative of E. coli B/r A obtained from J. Kwoh (M.S. thesis, University of Texas at Dallas, 1975). NF955 ilv thr leu thi (A b515 b519 c1857 S7 A dilv5), used to prepare X dilv DNA for hybridization studies, was kindly provided by N. Fiil. Growth conditions were as described previously (23, 39). Determination of cell mass, DNA, protein, and RNA. Cell mass (units of optical density at 460 nm [OD4w] per 109 cells) and DNA (colorimetric assay) were determined as described previously (7, 12). There was no significant difference between the plating titer and the particle concentration for either strain used. To determine protein and RNA, 5-ml samples were precipitated with 1 ml of 3 M trichloroacetic acid, filtered through glass fiber filters (Reeve Angel; 984H),
VOL. 150, 1982
GENOME CONCENTRATION AND GENE ACTIVITY
washed with tap water, dried, and placed in glass vials. After hydrolysis with 2.0 ml of 0.2 N NaOH at 23°C for 20 h, 0.5 ml of the hydrolysate was removed for estimation of the protein content by a modification of the method of Lowry et al. (7, 28). The protein assays were incubated for 20 h at 23°C. Under these conditions an absorbancy at 750 nm/OD40 ratio of 1 corresponds to 9.1 x 10¹⁷ amino acids per OD460 unit of culture (calibration with bovine serum albumin). For RNA, the remaining alkaline hydrolysate (after removal of the sample for estimation of protein) was treated with an equal volume of ice-cold 0.5 M perchloric acid to precipitate protein and DNA and filtered through a Bact-T-Flex membrane filter (Schleicher & Schuell Co.; 0.45-p.m pore size). The absorbancy at 260 nm of the ifitrate was determined. An absorbancy at 260 nm/ OD4w ratio of 1 corresponds to 4.5 x 10¹⁶ RNA nucleotides per OD4w unit of culture (calculated from the molar extinction of E. coli RNA at acid pH). The reproducibility of the colorimetric assays for DNA, RNA, and protein is shown in Table 1. Determination of 3-galactosidase activity. Enzyme activity in fully induced cultures was determined by using standard methods (15), except the reaction was carried out at 23°C for 30 min. Determination of the fractional rate of stable RNA synthesis. Samples (0.5 ml) of culture were removed and labeled with 5 ,ul of [5-3H]uridine (Schwarz/Mann; 2.5 .Ci/5 ,ul, 21 Ci/mmol) for 1 min. The pulse was terminated by the addition of lysing medium (5), and the sample was immediately placed in a boiling water bath for 1 min. The fraction of label in rRNA was determined by hybridization to A ilv5, which carries an rRNA gene (13). Phage DNA was prepared after induction of NF955 by the method of Miller (31) and loaded onto Bact-T-Flex filters (0.45-p.m pore size, 10 to 25 p.g/fflter) after alkaline denaturation. Hybridization was carried out in scintillation vials containing 1 ml of 2x SSC (lx SSC is 0.15 M NaCl-0.015 M sodium citrate), 0.5% sodium dodecyl sulfate, 0.02 M EDTA, at 67C'for 18 h. Each vial contained two DNA ifiters, a blank ifiter without DNA or with heterolo-
573
A or T5 DNA, approximately 0.05 ,ug of pulselabeled RNA, and approximately 0.005 ,ug of purified (18) "C-labeled rRNA as a standard to determine the hybridization efficiency. In control experiments it was found that nonspecific hybridization to filters loaded with A or T5 DNA was indistinguishable from binding to blank filters. After corrections for background and hybridization efficiency the fraction of pulse label in rRNA (1,4to) was determined. The fractional rate of synthesis of stable RNA, rjrtot, was obtained from 41 + [0.86 l4,, by using the formula: r,/rt., = ( - (4ltw)] x 0.86}. This formula takes into account the different mole fractions of pyrimidines in stable and mRNA (0.43 and 0.5, respectively; ratio, 0.86) and the fraction of stable RNA that is rRNA (0.86). The synthesis rate of stable RNA, r,, includes the spacer material in the stable RNA precursor. The relative rate of mRNA synthesis, rSrtot, is equal to the difference 1 - rjrtt,; r,0t is the total instantaneous rate of RNA synthesis, including mRNA and unstable spacers in stable RNA precursors. Determination of RNA polymerase. Determination of RNA polymerase was as described previously (39) from the amount of , and 1B' RNA polymerase subunit protein found after sodium dodecyl sulfate-polyacrylamide gel electrophoresis.
gous
RESULTS Two ways of changing the DNA concentration.
The strain TJK16 is a derivative of E. coli B/r which, in addition to the thyA deoB markers conferring a low-thymine requirement, has a third mutation which increases its "initiation mass" (10, 12). Since TJK16 has a greater cell mass per replication origin, it has less DNA per mass, i.e., a lower DNA concentration, in comparison with the B/r parent at any growth rate (Fig. la). At high thymine concentration (>10 p,g/ml), the DNA chain elongation in this strain is indistinguishable from that in the parent strain
TABLE 1. Reproducibility of colimetric assays for DNA, RNA, and protein DNA
Dayaw A60 Da~
b
Protein
RNA
Deviaiion btion
from avg (%)
260
iion from avg (%)
b 750
Deviation
from avg (%)
-8.0 -2.0 0.486 -2.0 1.244 0.337 -4.1 0.507 1.252 -1.3 0.354 +3.0 0.517 -2.2 1.258 -0.9 0.355 +3.3 0.510 +0.6 -3.5 1.277 +4.7 0.360 +2.7 0.543 -3.8 4 1.221 0.333 -3.1 +0.1 0.574 +8.6 1.270 -1.1 0.340 0.514 -2.7 5 +1.2 1.284 -2.6 0.335 +3.2 0.527 1.310 -0.3 +3.3 0.355 0.553 +4.6 -0.7 1.260 -3.7 6 0.331 0.554 +4.8 +3.6 1.314 -1.7 0.338 0.529 a = 2.3% a = 5.7% a = 3.2% 1.269 0.344 Avg or crc a Ten samples (10 ml each for DNA and 5 ml each for RNA and protein) were taken simultaneously from the same culture, chilled on ice (B/r in glucose minimal medium, r = 43 min, OD460 = 0.98), precipitated with trichloroacetic acid, and collected on glass fiber filters immediately, but further processed on different days as indicated. b Blank values subtracted. I Standard deviation, a (%) = NMT/£(n - 1); A, deviation from average in percent; n, number of samples (10). 1
574
CHURCHWARD, BREMER, AND YOUNG
0E,t I,ot
-
J. BACTERIOL.
120 E
X
o0
~~~ 1.0 ~ ~ ~~~~~ 0
~A t Y
1.0 EE 8
.
V.
S
0
C~20"
3
0 ' n
.
.2 0
B/ lo6 E
b
U 0
~8 N
' ~~~~~~~~~~~~E
0
*0
Li~~~~~ g ~6 -o 0 0
ZO
60
6 03
E. . 160 C
CO
0~~~~~~~~0 N TJK1 groing
10
1 C
0 6-
n20,ugof thyin 4
pe
O.Ec 1 ontrpeet ml(-1r1,go8hmieprm
h
vrg
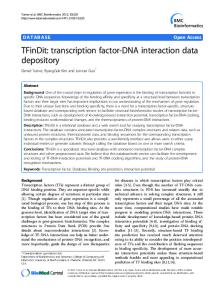
1.0 .0 -0 3.0 FIG. 1. Concentration of DNA and RNA in E. coli B/r and TJK16. Comparison of the concentrations of DNA (DNA/OD4w unit, panel a), RNA (RNA per OD4w unit, panel b; RNA per protein, panel c) in E. coli B/r (0) and TJK16 growing in 20 ~L of thymine per ml (A) or I p.g of thymine per ml (EJ). Each point represents the average of four values from one culture (two duplicate samples taken a doubling time apart). For estimation of the absolute DNA concentration it was assumed that 1 OD4w unit corresponds to 0.3 ,ul of cell volume (12). For conversion of the RNA/protein ratio into the fractional rate of synthesis of ribosomal protein, ar (24), it was assumed that 83% of the bacterial RNA is rRNA (14% tRNA [17, 41] and 3% mRNA [26, 33]), and that a 70S ribosome contains 6,300 amino acid residues in protein and 4,720 nucleotide residues in rRNA. 2
(11), i.e., the thyA deoB mutations have no effect. This implies (14) that at high thymine levels the distribution of replication forks on the chromosome and the relative gene dosages (number of gene copies per genome equivalent of DNA) are the same in B/r and TJK16. Only the effects of the initiation mutation are then apparent under these conditions, i.e., the concentration of all genes in TJK16 is reduced by the same factor. In a "step-up" experiment the velocity of replication forks is increased by increasing the concentration of thymine in the medium from an initial low concentration (34). This changes the distribution of replication forks over the chromosome, i.e., the chromosomes become less branched because rounds of replication are completed faster. As a result, genes far from the replication origin increase in concentration, but genes near the origin do not (2, 9). Figure la shows that average gene concentrations (DNA/
OD40 unit) in TJK16 increased with increasing thymine concentration. The concentration of DNA in bacteria is also a function of growth rate (9, 21); in E. coli B/r and in the Thy- initiation mutant TJK16, the DNA concentration decreases with growth rate (observed above 0.6 doublings per h) and reaches a minimum level above 1.5 doublings per h (Fig. la). Assuming that 1 OD40 unit of cells has a volume of about 0.3 pl (12), intracellular concentrations of DNA are estimated to vary between 5 and 25 mg/ml depending on the growth rate and replication velocity (Fig. la). RNA polymerase concentration and activity. The amount of RNA polymerase 1B and I' subunit protein was determined for E. coli B/r and TJK16 growing in glucose-amino acids medium at high and low thymine concentration (Table 2). Assuming that each subunit was part of a complete polymerase core enzyme, the fractional rate of accumulation of RNA polymerase, aop,,
GENOME CONCENTRATION AND GENE ACTIVITY
VOL. 150, 1982
TABLE 2. Accumulation of RNA polymerase (ap = RNA polymerase protein per total protein) in E. coli B/r and TJK16 growing in glucose-amino acids medium and, in the case of TJK16, supplemented with 20 or 1 ,ug of thymine per ml as indicated Strain
B/r TJK16 TJK16
Thymine Doubling Protein concn time concna (pLg/ml) (min) (mg/ml)
0 20 1
opb (%)
25 27 27 30 30 28
2.36 1.59 1.89 2.22 2.08 2.13
1.28 1.29 1.30 1.39 1.16 1.49
30 31
2.74 2.44
1.25 1.31
28
1.94
1.46
Avg ap
1.29
1.35 1.34
1 [l33]c]
B/r
0
25
2.36 ] 1 2
1.l2 ]
1.28
a Protein concentration in each sample used for electrophoresis was determined by the method of Lowry calibrated with bovine serum albumin. b a1p, was calculated as micrograms of core RNA polymerase x 100 per microgram of total protein; average of six values (two slots on three gels) for each culture (one horizontal line). Each culture growth was repeated three times resulting in slightly different doubling times. Each gel also contained two slots with a known amount of bovine serum albumin for calibration. c The reproducibility of the estimate from gel to gel is shown by the six values which resulted in the average ap value of 1.28%. The brackets indicate the two slots from one gel.
575
tions of exponential growth and for doubling times of less than 60 min, this stable RNA is 86% rRNA and 14% tRNA (17, 41). Thus, at a given growth rate, the rates of rRNA and tRNA synthesis per OD40 unit were independent of DNA concentration. However, the synthesis rates per gene did depend on DNA concentration: in TJK16, with all genes (including rRNA genes) at lower concentrations as compared with B/r, the transcription per gene was correspondingly higher (Fig. 2). The transcription of rRNA genes was also a strong function of growth rate, increasing from 3 to 30 (B/r) or 12 to 50 (TJK16) transcriptions per rRNA gene per min over a two- to threefold range in growth rate (Fig. 2). Ribosome synthesis and function. The amount of RNA per protein (ratio R/P, proportional to the number of ribosomes per amount of protein) is an indicator of ribosome synthesis and function (Fig. ic; ar = ribosomal/total protein); obviously the denominator of the ratio RIP represents the product of ribosome function (ribosomes make protein), whereas the numerator is essentially a measure of the number of ribosomes. RNA per protein was found to increase with growth rate in an identical manner in wildtype E. coli B/r (Fig. lc) and in TJK16, both at high and at low levels of exogenous thymine (Fig. lc). This means that ribosome synthesis and function are independent of DNA replication, at least within the limits represented by wild-type B/r and the replication mutant TJK16. mRNA synthesis. The relative proportions of stable and mRNA synthesis were the same in B/r and TJK16 (Table 3); thus, bulk mRNA synthe0
4, 50
was found to be about 1.33% (range, 1.29 to 1.35% [percentage of total protein that is RNA
polymerase]) for both strains and independent of thymine concentration. Since mRNA and stable RNA synthesis per OD460 unit were the same for both strains (see below), it seems likely that also the concentrations of actively transcribing RNA polymerase molecules are the same. The observation that RNA polymerase synthesis was independent of DNA concentration is important for models of RNA polymerase gene (rpoBC) control; it means that either the concentration of the presumed control factor (37) is in great excess over its binding sites on the DNA (see below), or the activity of this factor itself is controlled. RNA concentrmtion and stable RNA synthesis. The concentration of RNA (amount of total RNA per OD4w unit) increased with growth rate in both strains; at a given growth rate, the RNA concentrations were not significantly different in B/r and TJK16 (Fig. lb). Most (-97%) of the bacterial RNA is stable (26, 33); under condi-
40 C30
-
TJKI16
.2 20
-
0 C)
B/r
10
0
10
20
Growth rate (doubl./h) FIG. 2. Transcription of rRNA genes in B/r and
TJK16 (at any thymine concentration), calculated from the rate of rRNA synthesis in nucleotides per minute per genome [(drRNA/dt)/genome = RNA/ genome x 0.83(1n2/T); RNAlgenome is the ratio of curves in Fig. lb and a; 0.83 is the fraction of total RNA that is rRNA, assuming 14% tRNA (17, 41) and 3% mRNA (26, 33); r is the doubling time] and from the number and map locations of the seven rRNA genes (19), using the formula for the relative gene dosage from reference 2 and from the number of nucleotides per ribosome (4,720).
576
CHURCHWARD, BREMER, AND YOUNG
J. BACTERIOL.
TABLE 3. Relative proportions of stable and mRNA synthesis in E. coli B/r and TJK16 growing in glucose minimal medium (TJK16 supplemented with 20 or 1 Rg of thymine per ml, as indicated) Total cpm in hyRelative proportions of: Strain
Thymine concn
(Ijg/ml)
B/r
TJK16
0
20 1
Doubling time (min)
bridization mix
3H
a
14cb
Hybridization efficiencyc (%)
Stable RNA synthesis Avg %
51551
4
46
57 49 46 55 481
48 4
52e
%d
48 46 { 45 45 46 45 46
5616
6029 6029 6573 5735 5963 2638 3125
258 258 258 290 380 368 380 368
64 34 50 22 82 84 85 92
mRNA
synthesis (avg %)
52
5
48 52 a 3H-pulse-labeled RNA. b ['4C]rRNA (purified) added to hybridization mixture for determination of the hybridization efficiency. c The differences in hybridization efficiency are mainly due to differences in the amount of A dilv DNA loaded to the filters. In the B/r experiments, about 10 Fg of DNA was used per filter; in the TJK16 experiments, about 25 p.gd of DNA was used. Each value given is the average from three hybridization vials. e The slightly higher mRNA values for TJK16 in comparison with B/r mean that the rate of total RNA synthesis in TJK16 is 2 to 6% higher than in B/r (despite the lower DNA concentration in TJK16). This difference is experimentally not significant.
sis, like stable RNA synthesis per OD4w unit, was not affected by changes in DNA concentration. To focus on a particular mRNA, we compared lac transcription in the two strains. Most mRNA synthesis is specifically regulated; to observe only the effects of gene concentration and polymerase availability, we used conditions where the lac operon was physiologically constitutive (i.e., maximally induced). Since the position of the lac genes is midway in the replication path (1), there is always about 1 lac gene per genome equivalent, regardless of growth rate. (This is not true for genes near the origin or the terminus of replication.) Thus, measuring the relative amount of DNA per OD4w unit is the same as measuring the relative concentration of lac genes. The synthesis of lac mRNA was determined indirectly from the synthesis of total mRNA and from the synthesis of P-galactosidase enzyme (see below). The results depended on the kind of experimental condition that was used to change the DNA concentration, i.e., whether it was due to a change in replication velocity or due to a change in replication initiation. These two conditions are examined sepa-
rately below.
(i) Gene activities during a step-up. A replication velocity step-up was found to have no effect on the rate of synthesis (per mass) of stable RNA (Fig. 3b), bulk mRNA (Fig. 4b), and protein (Fig. 3b). Constitutive ,B-galactosidase synthesis per mass increased by 40%, compared with the control culture (Fig. 4a), in agreement with previous observations (9). Since the syn-
thesis per OD40 unit of 3-galactosidase is essentially the fractional rate of lacZ transcription per total mRNA transcription, the apparent increase in lac expression per OD460 unit actually stemmed from a constant rate of transcription per lac gene and an increased number of lac genes per mass (see below) (Table 4). Since the genes for rRNA are clustered near the origin of chromosome replication (1), and since a step-up does not affect replication of the origin (4, 34), the concentration of rRNA genes and the rate of rRNA synthesis per rRNA gene remain unaltered by the step-up (Fig. 2; the curve for TJK16 is valid for any thymine concentration). Thus, changes in DNA concentration brought about by changes in replication velocity affect neither rRNA nor constitutive lac gene activities (Table 4). (Bi) Gene activities after a change in replication initiation. In Fig. 5, the ratios of lac gene concentrations in B/r and TJK16 are shown for high thymine levels when the only difference between the two strains was in the control of replication initiation. The mutant had from 50 to 70% of the lac gene concentration of the wild type, depending on the growth rate. The P-galactosidase synthesis per OD4w unit was nearly equal in the two strains, although the synthesis in the mutant relative to the parent B/r decreased somewhat with increasing growth rate. By dividing the enzyme synthesis per OD4w unit by the number of lac genes per OD4w unit (-DNA/OD4w), one obtains a measure for the relative transcription ra,te per lac gene (see below). At all growth rates, constitutive transcription per lac gene was
GENOME CONCENTRATION AND GENE ACTIVITY
VOL. 150, 1982
577
E
60 Nu C
40_ 4Z; z
cr .20 N-
02
0 E 0
0 P._
En 0
E
=
a),
10 °
1.
a8
X _
r_
0
Ia -60
30 60
-30
0
Time after step-up (min) FIG. 3. Transcription in TJK16 (growing in glucose-amino acids medium + 1 mM IPTG) during a step-up in the replication velocity brought about by an increase in thymine concentration from 1 to 20 ,ug/ml. (a) Mass accumulation; dilutions as indicated (dilution factors). (b) Accumulation of DNA, RNA and protein; DNA accumulation (---) calculated (4).
30% higher in the mutant. A different extent of catabolite repression in the two strains was not involved; the ratio of the rates (not the absolute rate) was independent of the presence of 0.01 M exogenous cyclic AMP (data not shown), shown in previous work (15) to be in excess of the amount necessary to maximally reduce catabolite repression. Thus, lac gene transcription increases when the concentration of all genes is reduced proportionately. Clearly, DNA concen,o
a
-
0.
4e0.
tration does not limit lac gene expression in balanced growth. DISCUSSION Effects of DNA concentration on the total rate of RNA synthesis. In the past, the DNA concentration in bacteria was found to vary with the growth rate or with the replication velocity (9, 21), but in these cases the accompanying gene regulation and changes in replication fork patO-