Journal of Economic Cooperation, 29, 4 (2008), 71-92
TRADE, INDUSTRY AND ECONOMIC GROWTH IN BANGLADESH Parves Sultan1 This study is unique as it considers industry value added as a possible source of economic growth in addition to export and import. The key research questions of this study are: to what extent trade and industry value added contribute to the economic growth of Bangladesh? Are there any causal and long run relationships among export, import, industry value added and gross domestic product in Bangladesh? As expected, the regression results show that growth rate of industry value added can contribute more than the growth rate of export and import to increasing the growth rate of GDP for Bangladesh. We find that there is cointegration and a long run relationship between GDP and industry value added in the bivariate cointegration test. We also perform causality tests. The results clearly show that only import and/or export cannot contribute to the economic growth unless industrial sector is taken into account. 1. Introduction Bangladesh practiced restrictive trade policies since its independence in 1971, which continued for one decade. In 1982, Bangladesh started moving towards outward orientation by initiating the structural adjustment programs in different sectors of the economy. During the period between 1971 and 1982 four military coups occurred, which continued until the end of 1990. Therefore, the socio-economic conditions were vulnerable between 1971 and 1990. This is, in turn, one 1
School of Business, Bangladesh Open University P/O: Bangladesh Open University, Gazipur 1705, Bangladesh The author also would like to present his gratitude to his supervisor Professor Dr. Dipendra Sinha for his helpful comments and his thanks to the anonymous reviewers and editor for their useful comments in preparing this article.
72
Journal of Economic Cooperation
of the important reasons for which the democracy of Bangladesh and the process of institutionalization have been affected repeatedly. However, the 1982 measures were followed by further comprehensive changes in 1985–1986 and 1991 (Hossain and Karunaratne, 2001). A country‟s trade is closely related to its stage of development and degree of industrialization. As a nation advances economically, the structure of its foreign trade alters to correspond with a shifting pattern of resource endowment and comparative advantage (Hultman, 1967). Hultman also states that in most development planning exercises, the importance of exports to domestic growth has been approached in terms of the acquisition of foreign exchange for the import of goods and services. In other words, export growth is seen as a determinant of import capacity, which in turn, is a determinant of the level of domestic economic activities. In recent years, Bangladesh has been achieving not only a substantial increase in the volume of exports but also an important change in the composition of exports away from traditional items such as jute and jute products, and towards new manufactured products such as ready-made garments. Table 1 shows the trends and shifts of commodity exports of Bangladesh. This table shows that in 1981–1982, 61.8% of the total exports were raw jute and jute goods, 10.1% of the total exports were leather, 6.1% of the total exports were tea and 1.1% of the total exports were woven garments. However, in 2002–2003, 5.2% of the total exports were raw jute and jute goods, 2.9% of the total exports were leather, 0.2% of the total exports were tea, 49.8% of the total exports were woven garments and 25.3% of the total exports were knitwear. Table 1: Major export by commodities (% of total export) Year
Jute Goods
Raw Jute
Leather
Tea
Frozen Foods
Chemical Products
Woven Garments
Knitwear
0.9
-
-
10.4
1.1
-
5.4
42.8
7.6
10.2
49.8
25.3
Others
197251.4 38.5 4.6 2.9 0.9 0.9 1973 198145.5 16.3 10.1 6.1 8.5 1.1 1982 199016.9 6.1 7.8 2.5 8.3 2.6 1991 20023.9 1.3 2.9 0.2 4.9 1.5 2003 Source: Export Promotion Bureau of Bangladesh (as on 16 Oct 2005).
Trade, Industry and Economic Growth in Bangladesh
73
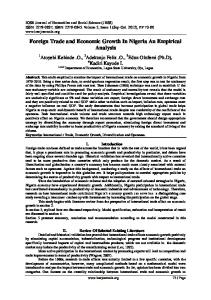
Bangladesh has been experiencing the shift from the traditional sector (agricultural sector) to the non-traditional sector (industrial and service sectors) in recent years. The contributions of industrial sector and service sector to GDP in 2005 were 28% and 51%, respectively and in 2004, those were 27% and 52%, respectively. The share of agricultural sector in GDP was 20.5% in 2005 and 21% in 2004, respectively. Although the foreign trade sector of Bangladesh constitutes an important part of its economy, the country suffers from a chronic deficit in its balance of trade. The balance of trade in Bangladesh with other countries, especially with SAARC countries, does not show any hopeful sign for the desirable contribution to country‟s economic development (Rahman, 2003). Figure 1 shows gross domestic product, export, imports, and balance of trade in millions of taka (the local currency of Bangladesh), from 1984 to 2004. The figure shows that the balance of trade has never been positive in Bangladesh.
Data Source: World Development Indicators (WDI)
74
Journal of Economic Cooperation
The trade and industrial policy of Bangladesh undertaken in 1980s have been changing from being highly import substituting and government controlled to being more liberalized and deregulated. To promote exports, several measures were undertaken in the 1980s. For example, the government has established the first export processing zone in Chittagong. It has been followed by other measures such as tax holidays, income tax rebates, and other infrastructural benefits to the exportoriented enterprises. In the 1990s, three more export processing zones were established in Dhaka, Khulna, and Iswardi. In Bangladesh, the 1990s was the milestone for starting towards democracy. 2. Uniqueness and Research Questions Cross-country evidence appears to strongly support the link between trade and growth (SPDC, 2006). For example, Sachs and Warner (1995) find that countries with a high trade orientation have an average growth rate of 2.5%, which is greater than the average growth rate in countries that are relatively closed. Similarly, Frankel and Romer (1999) state that a 1% increase in trade-to-GDP ratio is associated with a 2% increase in per capita income. However, these cross-country studies need to be qualified for several reasons. First, the direction of causation in the relationship between trade and growth is difficult to establish (Rodriguez and Rodrik, 2000). Second, in general, it is agreed that a degree of macro-economic stability is required for having a positive and sustained effect of trade liberalization on economic growth. Third, even if trade has a positive long-run effect on growth, in economies with certain characteristics the adjustment costs may be large and make the effects on growth negative in the transitional period (Winters et al, 2004). Thus, there may be a difference between the short-run and the long run effects. Therefore, one cannot rely on cross-country evidence alone to make inferences about a specific issue, for example, the effects of trade on economic growth. This kind of research must be undertaken on a case by case basis and in a country context (SPDC, 2006). Therefore, our endeavor is to measure the impact of international trade and industry value added on economic growth in Bangladesh using the time series econometric method. Trade policies (or trade liberalization policies) work only in combination with other appropriate policies. For example, investment has been identified as a key link through which openness affects growth (Taylor,
Trade, Industry and Economic Growth in Bangladesh
75
1998 and Wacziarg, 2001). Trade policies are integrated with economic growth and development strategies. Therefore, the linkages between trade policy and development-cum-industrialization strategy are crucial (Krueger, 1998). Trade policies that hurt investment could damage the benefits of trade and which, in turn, could hurt domestic economic growth and overall development. To the best of our knowledge, the prior studies have not used the variable, industry value added, as a possible source of economic growth. We use the variable, industry value added, as a possible source of economic growth in addition to export and import, which is a unique feature of this study. Therefore, the key research questions of this study are: to what extent trade and industry value added contribute to the economic growth of Bangladesh? Are there any causal and long run relationships among export, import, industry value added and gross domestic product in Bangladesh? It has been argued that openness is a better measure for economic growth than export alone. If only export is used it is implicitly assumed that import does not contribute to economic growth. Import of capital goods and energy can accelerate economic growth (Sinha and Sinha 1999, 1996; Krueger 1998, 1997). Therefore, import and export policies of a particular country have direct impact on economic growth and overall development. Lastly, this study uses the longer time series data. Data are for 1965–2004. The longer period of time series data can produce better results in predicting the impact of trade and industry value added on economic growth, and their causal and long run relationships. 3. Literature Review Empirical studies to date by and large support the hypothesis that openness of trade leads to economic growth and vice versa. However, there are some studies that show that there is no causal relationship between the growth of trade openness and the growth of GDP, for example, Narayan and Smyth (2005) and Abhayaratne (1996). A number of empirical studies on export and economic growth of Bangladesh have shown diverse findings. Islam and Ifthekharuzzaman (1996) examine the relationship between total export and economic growth. They find no significant relationship between export and growth of Bangladesh. They use time series data from 1971 to 1990. The study
76
Journal of Economic Cooperation
may be criticized on the ground that the time series data used in this study are non-stationary. In contrast, Islam (1998) conducts the Granger causality tests along with the Johansen and Juselius (1990) cointegration tests and the error correction modeling technique to examine the nature and direction of causality between the growth of export and GDP of Bangladesh. On the basis of annual data from 1969 to 1991, the study shows that growth in exports Granger causes economic growth positively and significantly but not vice versa. Since the period 1982– 1991 can be described as the transitional period towards outward orientation, the results may not reflect the true nature of the causal relationship between export and gross domestic product. Sinha and Sinha (1999) conduct time series analysis for 124 countries in order to examine the causal relationship between economic growth and growth of trade openness. They define openness for a country for year t as Ot = (imt + ext). The import (imt) and export (ext) at time t are in real terms. The estimated model for empirically testing the relationship between openness and growth is GOPt= a + b GRGDPt + errort, where GOP is the growth rate of trade openness and GRGDP is the growth rate of GDP. The unit root and cointegration tests show that the variables are either integrated of order zero I(0) or cointegrated. The Granger causality tests show that the growth in openness Granger causes the growth in GDP for 11 countries and the growth in GDP Granger causes the growth in openness for 18 countries. The results show that there is a positive and significant relationship between the growth in openness and the growth in GDP for 94 countries. However, openness of an economy also depends on tariffs and tax on international trade. Therefore, there is a scope for further research. Hossain and Karunaratne (2001) examine the export-led-growth hypothesis for Bangladesh. They also examine whether or not manufacturing export is a new engine of export-led-growth instead of total export. The results show that the first differences of the variables are stationary using the ADF and the PP tests. The bivariate Granger causality tests show that there are significant and positive bi-directional causalities between total exports and GDP, manufacturing exports and GDP, total exports and manufacturing output, and manufacturing exports and manufacturing output. However, the multivariate models confirm only unidirectional causality from manufacturing exports to GDP and from manufacturing exports to manufacturing output. Total
Trade, Industry and Economic Growth in Bangladesh
77
exports neither causes nor is caused by manufacturing output. The existence of Granger causality from total exports to GDP, and from manufacturing exports to GDP and manufacturing output in the presence of the investment variable is indicative of an improvement in efficiency. The Engle-Granger error correction method confirms causality from total exports to GDP, from manufacturing exports to GDP as well as from manufacturing exports to manufacturing output. Once again, total exports appear not to cause manufacturing output. However, the study finds that there is a long run and, a stable relationship between expansion of exports and economic growth in Bangladesh. As to the relative importance of total exports and manufacturing exports in enhancing the growth of GDP vis-à-vis the manufacturing output, the empirical results of this study do not claim that manufacturing exports has become a new engine of export–led growth. The whole range of the non-nested and the encompassing tests suggest that total exports, as opposed to manufacturing exports, is the main engine of growth in terms of GDP. As to the manufacturing output, both total exports and manufacturing exports emerge as engines of growth. This implies that manufacturing exports cannot be claimed to be the sole determinant of growth of Bangladesh. Although Hossain and Karunaratne (2001) establish the bivariate causal relationship between exports and economic growth, there is the possibility for no causal relationship between exports and economic growth since other variables in the economic system may determine the growth paths of the time series (Yaghmainan, 1994). Mamun and Nath (2005) examine the export-output relationship for Bangladesh using time series data. More specifically, they examine the time series evidence of export-led- growth in Bangladesh. The unit root test (augmented Dickey-Fuller) results show that the quarterly data on industrial production index, exports of goods and services, and exports of goods only are integrated of order one, i.e. I (1). The Engle-Granger cointegration equation results show that there is a long run equilibrium relationship between industrial production and exports. The estimated cointegrating equation also indicates that there is a significant and positive long run relationship between exports and industrial production in Bangladesh. The error correction model (ECM) and Granger causality test results show that there is no causal relationship between export growth and industrial growth. The results also show that there is a positive long run equilibrium relationship between exports and industrial
78
Journal of Economic Cooperation
production, and there is no evidence of short-run causal relationship between these two variables. They state that the long run causality seems to run from exports to industrial production. 4. Objectives As international trade consists of exports and imports, we take these two variables. The trade policies are integrally tied up with overall growth and development strategies. The productivity and output growth in agriculture, services, and manufacturing are all essential for economic growth. Therefore, the linkages between trade policy and developmentcum-industrialization strategy are crucial (Krueger, 1998). Thus, we consider industrial value added as a possible source of economic growth in our study. In this empirical study, we use export, import, and industrial value added as the independent variables and gross domestic product as the dependent variable. The objectives of this study are as follows: 1) To study the nexus among exports, imports, industrial value added and economic growth in Bangladesh. 2) To empirically analyze and provide policy recommendations regarding the growth nexus of GDP with exports, imports, and industrial value added for Bangladesh. 5. Econometric Methodology A handful of empirical studies used the econometric methodologies to examine the theoretical justification and empirical relationship between the international trade and the economic growth. Time series econometric studies to date, by and large, support the hypothesis that openness of trade leads to economic growth and vice versa (for example Sinha and Sinha, 1999; Sinha, 1999; Hossain and Karunaratne, 2001; Dutta and Ahmed, 2004; Jin, 2003; Nath and Mamun, 2004). However, there are some studies that show that there is no causal relationship between the growth of openness of trade and growth of GDP (e.g. Narayan and Smyth, 2005; Abhayaratne, 1996). We use similar econometric methodology as followed by other time series studies. Annual data for 1965–2004 are used for this study. The data are in constant local currency units for Bangladesh. Data are collected from the World Development Indicators of the World Bank and from the
79
Trade, Industry and Economic Growth in Bangladesh
International Financial Statistics of the International Monetary Fund (IMF). We take logarithms of the variables. The unit root test results show that the data are non-stationary in their levels but stationary in their first differences. Therefore, we take the first difference of the log value to estimate the regression model using the ordinary least square (OLS) method. The regression equation is estimated as: lnGDPt = α0 + α1 lnEXPt + α2 lnIMPt +α3 lnIVAt + t.
(I)
The first difference of natural log of the respective variable is denoted by (delta). The constant and the coefficients of the regression equation are α0 and α (1, 2, 3), respectively. The variables lnGDPt, lnEXPt, lnIMPt, and lnIVAt refer to the natural log of gross domestic product, natural log of export, natural log of import, and natural log of industry value added at time t (here 1965 to 2004), respectively. Finally, t is the error term. First, we provide the descriptive statistics and the correlation table among the variables (e.g. lnGDP, lnEXP, lnIMP, and lnIVA). These statistics give a better understanding of the variables considered for this study. Second, we provide the Phillips–Perron unit root test results for each of the variables in their levels and in their first differences. Trend assessment is particularly important for the unit root tests, which we performed before conducting the unit root test. For the unit root test, the null hypothesis is that the variable has a unit root. However, we reject the null hypothesis if the test critical value at 5% significance level is greater than the Phillips–Perron test statistic (t-stat) and if their corresponding probability value is less than 0.05. Third, we present the regression results. Fourth, the Johansen bivariate and multivariate cointegration tests results are analyzed. Engle and Granger (1987) point out that a linear combination of two or more non-stationary series may be stationary. Since the variables including lnGDP, lnEXP, lnIVA and lnIMP are non-stationary in their levels but stationary in their first differences, we investigate whether these non-stationary variables are cointegrated or not. The non-stationary time series are said to be cointegrated, if a stationary linear combination exists. The stationary linear combination is called the cointegrating equation and may be interpreted as a long run equilibrium relationship among variables.
80
Journal of Economic Cooperation
However, if there is no evidence of a cointegration and a long run relationship among the variables namely lnGDP, lnEXP, lnIVA and lnIMP; an error correction model (ECM) based causality tests are not appropriate. Therefore, causality tests using Granger approach within the framework of VARs with first-differenced are appropriate (Toda and Phillips, 1993). Finally, in our further investigation, pairwise and multivariate Granger causality tests are performed within the VAR framework with three lags in order to determine the causal relationship between variables. The Granger causality tests measure precedence and information content but does not by itself indicate causality in the more common use of the term. The null hypothesis for the pairwise Granger causality test is „x‟ does not Granger cause „y‟, if the p-value is not significant at the 5% level. 6. Empirical Results 6. 1. Descriptive Statistics
Table 2 shows the descriptive statistics for Bangladesh. The average growth rates of gross domestic product, export, import, and industry value added in Bangladesh are 3.2%, 6.8%, 23%, and 15.6%, respectively. Table 2: Descriptive statistics for Bangladesh
lnGDP
lnEXP
lnIMP
lnIVA
Mean
0.032958
0.068327
0.229725
0.156553
Std. Dev.
0.041517
0.165661
0.016376
0.041552
Figure 2 shows the growth rates of gross domestic product, export, import, and industry value added for Bangladesh. We see that growth rates of gross domestic product, industry value added, export and import were volatile between 1965 and 1980. However, since 1980 the growth rates of gross domestic product, industry value added, export and import in Bangladesh were less volatile than the period between 1965 and 1980.
81
Trade, Industry and Economic Growth in Bangladesh
Figure 2: Growth rates of lnGDP, lnEXP, lnIMP, and lnIVA of Bangladesh .8 .6 .4 .2 .0 -.2 -.4 -.6 -.8 1965
1970
1975
1980
1985
LOGEXG LOGGDPG
1990
1995
2000
LOGIMG LOGIVAG
The correlation matrix (Table 3) shows that the coefficients of the growth rates of industry value added and the growth rates of gross domestic product, and the growth rates of industry value added and the growth rates of export have a strong and positive correlation. This means that the increase in lnIVA would result in an increase in lnGDP and lnEXP, respectively and vice versa. The negative coefficient implies that an increase in lnIMP would result in a decrease in lnEXP and lnIVA, respectively and vice versa. Table 3: Correlation matrix for Bangladesh
Variables
lnEXP
lnGDP
lnIMP
lnIVA
lnEXP
1
0.339
-0.059
0.600
lnGDP
0.339
1
0.081
0.788
lnIMP
-0.059
0.081
1
-0.311
lnIVA
0.600
0.788
-0.311
1
82
Journal of Economic Cooperation
6. 2. Unit Root Test Results We find that lnGDP, lnEXP, lnIMP, and lnIVA have trends in their levels. The variable lnGDP has a trend in its first difference and variables lnEXP, lnIMP, and lnIVA have no trends in their first differences. The Phillips-Perron unit root test results (Table 4) shows that the critical values at the 5% significance level are smaller than the Phillips-Perron test statistics. The p–values of the corresponding variables are greater than 0.05 at the 5% level of significance. Therefore, these variables are non-stationary in their levels. Table 4: Unit Root Test in Levels for Bangladesh
Variables lnGDP lnEXP lnIMP lnIVA
Phillips-Perron test statistic (t-stat.) -1.219938 -2.436661 -1.570112 -2.934906
Test Critical Value at 5% -3.529758 -3.529758 -3.529758 -3.529758
Probability 0.8923 0.3561 0.7866 0.1632
Test Equation: Trend and Intercept Table 5: Unit Root Test in First Difference for Bangladesh
Variables lnGDP lnEXP lnIMP lnIVA
Phillips-Perron test statistic (t-stat.) -6.956815 -8.981766 -6.187644 -7.258375
Test Critical Value at 5% -3.533083 -2.941145 -2.941145 -2.941145
Probability 0.0000 0.0000 0.0000 0.0000
Test Equation–trend and intercept. The variable lnGDP has a trend in its first difference.
However, Table 5 shows that the variables ΔlnGDP, ΔlnEXP, ΔlnIMP, and ΔlnIVA are stationary. This is because the critical values at the 5% level of significance are greater than the Phillips-Perron test statistics (tstatistics) and their corresponding probability values are less than 0.05.
83
Trade, Industry and Economic Growth in Bangladesh
6. 3. The Regression Results The regression results of the estimated model, lnGDPt = α0 + α1 lnEXPt + α2 lnIMPt + α3 lnIVAt + t, for Bangladesh are shown in Table 6. Table 6: Regression Results for Bangladesh
Variable C Δ lnEXP Δ lnIMP Δ lnIVA R-squared (R2) Adjusted R-squared ( R 2) S.E. of regression
Coefficient 0.024742 -0.072614 0.072795 0.288431 0.792014
t-Statistic 7.186829 -2.963643 4.895259 10.59107 F-statistic
Probability 0.0000 0.0054 0.0000 0.0000 44.42698
0.774187
Prob. (F-statistic)
0.000000
0.019729
Durbin-Watson stat
2.376078
The coefficient for ΔlnEXP is –0.072614, implying that if there is a 1% increase in the growth rate of export, growth rate of GDP would face a decrease by 0.07%. The associated probability for ΔlnEXP is 0.0054, which is significant at the 5% level. Likewise, growth rate of GDP would increase by 0.07% and 0.29%, respectively if there is a 1% increase in the growth rates import and industry value added, respectively. The p-values for Δ lnIMP and Δ lnIVA are significant at the 5% level. The p-values for all the variables are statistically significant for rejecting the null hypothesis that the true coefficient is zero at the 5% significance level. Therefore, the growth rate of industry value added can contribute more than the growth rate of export and import to increasing the growth rate of GDP for Bangladesh. It is imperative to state that import of capital goods and technology, and efficient use of them can accelerate industrial production and value addition, which in turn, contribute to export earning and domestic economic growth. We use the Breusch-Godfrey LM test for testing the serial correlation among variables. The results of Table 7 show that the Observation*Rsquared statistic is greater than F-statistic and the chi-square value is greater than 0.05, therefore, we accept the null hypothesis that there is no serial correlation up to the first lag order.
84
Journal of Economic Cooperation
Table 7: Breusch-Godfrey Serial Correlation LM Test for Bangladesh
F-statistic
Obs*R-squared
Prob. F(2,33)
Prob. Chi-Square(2)
2.992543
5.987375
0.063923
0.050102
6. 4. Johansen Bivariate and Multivariate Cointegration Tests Results The unit root test results show that lnGDP, lnEXP, lnIMP, and lnIVA are non-stationary in their levels but stationary in their first differences for Bangladesh. Therefore, we conduct both bivariate and multivariate Johansen cointegration tests for these variables. The purpose of the cointegration test is to determine whether a group of non-stationary variables is cointegrated or not. Table 8 shows the results of trace and maximum eigenvalues of the bivariate cointegration tests for Bangladesh. Table 8: Johansen Bivariate Cointegration Tests for Bangladesh
Variable
lnGDP and lnIMP lnGDP and lnEXP lnGDP and lnIVA
Cointegration Rank Test (Trace) Trace Critical Prob. Statistic Value at 5%
Cointegration Rank Test (Maximum Eigenvalue) Max-Eigen Critical Prob. Statistic Value at 5%
10.57630
15.49471
0.2390
10.32118
14.26460
0.1917
13.04375
15.49471
0.1132
9.540789
14.26460
0.2439
42.62053
15.49471
0.0000
36.90257
14.26460
0.0000
The trace test indicates that there is no cointegration between lnGDP and lnIMP, and between lnGDP and lnEXP at the 5% significance level. We find that there is cointegration between lnGDP and lnIVA at the 5% significance level. The maximum eigenvalue test shows that the critical values are higher than the test statistics for lnGDP and lnIMP, lnGDP and lnEXP. Therefore, there is no long run relationship between lnGDP and lnIMP, and lnGDP and lnEXP. The results also indicate that the variables lnGDP and lnIVA have a long run relationship in Bangladesh. The maximum eigenvalue test also shows that there is no cointegration
Trade, Industry and Economic Growth in Bangladesh
85
for lnGDP and lnEXP, and lnGDP and lnIMP in Bangladesh. The pvalues in both trace test and maximum eigenvalue test for lnGDP and lnIVA are significant at the 5% level. The Johansen multivariate cointegration test results are shown in Table 9. The trace test and the maximum eigenvalue test indicate that there is no cointegration. This is because the critical values at 5% level are smaller than the trace statistic and the maximum eigenvalue statistic, respectively for the first hypothesized cointegrating equation (CE). Table 9: Johansen Multivariate Cointegration Tests for Bangladesh Hypothesize d No. of CE(s)
None At most 1 At most 2 At most 3
Unrestricted Cointegration Rank Test (Trace) Trace Statistic 90.1664 4 28.1289 5 12.7648 1 1.87415 8
Critical Value at 5%
Prob.
47.85613
0.0000
29.79707
0.0769
15.49471
0.1237
3.841466
0.1710
Unrestricted Cointegration Rank Test (Maximum Eigenvalue) MaxCritical Eigen Prob. Value at 5% Statistic 62.0374 0.000 9 27.58434 0 15.3641 0.264 5 21.13162 2 10.8906 0.159 5 14.26460 8 1.87415 0.171 8 3.841466 0
6. 5. Granger Causality Test Results The pairwise Granger causality test results for Bangladesh (Appendix A) show that ΔlnEXP Granger causes ΔlnGDP and ΔlnIMP, respectively and that the p-values are significant at the 5% level. The results also show that ΔlnIVA Granger causes ΔlnEXP and ΔlnIMP, respectively, and ΔlnGDP Granger causes Δ lnIMP at the 5% significance level. These causal relationships are unidirectional. The multivariate Granger causality test for the variables (Appendix B) show that the variable, ΔlnGDP is Granger caused by the variables ΔlnIMP and ΔlnIVA, and that the variable ΔlnEXP is significant at the 5% level. The results also show that ΔlnGDP is Granger caused by ΔlnIMP, ΔlnEXP, ΔlnIVA as the p-value is significant at the 5% level. Similarly, ΔlnIMP and ΔlnIVA are Granger caused by ΔlnGDP and ΔlnIVA, and ΔlnGDP and ΔlnIMP,
86
Journal of Economic Cooperation
respectively as ΔlnEXP is significant at the 5% level and when ΔlnIMP and ΔlnIVA are dependent variables, respectively. The results also show that ΔlnIMP is Granger caused by ΔlnGDP, ΔlnEXP and ΔlnIVA, and that the p-value is significant when all the variables are considered. The variable ΔlnIVA is Granger caused by ΔlnGDP, ΔlnEXP and ΔlnIMP, and that the p-value is significant at the 5% level. Thus, the results show that export orientation and industrialization (industrial value added) would accelerate the demand for imports of capital goods and technology, which in turn, will increase the economic growth of Bangladesh. 7. Policy Recommendations and Conclusion Our regression results support the findings of Islam and Ifthekharuzzaman (1996), which states that there is no significant relationship between the growth rate of export and the growth rate of gross domestic product of Bangladesh. Our pairwise Granger causality test results also support the findings of Islam (1998). Islam finds that the growth of total export Granger causes growth of GDP positively and significantly but not vice versa. Although Mamun and Nath (2005) find no causal relationship between export growth and industrial growth, our estimation results show that growth rate of export is Granger caused by the growth rate of industry value added but not vice versa. Therefore, the policy implications are simple from these results. The results clearly show that only import and/or export cannot contribute to the economic growth unless industrial sector is taken into account. The results also show that GDP will grow if the import demand is derived from the export and industrial sectors. Therefore, diversification of exports, export promotion, careful import liberalization strategies, foreign and domestic investment, favorable infrastructure and industrialization policies can lead to rapid economic growth in Bangladesh. Trade policies should focus on import liberalization. Tax, tariff and non-tariff barriers among the trading countries, especially in the South Asian region should be reduced. Bangladesh suffers from a huge trade deficit with the neighboring country, India. The low level of intra-regional trade in South Asia partly reflects the similarity of the comparative advantage pattern within the region. It also
Trade, Industry and Economic Growth in Bangladesh
87
reflects the structural rigidities created by political constraints. The competitive nature of the SAARC economies suggests that mere removal of trade barriers is not likely to have a significant impact on intra-regional trade (Hassan, 2000; Ahmed and Sultan, 2004). Therefore, it is imperative that the bilateral and the multilateral trade and investment negotiations among the South Asian countries should be strengthened and it must focus on industrial, agricultural, and service sectors in order to improve the balance of trade and socio-economic development in this region (Ahmed and Sultan, 2004). Strengthening SAARC and SAPTA could be one of the main strategies for regional growth and development in the South Asian Nations. Imports of industrial goods and technologies can increase productivity and can contribute to the growth of industry and economy. Export policies and export incentives in Bangladesh should be such that these can accelerate economic growth. There are some comparative advantages in these South Asian countries. Moreover, they share common geographic and climatic conditions, culture and religion. Therefore, these advantages should be explored, shared and utilized for their mutual benefits and growth.
88
Journal of Economic Cooperation
References Abhayaratne, Anoma S. P. (1996), “Foreign trade and economic growth evidence from Sri Lanka, 1960–1992,” Applied Economics Letters, Vol. 3, pp. 567–570. Ahmed, S. and Sultan, M.P. (2004), “Hindrances of export promotion with India: the Bangladesh perspective,” Journal of Business Studies, Vol. 2, pp. 93–107. Dutta, D. and Ahmed, N. (2004), “Trade liberalization and industrial growth in Pakistan: a cointegration analysis,” Applied Economics, Vol. 36, pp. 1421–1429. Engle, R.F. and Granger, C.W.J. (1987), “Cointegration and error correction representation: estimation and testing,” Econometrica, Vol. 55, pp. 251–276. Frankel, J.A., and Romer, D., (1999), “Does trade cause growth,” American Economic Review, Vol. 89, pp. 379–399. Hassan, M.K. (2000), “Trade relations with SAARC countries and trade policies of Bangladesh,” Journal of Economic Cooperation, Vol. 21, pp. 99–152. Hossain, M.A. and Karunaratne, N.D. (2001), “On export-led growth: is manufacturing exports a new engine of growth for Bangladesh,” Discussion Paper No. 297, The University of Queensland Brisbane (December). Hultman, C.W. (1967), “Exports and economic growth: a survey,” Land Economics, Vol. 43, pp. 148–157. Islam, M.N. (1998), “Export expansion and economic growth: testing for cointegration and causality,” Applied Economics, Vol. 30, 415– 425. Islam, M.N. and Iftekharuzzaman, M. (1996), “Export-Growth nexus in a small open economy: the case of Bangladesh,” in Weis, C.E. and A. Wahid (eds.), The economy of Bangladesh: problems and prospects, Wesport, CT: Praeger Publishing.
Trade, Industry and Economic Growth in Bangladesh
89
Jin, Janc C. (2003), “Openness and growth in North Korea: evidence from time-series data,” Review of International Economics, Vol. 11, pp. 18–27. Johansen, S. and Juselius, K. (1990), “Maximum likelihood estimation and inference on cointegration with applications to the demand for money,” Oxford Bulletin of Economics and Statistics, Vol. 52, pp. 169–210. Krueger, A. (1997), “Trade policy and economic development: how we learn,” American Economic Review, Vol. 87, pp. 1–22. Krueger, A. (1998), “Why trade liberalization is good for growth,” Economic Journal, Vol. 108, pp. 1513–1522. Mamun, K.A.A. and Nath, H.K. (2005), “Export-led growth in Bangladesh: a time series analysis”, Applied Economics Letters, Vol. 12, 361–364. Narayan, Paresh Kumar and Smyth, R. (2005), “Trade liberalization and economic growth in Fiji: an empirical assessment using the ARDL approach,” Journal of the Asia Pacific Economy, Vol. 10, pp. 96– 115. Nath, H.K. and Mamun, K.A.A. (2004), “Trade liberalization, growth and inequality in Bangladesh: an empirical analysis,” paper presented at the 41st Annual Conference of the Missouri Valley Economic Association held in Nashville, TN. Rahman M. M. (2003), “A panel data analysis for Bangladesh‟s trade: the gravity model approach”. Retrieved from: (on 25 Dec. 2005). Rodríguez, F. and Rodrik, D. (2000), “Trade policy and economic growth: a skeptic‟s guide to the cross-national evidence,” in NBER Macroeconomics Annual 2000, ed. By Ben S. Bernanke and Kenneth Rogoff, Cambridge: The MIT Press. Sachs, J. D. and Warner, A. (1995), “Economic reform and the process of global integration,” Brookings Papers on Economic Activity, Vol. 1, pp. 1–118.
90
Journal of Economic Cooperation
Sinha, D. (1999). “The long run relationship between export and import of Pakistan,” Indian Economic Journal, Vol. 46, pp. 104–109. Sinha, D. and Sinha, T. (1996), “Openness and economic growth in India,” Indian Journal of Economics, Vol. 77, pp. 115–125. Sinha, T. and Sinha, D. (1999), “The relation between openness and economic growth: postwar evidence from 124 countries,” Seoul Journal of Economics, Vol. 12, pp. 67–83. Social Policy and Development Center (2006), “Trade liberalization, growth and poverty”, Annual Review of the Social Policy and Development Center (SPDC), Karachi, Pakistan. Taylor, A. M. (1998), “On the cost of inward-looking development: price distortions, growth and divergence in Latin America,” Journal of Economic History, Vol. 58, pp. 1–28. Toda, H. and Phillips, P.C.B. (1993), “Vector auto-regressions and causality,” Econometrica, Vo. 61, pp. 1367–1393. Wacziarg, R. (2001), “Measuring the dynamic gains from trade,” The World Bank Economic Review, Vol. 15, pp. 393–429. Winters, A., McCulloch, N. and McKay, A. (2004), “Trade liberalization and poverty: the evidence so far,” Journal of Economic Literature, Vol. 62, pp. 72–115. Yaghmaian, B. (1994), “An empirical investigation of exports, development and growth in developing countries: challenging the neo-classical theory of export-led growth,” World Development, Vol. 22, pp. 1–22.
Trade, Industry and Economic Growth in Bangladesh
91
Appendix A Pairwise Granger Causality Tests for 1965–2004 Null Hypothesis:
Obs
F-Statistic
Probability
LOGGDPG does not Granger Cause LOGEXG LOGEXG does not Granger Cause LOGGDPG
36
1.05671 4.26640
0.38258 0.01300
LOGIMG does not Granger Cause LOGEXG LOGEXG does not Granger Cause LOGIMG
36
1.72205 9.99529
0.18437 0.00011
LOGIVAG does not Granger Cause LOGEXG LOGEXG does not Granger Cause LOGIVAG
36
3.15181 2.38917
0.03985 0.08919
LOGIMG does not Granger Cause LOGGDPG LOGGDPG does not Granger Cause LOGIMG
36
0.00704 13.2151
0.99917 1.3E-05
LOGIVAG does not Granger Cause LOGGDPG LOGGDPG does not Granger Cause LOGIVAG
36
1.79376 1.26491
0.17041 0.30476
LOGIVAG does not Granger Cause LOGIMG LOGIMG does not Granger Cause LOGIVAG
36
12.6297 1.85687
1.9E-05 0.15902
92
Journal of Economic Cooperation
Appendix B VAR Granger Causality for 1965–2004 Dependent variable: LOGEXG Excluded
Chi-sq
df
Prob.
LOGGDPG LOGIMG LOGIVAG
0.596281 1.403237 3.735885
3 3 3
0.8973 0.7048 0.2914
All
11.39270
9
0.2497
Excluded
Chi-sq
df
Prob.
LOGEXG LOGIMG LOGIVAG
10.06468 1.706529 3.512799
3 3 3
0.0180 0.6355 0.3191
All
19.36422
9
0.0223
Excluded
Chi-sq
df
Prob.
LOGEXG LOGGDPG LOGIVAG
7.923590 5.937682 4.110717
3 3 3
0.0476 0.1147 0.2498
All
68.31836
9
0.0000
Excluded
Chi-sq
df
Prob.
LOGEXG LOGGDPG LOGIMG
9.733347 2.912836 2.660343
3 3 3
0.0210 0.4053 0.4470
All
17.17353
9
0.0461
Dependent variable: LOGGDPG
Dependent variable: LOGIMG
Dependent variable: LOGIVAG