README file for Matlab Tide Model Driver
L. Padman (ESR) & S. Erofeeva (OSU)
Tide Model Driver (TMD) Manual Laurie Padman Earth & Space Research
[email protected]
Version 1.2: November 28, 2005
1
README file for Matlab Tide Model Driver
L. Padman (ESR) & S. Erofeeva (OSU)
README File for Tide Model Driver (TMD) Modified: November 28, 2005 (LP) Report problems to
[email protected]. TMD is a Matlab package for accessing the harmonic constituents for the ESR/OSU family of high-latitude tide models, and for making predictions of tide height and currents. TMD includes two components: (1) a graphical user interface (GUI) for quickly browsing tide fields, zooming in on regions of interest, and selecting points and time ranges for predictions of specific variables; and (2) a set of scripts for accessing tide fields and making predictions. Each component is described below. TMD was written by Lana Erofeeva (
[email protected]). Presently available models are Model
Description
Global Model_tpxo6.2
1/4o x 1/4o, fully global assimilation model from Oregon State University (see http://www.coas.oregonstate.edu/research/po/research/tide/index.html). Standard Global model
Model_tpxo6.2_load
1/4o x 1/4o, fully global model of load tides (solid earth deflection due to ocean tide loading) from Oregon State University (see http://www.coas.oregonstate.edu/research/po/research/tide/index.html). Standard Global ocean tide loading model, particularly useful for calculating geocentric tides (e.g., elevation variability seen by satellite altimeters)
Antarctic Model_CATS02.01
¼o x 1/12o (~10 km), circum-Antarctic to 58oS, forward model with TPXO5.1 height boundary conditions at N. boundary. Standard Antarctic model
Model_CADA10
¼o x 1/12o (~10 km) circum-Antarctic to 58oS, assimilation model with TPXO5.1 height boundary conditions at N. boundary, assimilation of TOPEX/Poseidon satellite radar altimetry and coastal and benthic tide gauges. Generally not as good as CATS02.01 because it uses out-of-date bathymetry/coast files.
Model_AntPen
1/30o x 1/60o (~2 km) Antarctic Peninsula model, 76oS-58oS, 240oE-330oE, forward model with CATS02.01 height boundary conditions at W, N, E boundaries. Warning -- very large model: may not run on all PCs
Model_Ross_Prior
1/8o x 1/24o (~5 km) Ross Sea model, 86oS-63oS, 159oE-215oE, forward model with CATS02.01 height boundary conditions at W, N, E boundaries. Linear drag. Used mainly as Prior for VMADCP assimilation models, and boundary conditions ROMS 3-D modeling
Model_Ross_VMADCP_9cm
1/8o x 1/24o (~5 km) Ross Sea model, 86oS-63oS, 159oE-215oE, assimilation model
2
README file for Matlab Tide Model Driver
L. Padman (ESR) & S. Erofeeva (OSU)
with TPXO5.1 height boundary conditions at N. boundary, assimilation of 3 cruises of vessel ADCP data (including AnSlope Cruise 1), 9 cm/s assumed noise on velocity data. Excellent model for velocities in western and northern Ross Sea, especially along the tidally energetic shelf break. Model_Ross_Inv_2002
1/4o x 1/12o (~10 km) Ross Sea inverse model, 86oS-63oS, 150oE-220oE, assimilation model with TPXO5.1 height boundary conditions at N. boundary, assimilation of tide gauge data, primarily gravimeter records from the Ross Ice Shelf. Excellent model for heights for the Ross Ice Shelf
Arctic Model_Arc5kmT
5 km Arctic assimilation model, assimilating ~300 coastal tide gauges, plus ERS and TOPEX/Poseidon satellite radar altimetry. Optimum Arctic model (highest resolution with assimilation).
The TMD software can be used to run all global and regional models from Oregon State University; see http://www.coas.oregonstate.edu/research/po/research/tide/index.html and http://www.coas.oregonstate.edu/research/po/research/tide/region.html. Model Files Each “model” consists of 4 files. To simplify the discussion, we will consider Model_tpxo6.2, a global assimilation solution (see above Table). The file, Model_tpxo6.2, is an ASCII file containing the following 3 lines: h_tpxo6.2 u_tpxo6.2 grid_tpxo6.2
These lines refer to the binary (OTIS format) files containing complex harmonic coefficient grids for height (h_tpxo6.2) and velocity (u_tpxo6.2), and the bathymetry grid file grid_tpxo6.2. If you download model grid file sets from Oregon State University, you will need to create your own ‘Model_*’ file similar to the Model_tpxo6.2 file shown above. This process allows the user to use a single file name to call all components (grid, h and u) of each model, and also to allow common grids to be used. E.g., several models might use the same grid_* file, or a user might wish to create a model that uses height fields from one model run combined with velocity fields from a different model run (provided the two models use the same bathymetry grid).
1. TMD GUI The GUI is accessed in the following manner: 1. Open the Matlab dialog box; 2. Change directory to the location where the GUI code resides; 3. Run “tmd”.
3
README file for Matlab Tide Model Driver
L. Padman (ESR) & S. Erofeeva (OSU)
The following is the output shown in the dialog box: >> tmd Welcome to TMD: Tidal Model Driver! TMD FILE NAME/FORMAT CONVENTION (MUST follow!): 1. Model and grid files should be in OTIS binary format, see http://www.oce.orst.edu/po/research/tide/inv_doc.html 2. Elevation file name should start from 'h'. 3. Transport file name should start from 'UV'. 4. Bathymetry grid file name should start from 'g'. 5. If grid is uniform in km string 'km' should be found either in model file names or in grid file name. 5. Default model files location is subdir DATA. For each model a control file 'DATA/Model_*' should be given. The file MUST contain 3 lines: If grid is uniform in km the NAME of function converting lat,lon to x,y and back should be given in 4-th line, for example: 'xy_ll' for Arctic or 'xy_ll_S' for Antarctic
4. You will be asked to select a model from a drop-down menu. If there is a ../DATA subdirectory in your current workspace, TMD will look there for TMD-compatible tide models. If you are anywhere else, TMD will display the following message: Subdirectory DATA not found. You must navigate to location of Model files from current directory.
This is straightforward, just like browsing with Windows Explorer. You now get the following dialog from the Matlab command window, and a GUI (see next page) appears with bathymetry displayed for the chosen model. The model is on uniform grid in lat,lon Loading TMD (Tidal Model Driver)...done See button tips for HELP. Type 'help extract_HC','help tide_pred', 'help ellipse', Type 'help get_coeff','help get_ellipse', if you wish to use the scripts instead of GUI. Model and files are in D:\Tide_models\TMD\DATA\AntPen\h.Larsen and D:\Tide_models\TMD\DATA\AntPen\UV.Larsen. Bathymetry grid file is in D:\Tide_models\TMD\DATA\AntPen\grid_Larsen. Input file examples are in: lat_lon, lat_lon_1, lat_lon_2 Programmed by: Lana Erofeeva, 2003 >>
5. You can now resize the graphics window so that everything in the screen is clear. Window resizing is monitored, so that for future use of TMD for the same model, window dimensions will be the same as the resized window.
4
README file for Matlab Tide Model Driver
L. Padman (ESR) & S. Erofeeva (OSU)
6. Hovering the cursor over specific buttons will give you help for that choice. Note that in the “constituent selection” panel (upper right), you can select multiple constituents. To clear-all/select-all, right-click on the blue-gray frame. If you have multiple constituents selected, the plotted constituent is outlined in green. Right-click on the constituent you wish to view. The green frame will highlight the new selection. 7. To select a point, click the “point” button, then use the cross-hairs to choose the point. Or, enter the point coordinates manually. The selected point will be marked on the plot. 8. To select variables, choose from u (E velocity component), v (N velocity component), U or V (transports: Hu and Hv), z (sea surface height (relative to the seabed)), or Ell (current ellipse properties). 9. If “Extract tidal constants” is selected, the tidal harmonic coefficients for the selected variable and selected constituents will be written to a file. You may either “Append” or “Rewrite” the file. The default file name for ASCII data is ‘data.out’, although you can change this. A Matlab file is also written with the same prefix name but with ‘mat’ suffix. 10. If “Predict tide” is selected, a tidal prediction of the requested variable (u, v, z, U or V, but not ‘Ell’) for the specified point will be made, and the output saved in the specified data file. Also, a new graphics window will be opened, showing the plot of the predicted variable. The starting time, and length of predicted record, are specified in the lower left above the “Restart” and “Go” buttons. If anything in the TMD GUI is unclear from either this README or the information for specific buttons, please let us know! Email suggestions or comments to Laurie Padman (
[email protected]).
5
README file for Matlab Tide Model Driver
L. Padman (ESR) & S. Erofeeva (OSU)
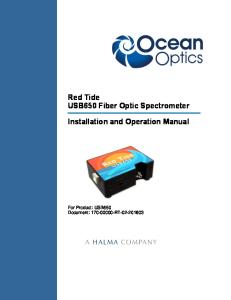
Example TMD GUI display
This screen snapshot shows the TMD GUI for the “Larsen Ice Shelf” submodel (see “mk_submodel.m” documentation, below) from the “AntPen” high-resolution Peninsula-area tide model. All semidiurnal constituents (M2, S2, N2, K2) have been selected. M2 is displayed (constituent name outlined by green box). M2 amplitude is selected for display (see “Plot amplitude” selection (lower left)). Lower right options include ‘u’ (E/W) velocity, ‘v’ (N/S) velocity, U and V (depth-integrated transports; =hu, hv), ‘z’ surface height, and ‘Ell’ ellipse properties (major/minor axis, ellipse orientation, ellipse phase). You can zoom on a subgrid by selecting ‘subgrid’ (central bottom) or select a specific point using ‘Point’. Prediction for a specific point is for the displayed variable, using all selected constituents (not just the one shown highlighted with the green box). Predictions are output to a specified file (click on “rewrite file” dialog box) and are plotted in a new figure window. 2. TMD Scripts The TMD package includes Matlab functions that can be used to access the model directly, for example where the user wishes to run several predictions in batch mode. As with the GUI, please let us know if the explanations of usage are not clear, or another script would be useful (email Laurie Padman at
[email protected]). To the experienced user, the scripts are probably much more useful than the GUI. 6
README file for Matlab Tide Model Driver
L. Padman (ESR) & S. Erofeeva (OSU)
Hint: Add the location of each model you want to the Matlab default path (use the ‘File’ ‘Set Path’ option on the command bar). This allows you just to specify the model name rather than the whole path in the calls to the script functions. I add the model directory to the end of the current ‘pathdef’. However, it doesn’t matter since you are unlikely to have similarly named files on your system. The available functions are as follows. Courier script refers to print out of “help *.m” commands.
TMD_exerciser.m This script runs through a few of the TMD scripts, demonstrating model calls and basic plotting. >> help tmd_exerciser ======================================================================== tmd_exerciser.m This file runs through a few uses of script access to TMD-formatted tide models, just to see if they work, and to show the use of various scripts. Inputs:
none
Sample call:
tmd_exerciser;
Written by:
Laurie Padman (ESR):
[email protected] September 30, 2004
========================================================================
The main use of tmd_exerciser.m is to demonstrate how you would call the main TMD scripts for other operations, including retrieving the bathymetry and making tide predictions. Print it out and use it as a guide to how to use the TMD scripts. You run the script by typing ‘tmd_exerciser’ at the Matlab command window prompt. You will be given a “file manager” window that lets you find the name of the model (‘Model_*’) that you want to exercise. The program will display model bathymetry (water column thickness under ice shelves) and ask you to select a test point with the mouse cursor. The program will then generate a series of plots and some model output for the specified test point.
Get_bathy.m This function retrieves lat, lon and water depth (water column thickness under ice shelves) for the specified model. >> help get_bathy ======================================================================== get_bathy.m
7
README file for Matlab Tide Model Driver
L. Padman (ESR) & S. Erofeeva (OSU)
Gets map of bathymetry (water column thickness under ice shelves) for specified model. Written by:
Laurie Padman (ESR):
[email protected] August 18, 2004
Sample call: [latg,long,H]=get_bathy('Model_ISPOL'); ========================================================================
Extract_hc.m This function is designed to extract the tidal harmonic constants for a specified location. Usage is explained below: >> help extract_hc Function to extract tidal harmonic constants out of a tidal model for given locations USAGE [amp,Gph,Depth,conList]=extract_HC(Model,lat,lon,type); PARAMETERS Input: Model - control file name for a tidal model, consisting of lines 4th line is given only for models on cartesian grid (in km) All model files should be provided in OTIS format lat(L),lon(L) - coordinates in degrees; type - char*1 - one of 'z' - elvation (m) 'u','v' - velocities (cm/s) 'U','V' - transports (m^2/s); Ouput:
amp(nc,L) - amplitude Gph(nc,L) - Greenvich phase (o) Depth(L) - model depth at lat,lon conList(nc,4) - constituent list
Sample call: [amp,Gph,Depth,conList]=extract_HC('DATA/Model_Ross_prior',lat,lon,'z'); Dependencies:
h_in,u_in,grd_in,XY,rd_con,BLinterp,checkTypeName
Tide_pred.m Tide-pred.m makes predictions of a specified tidal variable (height, u, or v) at a specified location. The user can also specify which tidal harmonics to include. Predictions are made with nodal corrections included. >> help tide_pred %%% Predict tidal time series in a given locations at given times
8
README file for Matlab Tide Model Driver
L. Padman (ESR) & S. Erofeeva (OSU)
%%% using tidal model from a file USAGE: [TS,ConList]=tide_pred(Model,SDtime,lat,lon,type,Cid); PARAMETERS Input: Model - control file name for a tidal model, consisting of lines 4th line is given only for models on cartesian grid (in km) All model files should be provided in OTIS format SDtime(N) - vector of times expressed in serial days see 'help datenum' in matlab lat,lon - coordinates of ONE point in degrees; OR lat(N),lon(N) - coordinates of N points along the track, in this case SDtime(N) interpreted as times of measuremnts at lat(N) lon(N); type - char*1 - one of 'z' - elvation (m) 'u','v' - velocities (cm/s) 'U','V' - transports (m^2/s); Cid - indices of consituents to include (> help ellipse Calculate tidal ellipse parameters at given locations using a model USAGE [umajor,uminor,uphase,uincl]=ellipse(Model,lat,lon,constit); PARAMETERS INPUT Model - control file name for a tidal model, consisting of lines 4th line is given only for models on cartesian grid (in km) All model files should be provided in OTIS format lat(L),lon(L) - coordinates (degrees) constit - constituent name, char length > help get_coeff function to extract amplitude and phase grids from a model ModName (OTIS format) calculated on bathymetry grid Gridname usage: [x,y,amp,phase]=get_coeff(Model,type,cons); PARAMETERS INPUT Model - control file name for a tidal model, consisting of lines 4th line is given only for models on cartesian grid (in km) All model files should be provided in OTIS format type - one of 'z','u','v' (velocities),'U','V' (transports) cons - tidal constituent given as char* output: amp - amplituide (m, m^2/s or cm/s for z, U/V, u/v type) phase - phase degrees GMT x,y - grid coordinates sample call: [x,y,amp,phase]=get_coeff('DATA/Model_Ross_prior','z','k1');
11
README file for Matlab Tide Model Driver
L. Padman (ESR) & S. Erofeeva (OSU)
Get_ellipse.m Get_ellipse.m extracts current ellipse parameters major and minor axes, ellipse orientation, and ellipse phase, for the specified harmonic. As with get_coeff.m, this is useful for for batch files to print out maps of individual harmonics (e.g., major axis) for the entire domain, or a specified limited region of interest. >> help get_ellipse function to extract tidal ellipse grids from a model usage: [x,y,umaj,umin,uphase,uincl]=get_ellipse(Model,cons); Model - control file name for a tidal model, consisting of lines 4th line is given only for models on cartesian grid (in km) All model files should be provided in OTIS format cons - tidal constituent given as char* output: umaj,umin - major and minor ellipse axis (cm/s) uphase, uincl - ellipse phase and inclination degrees GMT x,y - grid coordinates sample call: [x,y,umaj,umin,uphase,uincl]=get_ellipse('DATA/Model_Ross_prior','k1');
12
README file for Matlab Tide Model Driver
L. Padman (ESR) & S. Erofeeva (OSU)
Mk_submodel.m Mk_submodel.m creates a new model set (Model*, UV*, h*, grid*) for a specified subdomain. The primary use of this script is to make smaller models that use fewer computer resources and so run more quickly. The sample call in the helpfile, below, takes a small area of the very large AntPen model to provide a small model for a specific experiment. >> help mk_submodel function to make a submodel from a model ModName (TMD format) calculated on bathymetry grid Gridname usage: ()=mk_submodel(Name_old,Name_new,limits); PARAMETERS INPUT Name_old - root in "DATA/Model_root" control file for EXISTING tidal model. File Model_* consists of lines: 4th line is given only for models on cartesian grid (in km) All model files should be provided in TMD format Name_new - root in "DATA/Model_root" control file for SUBMODEL of tidal model. The submodel is defined by limits - [lon1,lon2,lat1,lat2] OR [x1 x2 y1 y2] for a model in km; might be slightly CHANGED to adjust to original model grid OUTPUT: in TMD/DATA Model_ - control file of 3 or 4 lines (as in old) h. - elevation file UV. - transports file grid_ - grid file sample call: mk_submodel('AntPen','AntPen1',[290,300,-70,-60]);
13