Third quarter results 2014 28 October 2014
KVÆRNER ASA – THIRD QUARTER RESULTS 2014 HIGHLIGHTS High operational activity Transocean Barents classification, upgrade and modification work completed ahead of schedule Awarded study for unmanned dry tree wellhead platform concept – Subsea on a Stick® Cooperation with KBR to bid for Johan Sverdrup topside contracts Semi-annual dividend of NOK 0.64 per share approved by the Board of Directors New strategic opportunities being explored to further strengthen Kvaerner’s business
SUBSEQUENT EVENTS Semi-annual dividend of NOK 0.64 per share paid 24 October
FINANCIAL HIGHLIGHTS Continuing operations Operating revenue
1
NOK million
EBITDA
Order backlog
NOK million
NOK million
2
30 000
4 000 4 004
3 939
300 289
25 000
3 500 3 489 3 000
250
25 647 22 809
3 080
21 507
20 000
2 861
200
2 500
19 696
19 353
194 180
2 000
180
150
15 000
170
1 500
10 000
100
1
Excluding scope of work of jointly controlled entities closely related to Kvaerner’s operating activities.
2
Including scope of work of jointly controlled entities closely related to Kvaerner’s operating activities.
© 2014 Kværner ASA
1
Q3 14
Q2 14
Q1 14
Q4 13
Q3 14
-
Q2 14
Q1 14
5 000
Q4 13
Q3 14
Q2 14
Q1 14
Q4 13
Q3 13
-
50
Q3 13
500
Q3 13
1 000
3rd quarter 2014 report
FINANCIAL KEY FIGURES Amounts in NOK million
Q3 2014 4 004 194 4.8 % 176 112 0.42 2 801 19 353 (515) 563
1
Total revenue and other income 2 EBITDA EBITDA margin EBIT Net profit - continuing operations Basic and diluted earnings per share - continuing operations 3
Order intake 3 Order backlog Net current operating assets Net interest bearing deposits and loans
Q3 2013 YTD 2013 Restated YTD 2014 Restated 3 080 10 354 9 021 180 653 456 5.9 % 6.3 % 5.1 % 165 603 411 101 330 227 0.38 1.23 0.85 1 594 9 445 16 689 25 647 19 353 25 647 (30) (515) (30) 256 563 256
1
Excluding scope of work of jointly controlled entities closely related to Kvaerner’s operating activities.
2
EBITDA definition: Earnings before Interest (net financial items), Taxes, Depreciation and Amortisation.
3
Including scope of work of jointly controlled entities closely related to Kvaerner’s operating activities.
FY 2013 12 960 636 4.9 % 573 239 0.89 18 615 22 809 (1 266) 1 069
Please refer to note 8 and 9 for details related to discontinued operations and restatement impacts in the financial statements.
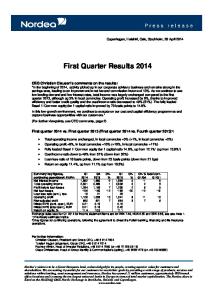
FINANCIAL REVIEW Income statement Operating revenues in third quarter 2014 amounted to NOK 4 004 million, compared with NOK 3 080 million for third quarter 2013. The increase from last year is mainly due to higher activity within Contractors Norway that more than compensates for reduced activity within the jackets business. Kvaerner reported operating revenues of NOK 10 354 million for the first nine months of 2014, compared with NOK 9 021 million for the same period in 2013. Earnings before Interest, Taxes, Depreciation and Amortisation (EBITDA) for the quarter were NOK 194 million, compared with NOK 180 million in the same period last year. EBITDA margin for third quarter 2014 was 4.8 percent, down from 5.9 percent in corresponding period in 2013. EBITDA for the first nine months of 2014 was NOK 653 million, compared with NOK 456 million for the same period in 2013. Net financial expense for the quarter was NOK 15 million, including net interest expense of NOK 9 million, foreign exchange loss of NOK 5 million and other financial expenses of NOK 1 million. Net financial expense for the same period in 2013 was NOK 13 million of which net interest expense amounted to NOK 13 million. Net financial expense for the first nine months was NOK 50 million, compared to NOK 42 million in 2013. Net result from associated companies and jointly controlled entities presented below EBITDA amounted to NOK nil million for the quarter and negative NOK 58 million for the first nine months of 2014, compared to negative NOK 3 million and negative NOK 25 million in the respective periods in 2013. The year to date 2014 result was impacted by impairment charges related to investment in associated company. Profit before tax for third quarter 2014 was NOK 161 million compared to NOK 148 million for the same period last year. For the first nine months of 2014, profit before tax was NOK 494 million compared to NOK 344 million for the same period last year. Total income tax expense in period was NOK 49 million compared to NOK 47 million for the same quarter previous year. Tax expense for the first nine months amounted to NOK 165 million, compared to NOK 117 million in 2013. The tax expense reflects an effective tax rate of 33 percent for the first nine months of 2014 compared to 34 percent for the equivalent period in 2013. The relatively high rate year to date compared to the Norwegian statutory tax rate of 27 percent is mainly due to impairment loss on investment not being tax deductible. Profit from continuing operations was NOK 112 million and NOK 330 million for third quarter and year to date 2014 respectively, compared to NOK 101 million and NOK 227 million in same periods in 2013. Basic and diluted earnings per share (EPS) for continuing operations were NOK 0.42 for third quarter, compared to NOK 0.38 for third quarter 2013. Basic and diluted EPS per share was NOK 1.23 for the first nine months of 2014 compared to NOK 0.85 the first nine months of 2013. The net loss from discontinued operations was NOK 12 million for third quarter 2014, compared to a loss of NOK 17 million in same period last year. Year to date loss from discontinued operations was NOK 72 million compared to loss of NOK 30 million in 2013. There are no operations related to the retained assets following the
© 2014 Kværner ASA
2
3rd quarter 2014 report
sale of the onshore construction business in fourth quarter 2013. Remaining activity and costs are related to legacies. Basic and diluted earnings per share for discontinued operations were negative NOK 0.05 for third quarter 2014, compared to negative NOK 0.06 for third quarter 2013, and negative NOK 0.27 for first nine months of 2014 compared to negative NOK 0.11 for first nine months of 2013. Net profit total operations in third quarter 2014 were NOK 100 million compared to NOK 84 million in the corresponding quarter last year. Basic and diluted earnings per share for total operations for third quarter 2014 were NOK 0.37 compared to NOK 0.31 in third quarter 2013. Net profit for the first nine months of 2014 was NOK 258 million compared to NOK 197 million last year. Basic and diluted earnings per share for total operations for the first nine months were NOK 0.96 and NOK 0.73 for 2014 and for 2013 respectively. Cash flow Net cash inflow from operating activities was NOK 102 million in third quarter 2014 compared to cash outflow of 1 NOK 386 million in the same period last year. Customer pre-payments were NOK 153 million at the end of third quarter compared to NOK 23 million at the end of the previous quarter. Net cash outflow from operating activities for the first nine months of 2014, was NOK 172 million, compared to cash outflow of NOK 88 million for the first nine months of 2013. Net cash outflow from investing activities in third quarter 2014 was NOK 17 million compared to an outflow of NOK 72 million in the same quarter last year. Year to date cash outflow from investing activities amounted to NOK 135 million compared to NOK 133 million in 2013. Capital expenditure in the quarter and year to date amounted to NOK 17 million and NOK 121 million respectively, and is mainly related to the facility upgrades at the Stord yard. Net cash outflow from financing activities was NOK 14 million in the quarter and NOK 195 million year to date compared with an outflow of NOK 7 million and NOK 189 million for the same periods in 2013. Year to date outflows mainly relates to dividend payments of NOK 164 million in 2014 and NOK 148 million in 2013. Net increase in cash and bank deposits during the quarter amounted to NOK 73 million, resulting in cash and bank deposits at the end of the quarter at NOK 1 045 million. The group has undrawn, committed long-term credit facilities of NOK 2.5 billion. This provides access to capital totalling NOK 3.5 billion. Balance sheet Total cash and bank was NOK 1 045 million at the end of third quarter, compared to NOK 972 million reported at the end of second quarter 2014. Net current operating assets (NCOA) were negative NOK 515 million at quarter end, compared to negative NOK 624 million at the end of previous quarter. Equity ratio at 30 September 2014 was 31.6 percent, down from 40 percent at 30 June 2014. Order intake and backlog Order intake in third quarter totalled NOK 2 801 million, including scope of work of jointly controlled entities, compared to NOK 1 594 million in the same quarter last year. As of 30 September 2014, the order backlog, including scope of work of jointly controlled entities, amounted to NOK 19 353 million. Estimated scheduling for the order backlog is approximately 20 percent for execution in 2014, approximately 40 percent for execution in 2015 and remaining 40 percent for execution in 2016 and later. Transactions in treasury shares There were no transactions in treasury shares in third quarter 2014 and Kværner ASA holds no treasury shares at the end of the quarter.
1
Invoicing in excess of cost and estimated earnings less amounts billed in advance but not received (on a project by project basis).
© 2014 Kværner ASA
3
3rd quarter 2014 report
The Kvaerner share Indexed share price development last 12 months
Kværner ASA
26.09.2014
11.09.2014
27.08.2014
12.08.2014
28.07.2014
13.07.2014
28.06.2014
13.06.2014
29.05.2014
14.05.2014
29.04.2014
14.04.2014
30.03.2014
15.03.2014
28.02.2014
13.02.2014
29.01.2014
14.01.2014
30.12.2013
15.12.2013
30.11.2013
15.11.2013
31.10.2013
16.10.2013
01.10.2013
145 140 135 130 125 120 115 110 105 100 95
Oslo Børs Benchmark Index
The share price decreased from NOK 12.60 at the end of second quarter 2014 to NOK 10.60 at the end of third quarter 2014. The highest traded share price during third quarter was NOK 13.00 and the lowest traded share price was NOK 10.00. Average daily turnover during third quarter was 415 431 shares compared to 551 694 shares during second quarter 2014. The market capitalisation was NOK 2.85 billion at the end of third quarter 2014 compared to NOK 3.39 billion at the end of second quarter 2014.
OPERATIONAL REVIEW Health, Safety, Security and Environment (HSSE) 8
6 4.0 4 1.7 2 0.2
0 2007
2008
2009
2010
Sick leave
2011 TRIF
2012
2013
2014
LTIF
Status During third quarter 2014 Kvaerner had a total of seven recordable Incidents consisting of one lost time incident and six serious or serious near miss incidents. More than 19 300 risk observations, including positive observations, were documented in the period. Initiatives Kvaerner’s third annual HSSE Summit was held at Stord in September. More than 90 participants from Kvaerner and its customers, partners, contractors and suppliers participated. This event has become an important part of the group’s HSSE work and the mutual goal of zero Incidents.
© 2014 Kværner ASA
4
3rd quarter 2014 report
Segments Following sale of Kvaerner’s onshore construction business in North America in December 2013, Kvaerner does not have any remaining operations in the US within the Downstream & Industrials segment, and remaining legacies within the segment are presented as discontinued operations in the group’s financial statements as from fourth quarter 2013. Consequently, Kvaerner only has one reportable segment; Upstream. The Upstream segment includes the business areas Contractors Norway, Jackets, Concrete Solutions and Contractors International. Please refer to note 8 and 9 for details related to discontinued operations and restatement impacts in the financial statements. Upstream segment
1
Amounts in NOK million Total revenue and other income EBITDA EBITDA margin Net current operating assets Order intake Order backlog Employees
Q3 2014 4 981 212 4.3 % (416) 2 809 19 358 2 947
Q3 2013 YTD 2014 YTD 2013 4 100 12 946 11 424 197 711 511 4.8 % 5.5 % 4.5 % (539) (416) (539) 1 603 9 472 16 738 25 657 19 358 25 657 2 759 2 947 2 759
FY 2013 16 091 708 4.4 % (1 257) 18 662 22 809 2 789
The Upstream segment reporting includes Kvaerner’s share (proportionate consolidation) of jointly controlled entities closely related to Kvaerner’s operating activities. 1
Operating revenue from the Upstream segment totalled NOK 4 981 million in third quarter 2014, compared to NOK 4 100 million in third quarter 2013. Revenue increase is mainly due to higher activity within Contractors Norway which more than compensates for reduced activity within the jackets business. EBITDA amounted to NOK 212 million, resulting in an EBITDA margin for the quarter of 4.3 percent, compared to NOK 197 million and 4.8 percent EBITDA margin in third quarter 2013. EBITDA in the quarter reflects projects with a relatively wide margin range. In second quarter Kvaerner communicated negative cost developments in some projects which have not improved in third quarter, putting pressure on margins. NCOA at the end of third quarter 2014 was negative NOK 416 million, an increase of NOK 197 million during the quarter. The disputed Nordsee Ost project will be tying up working capital until arbitration is resolved. Order intake of NOK 2 809 million in the quarter reflects growth in existing contracts as well as small orders. Order backlog was NOK 19 358 million at the end of the quarter, including scope of work of jointly controlled entities. Operations The Hebron gravity based structure (GBS) project is progressing in Newfoundland and Labrador, Canada, with engineering in St. John's and construction at the Bull Arm fabrication site. The GBS was successfully towed out to the deep water site end July. The flotilla is established and the big slip form operation started mid-September. It will be the second largest slip form operation ever to be executed, since the Gullfaks C GBS constructed in the late 1980’s. Further construction activities at the deep water site will commence in the coming month. In the Jacket business the fabrication of Nyhamna compressor modules is progressing in prefab-areas and the Johan Sverdrup team is defined. A significant part of the workforce is still employed on other Kvaerner projects. Activity level in Contractors Norway remains high, and more than 6 000 people were on rotation for the on-going projects at quarter end. The five year classification and the planned upgrade and modification work on the Transocean Barents drilling rig was successfully completed in September, more than a week ahead of schedule. The offshore campaign and hook up and commissioning work for Eldfisk is running at full speed. The Edvard Grieg topside is proceeding as planned with continued high activity within construction and assembly. For the Nyhamna project, activity will increase going forward as fabrication has started on all sites.
© 2014 Kværner ASA
5
3rd quarter 2014 report
Market The oil and gas industry experience a decline in the oil price during third quarter, but key operators demonstrate a strong commitment for progressing with several offshore platform projects. This includes the Johan Sverdrup project, which is the largest market opportunity in decades on the Norwegian continental shelf Kvaerner expects the competition to stay intense and is currently implementing improvements to strengthen its competitiveness. FEEDs and studies under execution are expected to continue into the next phases late 2014 and beyond. There are opportunities for completion and hook-up projects and within concrete substructures, Kvaerner is currently performing studies. Downstream & Industrials segment In December 2013 Kvaerner sold its onshore construction business in North America to Matrix Service Company. Following the sale, Kvaerner retained the assets and liabilities related to the contract with Longview Power LLC, including any financial effects of the arbitration. Please refer to note 9 for details related to discontinued operations and note 6 for more information on the Longview project. Unallocated costs Unallocated costs, which are net corporate costs not directly attributable to the individual segments, amounted to NOK 18 million in third quarter, down from NOK 22 million in second quarter. It is expected that the recurring level of net corporate costs will be approximately NOK 70-80 million annually. OTHER Kvaerner explores new strategic opportunities to further strengthen its business In September, it was announced that the Kvaerner is exploring opportunities to ensure the company’s long term growth and global competitiveness. Further improvement initiatives, new industrial partnerships or changes to ownership structures, as well as a further streamlining of products and services offered will be considered. It is fundamental to safeguard and continue to develop the strong expertise which has been established over decades in several of Kvaerner's businesses, for example at the specialised facilities at Stord and in Verdal. Focus will be on increasing shareholder value and on industrial opportunities which will enable further growth of the company. Cooperation with KBR to bid for Johan Sverdrup topside contracts Kvaerner and KBR, Inc will establish a joint venture to competitively bid on offshore platform topsides contracts for the Johan Sverdrup field development offshore Norway. The alliance combines Kvaerner's expertise and resources as a turn-key contractor for offshore platforms with KBR's competence as a leading international offshore oil and gas contractor. The Johan Sverdrup field is one of Norway's largest offshore oil and gas fields, and it is expected that the first development phase will include four offshore platforms for a new field centre. Study awarded for unmanned dry tree wellhead platform - Subsea on a Stick® In August 2014, Statoil awarded Kvaerner a concept study related to a standardised, unmanned dry tree wellhead platform for the Oseberg Future Development project. The concept is focused on minimisation of facilities, equipment and costs down to water depths of 150 meters and may be a cost effective solution compared to a conventional subsea tie-back solution. The project will be completed in November 2014, with expected concept selection by year end. SUBSEQUENT EVENTS Semi-annual dividend of NOK 0.64 per share paid 24 October 2014 In July 2014, the Board of Directors resolved to approve a semi-annual dividend of NOK 0.64 per share. This was line with the company’s dividend policy and pursuant to the power of attorney to approve distribution of dividend granted to the Board by the Annual General Meeting on 10 April 2014. The dividend was paid on 24 October 2014 to shareholders of record as per 13 October.
© 2014 Kværner ASA
6
3rd quarter 2014 report
PRINCIPAL RISKS AND UNCERTAINTIES Operational risk is the ability to deliver existing contracts at the agreed time, quality, functionality and cost. Delivering projects and equipment in accordance with the contract terms and the anticipated cost framework represents a substantial risk element, and is the most significant factor affecting Kvaerner’s financial performance. Results also depend on costs, both Kvaerner’s own and those charged by suppliers, and on interest expenses, exchange rates and customers’ ability to pay. For an overview of major current legal disputes, please see note 6 to the interim accounts. Kvaerner has established guidelines and systems to manage its exposure in the financial markets. These systems cover currency, interest rate, counterparty and liquidity risks. Kvaerner works systematically with risk management in all its business areas, and has extensive systems and procedures in place. Other relevant risk factors are further described in the annual report for 2013. OUTLOOK Kvaerner’s order backlog of NOK 19.4 billion still provides for a good basic workload over the next few years. The company's first priority is to execute and safely deliver existing projects according to the customers’ expectations. The oil price has been declining over the last quarter but key analysts expect that demand for oil and gas will remain at a high level for decades to come. Kvaerner see several upcoming prospects well fit for the company’s capabilities. The sanctioning of many of these projects are sensitive if the oil price remains at a low level for a prolonged period. The on-going improvement projects continue with full speed within topside construction and project management. The target of 15 percent cost reductions is expected to be achieved for future topside EPC projects. For 2014, Kvaerner expects revenues of around NOK 17 billion, including revenue from jointly controlled entities. Growth in current project portfolio over the last year and negative cost developments impact margins negatively. For 2015, improvements in the EBITDA margin development will depend on new awards with contribution in 2015.
Oslo, 27 October 2014 The Board of Directors and President & CEO Kværner ASA
© 2014 Kværner ASA
7
3rd quarter 2014 report
FURTHER INFORMATION Investor Relations Ingrid Aarsnes, SVP Investor Relations & Communications, Kvaerner, Tel: +47 67 59 50 46, Mob: +47 950 38 364, email:
[email protected] Media Torbjørn Andersen, VP Communications, Kvaerner, Tel: +47 67 51 31 44, Mob: +47 928 85 542, email:
[email protected] About Kvaerner: Kvaerner is a leading provider of engineering, procurement and construction (EPC) services, and delivers offshore installations and onshore plants for upstream oil and gas production around the world. Kvaerner ASA, through its subsidiaries and affiliates (“Kvaerner”), is an international contractor and preferred partner for oil and gas operators and other engineering and fabrication contractors. Kvaerner and its approximately 3 000 HSSEfocused and experienced employees are recognised for delivering some of the world’s most amazing and demanding projects. In 2013, the Kvaerner group had consolidated annual revenues of close to NOK 13 billion and the company reported an order backlog at 30 September 2014 of NOK 19.4 billion. Kvaerner is publicly listed with the ticker "KVAER" at the Oslo Stock Exchange. For further information, please visit www.kvaerner.com.
FINANCIAL CALENDAR 2015 Fourth quarter results 2014 Annual General Meeting 2015 First quarter results 2015 Second quarter results 2015 Third quarter results 2015
12 February 2015 9 April 2015 8 May 2015 16 July 2015 6 November 2015
The dates may be subject to change.
© 2014 Kværner ASA
8
3rd quarter 2014 report
FINANCIAL STATEMENTS INTERIM CONDENSED CONSOLIDATED INCOME STATEMENT Q3 2014 4 004 (3 810) 194 (18) 176
Q3 2013 Restated 3 080 (2 900) 180 (16) 165
YTD 2014 10 354 (9 701) 653 (50) 603
YTD 2013 Restated 9 021 (8 565) 456 (45) 411
FY 2013 12 960 (12 324) 636 (63) 573
Net financial income/(expense) Profit/(loss) from equity accounted investees, incl. impairments Profit before tax Income tax expense Profit from continuing operations Profit/(loss) from discontinued operations Net profit
(15) 0 161 (49) 112 (12) 100
(13) (3) 148 (47) 101 (17) 84
(50) (58) 494 (165) 330 (72) 258
(42) (25) 344 (117) 227 (30) 197
(96) (78) 399 (160) 239 206 445
Attributable to: Equity holders of the parent company - Kværner ASA
100
84
258
197
445
0.42 (0.05) 0.37
0.38 (0.06) 0.31
0.85 (0.11) 0.73
0.89 0.77 1.66
Amounts in NOK million Total revenue and other income Operating expenses EBITDA Depreciation and amortisation Operating profit
Earnings per share (NOK) Basic and diluted EPS continuing operations Basic and diluted EPS discontinued operations Basic and diluted EPS total operations
1.23 (0.27) 0.96
Restated figures for previous periods are reflecting impacts from reclassification of the Downstream & Industrials segment to discontinued operations. Please refer to note 8 for details.
INTERIM CONDENSED CONSOLIDATED STATEMENT OF COMPREHENSIVE INCOME Q3 2014
Q3 2013
YTD 2014
YTD 2013
FY 2013
100
84
258
197
445
Items that may be reclassified to profit or loss in subsequent periods: Cash flow hedges, net of tax - Fair value adjustment recognised in equity - Reclassified to profit or loss Translation differences, foreign operations
0 (0) 53
(2) 3 (18)
1 (1) 58
16 9 84
12 12 160
Items that may be reclassified to profit or loss in subsequent periods
53
(17)
58
110
185
Items not to be reclassified to profit or loss in subsequent periods: Actuarial gains/(losses) on defined benefit pension plans, net of tax Items not to be reclassified to profit or loss in subsequent periods
(0) (0)
-
Total other comprehensive income, net of tax Total comprehensive income
52 152
(17) 67
58 316
110 306
179 624
Attributable to Equity holders of the parent company - Kværner ASA
152
67
316
306
624
Amounts in NOK million Net profit/(loss) for the period
© 2014 Kværner ASA
9
(0) (0)
-
(5) (5)
3rd quarter 2014 report
INTERIM CONDENSED CONSOLIDATED BALANCE SHEET 30.09.2014
30.09.2013
31.12.2013
739 1 095 94 128 3 29 2 088
701 1 162 199 127 51 27 2 267
713 1 080 193 132 3 28 2 150
Current assets Trade and other receivables Prepaid company tax Total cash and bank Retained assets of business sold Total current assets Total assets
4 422 95 1 045 769 6 331 8 420
3 808 130 681 4 620 6 886
3 121 93 1 545 916 5 676 7 825
Equity and liabilities Equity Share capital Share premium Retained earnings Other reserves Total equity
91 729 1 808 35 2 663
91 729 1 623 (94) 2 348
91 729 1 715 (24) 2 511
485 0 184 669
477 1 200 678
479 0 170 649
4 789 110 148 40 5 087 8 420
3 508 22 330 3 860 6 886
4 057 56 330 223 4 666 7 825
Amounts in NOK million Assets Non-current assets Property plant and equipment Intangible assets Deferred tax assets Investments in associates and jointly controlled entities Interest bearing receivables Other non-current assets Total non-current assets
Non-current liabilities Interest-bearing loans Deferred tax liabilities Employee benefit liabilities Total non-current liabilities Current liabilities Trade and other payables Tax liabilities Provisions Retained liabilities of business sold Total current liabilities Total equity and liabilities
© 2014 Kværner ASA
10
3rd quarter 2014 report
INTERIM CONDENSED CONSOLIDATED STATEMENT OF CHANGE IN EQUITY
Total paid in capital
Amounts in NOK million Equity as of 31 December 2012
Retained earnings
Other reserves
820
1 578
Profit for the period 1 January to 30 September 2013 Other comprehensive income Total comprehensive income
-
197 197
110 110
Change in treasury shares Employee share purchase programme Dividend Equity as of 30 September 2013
-
-
820
(1) (3) (148) 1 623
-
248 248 1 (156) 1 715
Profit for the period Other comprehensive income Total comprehensive income
820 -
Dividend Equity as of 30 September 2014
820
Profit for the period 1 October to 31 December 2013 Other comprehensive income Total comprehensive income Change in treasury shares Dividend Equity as of 31 December 2013
(204)
Total equity 2 195 197 110 306
(94)
(1) (3) (148) 2 348
70 70
248 70 318
(24)
1 (156) 2 511
258 258
58 58
258 58 316
(164) 1 808
35
(164) 2 663
YTD 2014
YTD 2013
INTERIM CONDENSED CONSOLIDATED STATEMENT OF CASH FLOWS Q3 2014
Amounts in NOK million EBITDA continuing operations EBITDA discontinued operations Taxes (paid)/refund Changes in other operating assets and liabilities Cash flow from operating activities Capital expenditure Proceeds from sale of assets and operations Cash flow from other investing activities Cash flow from investing activities Dividends Cash flow from other financing activities Cash flow from financing activities Translation adjustments Net increase/(decrease) in cash and bank deposits Cash at the beginning of the period Cash at the end of the period
© 2014 Kværner ASA
194 (20) 49 (121) 102 (17) 0 (0) (17) 0 (14) (14) 2 73 972 1 045
11
Q3 2013 180 (14) (11) (542) (386) (69) 0 (2) (72) 0 (7) (7) 1 (465) 1 146 681
653 (92) 20 (753) (172) (121) 0 (14) (135) (164) (31) (195) 2 (500) 1 545 1 045
456 (24) (89) (431) (88) (130) 0 (4) (133) (148) (41) (189) 22 (388) 1 069 681
FY 2013 636 (37) (110) 117 606 (164) 376 (4) 208 (304) (52) (356) 19 476 1 069 1 545
3rd quarter 2014 report
SEGMENT INFORMATION Following the sale of Kvaerner’s onshore construction business in North America in December 2013, Kvaerner will not have any remaining operations in the US within the Downstream & Industrials segment, and remaining legacies within the segment are presented as discontinued operations in the group’s financial statements. The historical segment information has been restated for these changes. Consequently, Kvaerner only have one reportable segment as from fourth quarter 2013; Upstream. The Upstream segment includes the business areas Contractors Norway, Jackets, Concrete Solutions and Contractors International.
Group activities and eliminations
Upstream Amounts in NOK million External revenue and other income Internal revenue Total revenue and other income
Q3 2014 4 974 7 4 981
Q3 2013 4 094 5 4 100
Consolidated
Q3 2014 (970) (7) (977)
Q3 2013 (1 014) (5) (1 019)
Q3 2014 4 004 4 004
Q3 2013 Restated 3 080 3 080
EBITDA Depreciation and amortisation EBIT
212 (18) 194
197 (16) 181
(18) 0 (18)
(17) (17)
194 (18) 176
180 (16) 165
Net current operating assets
(416)
(539)
(99)
509
(515)
(30)
Group activities and eliminations
Upstream
Amounts in NOK million External revenue and other income Internal revenue Total revenue and other income EBITDA Depreciation and amortisation EBIT
YTD 2014
YTD 2013
12 924 22 12 946
11 383 42 11 424
711 (50) 660
511 (45) 466
YTD 2014
Consolidated
YTD 2013
YTD 2014
(2 570) (22) (2 592)
(2 361) (42) (2 403)
(58) 0 (58)
(55) (55)
10 354 10 354 653 (50) 603
YTD 2013 Restated
9 021 9 021 456 (45) 411
Restated figures for previous periods are reflecting impacts from reclassification of the Downstream & Industrials segment to discontinued operations. Please refer to note 8 for details.
Upstream Amounts in NOK million External revenue Internal revenue Total revenue and other income
FY 2013 16 040 51 16 091
EBITDA Depreciation and amortisation EBIT Net current operating assets
© 2014 Kværner ASA
12
Group activities and eliminations
Consolidated
FY 2013 (3 080) (51) (3 131)
FY 2013 12 960 12 960
708 (63) 645
(72) 0 (72)
636 (63) 573
(1 257)
(9)
(1 266)
3rd quarter 2014 report
NOTES Note 1 General Kværner ASA (the company) is a company domiciled in Norway. The Kvaerner group consists of Kværner ASA and its subsidiaries. Note 2 Basis for preparation Statement of compliance The condensed consolidated interim financial statements have been prepared in accordance with the International Financing Reporting Standard (IFRS) and IAS 34 Interim Financial Reporting for interim reporting as adopted by the European Union and additional Norwegian regulations.
Accounting principles The accounting principles applied in these condensed consolidated interim financial statements are the same as those applied in the Annual accounts 2013, except for adoption of new standards and interpretations effective as of 1 January 2014. The most relevant new standards adopted by Kvaerner are: IFRS 11 Joint Arrangements, replacing IAS 31 Interests in joint ventures and removes the choice of equity or proportionate consolidation accounting for jointly controlled entities. Adoption of this IFRS has not affected the group financial statements, as the group before 2014 were applying principles in accordance with IFRS 11. IFRS 10 Consolidated Financial Statements requiring consolidation on the basis of control rather than ownership. Adoption of this IFRS has not affected the group’s financial statements directly, but indirectly through Aker ASA’s revised assessment that they have control of Kværner ASA and Aker Solutions ASA under the new standard. Following this change, Aker Solutions is reported as a related party of Kvaerner as from 2014. The interim financial statements are condensed and do not include all the information required by IFRS for a complete set of financial statements and should be read in conjunction with the full year consolidated financial statements for Kværner ASA. The consolidated 2013 financial statements for Kvaerner are available upon request from the company’s registered office at Drammensveien 264, 0283 Oslo, Norway or at www.kvaerner.com. The interim financial statements have not been subject to audit. The functional currency of the entities within Kvaerner is determined based on the nature of the economic environment in which they operate. The functional currency and presentation currency of Kværner ASA is NOK. Numbers are rounded to the nearest million, unless otherwise stated. As a result of rounding differences, numbers or percentages may not add up to the total. The condensed consolidated interim financial statements reflect all adjustments, consisting only of normal, recurring adjustments that, in the opinion of Kvaerner’s management, are necessary for a fair presentation of the results of operations for the periods presented. Operating results for the periods presented are not necessarily indicative of the results that may be expected for any subsequent interim period or annual accounts. Note 3 Judgments, estimates and assumptions In applying the accounting policies, management makes judgments, estimates and assumptions that affect the reported amounts of assets, liabilities, income and expenses. The estimates and judgments are continually evaluated and are based on historical experience and other factors, including expectations of future events that are believed to be reasonable under the circumstances. Revision to accounting estimates are recognised in the period in which the estimate is revised if the revision affects only that period, or in the period of the revision and future periods if the revision affects both current and future periods. In preparing these condensed consolidated interim financial statements, significant judgements made by management in applying the group's accounting policies and key sources of uncertainty in the estimates were consistent with those applied for the period ended 31 December 2013.
© 2014 Kværner ASA
13
3rd quarter 2014 report
Note 4 Financial items Q3 2014 (9) (0) (5) (1) (15)
Amounts in NOK million Net interest income/(expense) Profit/(loss) on foreign currency contracts Net foreign exchange gain/(loss) Other financial items, net Net financial income/(expense)
Q3 2013 (13) 0 (1) 0 (13)
YTD 2014 (32) (11) (11) 4 (50)
YTD 2013 (41) (0) (2) 1 (42)
FY 2013 (57) (7) (31) (1) (96)
Loss on foreign currency contracts in the quarter and year to date is related to portfolio of hedging instruments not qualifying for hedge accounting.
Note 5 Share capital and equity Kværner ASA has 269 000 000 shares issued each with a nominal value of NOK 0.34. Kvaerner currently has no share-based compensation that results in a dilutive effect on earnings per share. Basic and diluted earnings per share have been calculated based on the following average number of outstanding shares:
Q3 2014 269 000 269 000
NOK thousand Shares issued Effect of own shares held Average number of outstanding shares
Q3 2013 269 000 (1 141) 267 859
YTD 2014 269 000 269 000
YTD 2013 269 000 (520) 268 480
FY 2013 269 000 (389) 268 611
Note 6 Contingent events Given the scope of the group’s worldwide operations, group companies are inevitably involved in legal disputes in the course of their activities. Provisions have been recognised based on expected outcome of any disputes and litigation proceedings in accordance with applicable accounting rules. Such provisions are based on management's best evaluations and estimates of a likely outcome of the dispute. However, the final outcome of such disputes and litigation proceedings will always be subject to uncertainties, and resulting liabilities may exceed recognised provisions. The disputes and litigation proceedings are continuously monitored and reviewed, and recognised provisions are adjusted to reflect management’s best assessment of most recent facts and circumstances. Litigation and arbitration costs are recognised as they occur. Significant, current disputes In 2011, arbitration was initiated against Longview and Foster Wheeler North America Corp. related to the Longview project delivered in 2011. Kvaerner’s claim is substantial and intended to recover excess construction costs and other damages incurred by Kvaerner North American Construction, Inc. in execution of the project. The customer’s counterclaims are also substantial. Longview Power LLC, the owner of the Longview Power Plant in Maidsville, West Virginia, filed for protection under Chapter 11 of the United States Bankruptcy Code in August 2013. The initiated Chapter 11 process will interfere with Kvaerner’s claims and will lead to subsequent delays in the cost recovery. In 2012, arbitration related to the Nordsee Ost project was filed. The last wind jackets for the project were delivered in October 2013. The arbitration process for the project will take more time than earlier anticipated due to high complexity and resolution has been delayed. It is currently not possible to estimate when the arbitration will be finalised. Based on current status of both on-going proceedings there is no change in expected financial outcome. Due to uncertainties related to these events and to avoid prejudicing Kvaerner's position, no estimate of the expected final outcome is disclosed.
© 2014 Kværner ASA
14
3rd quarter 2014 report
Note 7 Related parties The largest shareholder of Kværner ASA, Aker Kværner Holding as, is controlled by Aker ASA (70 percent) which in turn is controlled by Kjell Inge Røkke and his family through TRG Holding AS and The Resource Group AS. In accordance with IAS 24, all entities controlled by Aker ASA, associated companies and joint ventures of Kvaerner and certain other related parties are reported as related parties to Kvaerner. Following Aker ASA’s revised assessment that they have control of Kværner ASA and Aker Solutions ASA under IFRS 10, Aker Solutions and Akastor is reported as related parties of Kvaerner as from 2014. Comparative period disclosures do not include transactions with Aker Solutions and/or Akastor. Kvaerner believes that all transactions with related parties have been based on arm's length terms. The table below gives an overview of aggregated transactions and balances with related parties.
YTD 2014 348 (1 914) 0 1 78 565
Amounts in NOK million Revenue Operating expenses Net interest income/(expense) Interest bearing loans Trade and other receivables Trade and other payables
YTD 2013 146 (94) 2 49 16 11
FY 2013 220 (121) 3 1 20 8
Transactions and balances include discontinued operations.
Note 8 Discontinued operations – restatement impacts As from fourth quarter 2013, the Downstream & Industrials segment is classified as discontinued operations with comparative numbers restated:
Amounts in NOK million CONDENSED CONSOLIDATED INCOME STATEMENT Total revenue and other income Operating expenses EBITDA Depreciation and amortisation Operating profit Net financial income/(expense) Profit/(loss) from equity accounted investees, incl. impairments Profit before tax Income tax expense Profit from continuing operations Profit/(loss) from discontiued operations Net profit
© 2014 Kværner ASA
YTD 2013 Reported
Segment reclassified to discontinued
9 906 (9 474) 432 (51) 381 (41)
(884) 908 24 6 30 (0)
(25)
-
315 (118) 197 197
30 1 30 (30) -
15
YTD 2013 Restated
Q1 2013 Restated
Q2 2013 Restated
Q3 2013 Restated
9 021 (8 565) 456 (45) 411 (42)
2 663 (2 552) 110 (15) 96 (21)
3 278 (3 113) 165 (15) 150 (7)
3 080 (2 900) 180 (16) 165 (13)
(25)
(3)
(18)
(3)
344 (117) 227 (30) 197
72 (25) 46 (9) 37
124 (44) 80 (5) 75
148 (47) 101 (17) 84
3rd quarter 2014 report
Note 9 Discontinued operations – summary of financial data In December 2013, Kvaerner sold its onshore construction business in North America to Matrix Service Company. Following the sale, Kvaerner will not have any remaining operations in the US within the Downstream & Industrials segment, and remaining legacies within the segment are presented as discontinued operations in the group’s financial statements as from fourth quarter 2013. The results for the discontinued business are reported separately under the heading Result from discontinued operations in the group’s income statement. In the balance sheet, retained assets and liabilities are presented on separate lines.
Amounts in NOK million Total revenue and other income Operating expenses EBIT Net financial income/(expense) Profit before tax Income tax income/(expense) Net profit from discontinued operations Of which: Operations Gain on sale of discontinued operations Basic and diluted earnings per share (NOK) Net assets
Q3 2014 0 (21) (20) 0 (20) 8 (12)
Q3 2013 302 (318) (16) 0 (16) (1) (17)
YTD 2014 1 (93) (92) 0 (92) 20 (72)
YTD 2013 884 (914) (30) 0 (30) (1) (30)
FY 2013 1 666 (1 398) 268 (32) 236 (29) 206
(12) -
(17) -
(72) -
(30) -
(66) 272
(0.05)
(0.06)
(0.27)
(0.11)
0.77
729
950
729
950
693
Cash flows from discontinued operations are as follows: Q3 2014 (11) 0 11 1 1 19 20
Amounts in NOK million Cash flow from operating activities Cash flow from investing activities Cash flow from financing activities Translation adjustments Net increase/(decrease) in cash and bank deposits Cash at the beginning of the period Cash at the end of the period
© 2014 Kværner ASA
16
Q3 2013 27 (2) (75) (2) (52) 252 200
YTD 2014 (114) 0 76 1 (36) 56 20
YTD 2013 74 (6) (215) 18 (128) 328 200
FY 2013 45 271 (604) 16 (272) 328 56
3rd quarter 2014 report
Note 10 Quarterly historical information – continuing operations Q3 2014 4 004 4 981
Q2 2014 2 861 3 812
Q1 2014 3 489 4 153
Q4 2013 3 939 4 667
Q3 2013 3 080 4 100
1
Q2 2013 3 278 3 914
194 212
289 312
170 187
180 197
180 197
165 183
4.8 % 4.3 %
10.1 % 8.2 %
4.9 % 4.5 %
4.6 % 4.2 %
5.9 % 4.8 %
5.0 % 4.7 %
Net profit - continuing operations
112
123
95
11
101
80
Basic and diluted EPS continuing operations
0.42
0.46
0.35
0.04
0.38
0.30
2 801 2 809
5 360 5 372
1 283 1 291
1 925 1 925
1 594 1 603
2 305 2 329
19 353 19 358
21 507 21 512
19 696 19 698
22 809 22 809
25 647 25 657
28 147 28 153
(1 162) (1 078)
(1 266) (1 257)
(30) (539)
1 069
256
Amounts in NOK million Total revenue and other income Upstream EBITDA Upstream EBITDA margin Upstream
Order intake Upstream
2
Order backlog 2 Upstream NCOA Upstream
(515) (416)
(624) (613)
Net interest bearing deposits and loans
563
493
1 2
953
1
(579) (1 049) 723
Please refer to note 8 for details related to restated figures for previous periods. Including scope of work of jointly controlled entities closely related to Kvaerner’s operating activities.
© 2014 Kværner ASA
17
3rd quarter 2014 report