The vital few and trivial many: An empirical analysis of the Pareto Distribution of defects Timea Illes-Seifert, Barbara Paech Lehrstuhl für Software Systeme, Institut für Informatik Im Neuenheimer Feld 326 69120 Heidelberg
[email protected] [email protected] Abstract: The Pareto Principle is a universal principle of the “vital few and trivial many”. According to this principle, the 80/20 rule has been formulated with the following meaning: For many phenomena, 80% of the consequences originate from 20% of the causes. In this paper, we applied the Pareto Principle to software testing and analysed 9 open source projects (OSPs) across several releases. The results show that a small number of files account for the majority of defects, even across several releases. In contrast, there is no evidence that this small part of files containing most of the defects also makes up only a small part of the system’s code size. While this is not the first study about the Pareto Principle, it adds to the body of empirical body of knowledge wrt. software defects.
1 Introduction The Pareto Principle, also known as the 80-20 rule has been originally analysed by Vilfredo Pareto [Re05] who observed that 80% of property in Italy was owned by 20% of the Italian population. Juran [JG88] generalized this principle he called the “vital few and trivial many”, stating that most of the results in any context are raised by a small number of causes. This principle is often being applied in several contexts, e.g. in sales, stating that 20% of the customers are responsible for 80% of the sales volume. One of the first studies that translated this principle to the software engineering area is reported in [En79]. The author analyses the distribution of defects in an operating system developed at IBM laboratories. The distribution of about 430 defects over about 500 modules has been analysed and confirms the Pareto Principle, i.e. approximately 80% of the defects were contained in 20% of the modules. Two main hypotheses related to the Pareto Principle form the basis of this study. First, we want to analyse whether a small part of files accounts for the majority of defects. Second, if this is the case, we want to determine whether this small part of files also constitutes a small part of the system’s code size. Knowing the validity of the Pareto Principle in the testing context is very valuable for testers, because they can focus their testing activities on the “vital few” files accounting for most of the defects. In addition, the Pareto Principle can form the basis for defect prediction algorithms, as presented in [KZ+08] which predicts the subset of the most fault-prone files. From the research 151
perspective, this study increases the empirical body of knowledge in the area of defect distribution. First, by replicating empirical studies conducted before, more general conclusions can be derived. In any discipline, progress involves the building of a solid empirical body of knowledge [BL99]. Second, to our knowledge, this is one of few studies that focus on the analysis of the Pareto Principle in detail, including data from 9 large OSPs. The availability of OSPs enables to conduct such a comprehensive study. The reminder of this paper is organized as follows: The design of our study is described in Section 2, including hypotheses, characteristics of the analysed projects, as well as data collection procedures. In Section 3, the results of our empirical study are presented. In Section 4, we discuss the threats to validity and in Section 5 an overview of related work is given. Finally, Section 6 concludes the paper.
2 Study Design In this paper, we use the definition of defects and failures provided in [IS07]: A defect or fault is “a flaw in a component or system that can cause the component or system to fail to perform its required function. A defect, if encountered during execution, may cause a failure of the component or system”. Thus, a failure is the observable “deviation of the component or system from its expected delivery, service or result“. Defect count is the number of defects identified in a software entity. In this paper, we count the number of defects of a file. The file a is more fault-prone than the file b if the defect count of the file a is higher than the defect count of the file b. In the subsequent Sections details on the experiment are described. Hypotheses. In this paper, the following hypotheses related to the Pareto Principle will be analysed: • • • •
Hypothesis 1, Pareto distribution of defects in files: A small number of files accounts for the majority of the defects. Hypothesis 2, Pareto distribution of defects in files across releases: If the Pareto Principle applies to one release, then it applies to all releases of a software project. Hypothesis 3, Pareto distribution of defects in code: A small part of the system’s code size accounts for the majority of the defects. Hypothesis 4, Pareto distribution of defects in code across releases: If the Pareto Principle applies to one release, then it applies to all releases of a software project.
Subject Projects. In this study, we analysed 9 OSPs. As required in [Ha08], we applied the following criteria to select the OSPs: (1) The project is of a large size in order to permit significant results. Thus, the size of the selected projects ranges from about 70.000 LOC to about 240.000 LOC. (2) A well documented defect history is available. We searched for projects for which a bug tracking system is available. (3) The project is mature so that effects will have appeared if present. According to this criterion, we selected projects with a number of check-ins (we call them history touches - HT) in a
152
versioning control system (VCS) greater than 50.000. (4) The source code is available for at least one release. We included one project, OSCache that does not fulfil the criteria defined above, in order to compare the results obtained for all other projects with a smaller but mature1 project. The URL of all projects are given in the footnote2. OS-Project 1. Ant (1.7.0 ) 2. FOP (0.94 ) 3. CDK (1.0.1 ) 4. Freenet (0.7 ) 5. Jetspeed2 (2.1.2 ) 6. Jmol (11.2 ) 7. Oscache (2.4.1 ) 8. Pentaho (1.6.0 ) 9. TV-Browser (2.6 )
Project since
# Defects
2000 2002* 2001* 1999* 2005 2001* 2000 2005* 2003
4804 1478 602 1598 630 421 2365 856 190
# HTs
62763 30772 55757 53887 36235 39981 1433 58673 38431
LOC
234253 192792 227037 68238 236254 117732 19702 209540 170981
# Files
1550 1020 1038 464 1410 332 113 570 1868
Table 1: Subject Programs
A * behind the data in the column “Project since” denotes the date of the registration of the project in SourceForge3. For the rest, the year of the first commit in the versioning system is indicated. The column “OS-Project” contains the name of the project followed by the project’s latest version for which the metrics “LOC” (Lines of Code) and the number of files have been computed. The 3rd and the 4th columns contain the number of defects registered in the defect database and the number of HTs extracted from the VCS. Data collection. Similarly to the approach used in [FPG02], [CM03], [SZZ05], we combine the information contained in VCSs with information contained in defect tracking systems in order to compute the defect count per file. For this purpose, we extract the information of the VSC into a history table of a data base. Additionally, we extract the defects of the corresponding project into a defect table of the same data base. Then, we use a 3-level algorithm. Direct search: First, we search for messages in the history table containing the defect-IDs from the defect table. Messages containing the defect-ID and a text pattern, e.g. “fixed” or “removed”, are indicators for defects that have been removed. Keyword search: In the second step, we search for keywords, e.g. “defect fixed”, “problem fixed”, within the messages which have not been investigated in the step before. Multi-defects keyword search: In the last step, we search for keywords which give some hints that more than one defect has been removed (e.g. „two defects fixed“).We used SPSS4, version 11.5, for all statistical analyses.
1
The project exists since 2000. 1. http://ant.apache.org/, 2. http://xmlgraphics.apache.org/fop/index.html, 3. http://sourceforge.net/projects/cdk/, 4. http://freenetproject.org/whatis.html, 5. http://portals.apache.org/jetspeed-2/, 6. http://jmol.sourceforge.net/, 7. http://www.opensymphony.com/oscache/, 8. http://sourceforge.net/projects/pentaho/, 9. http://www.tvbrowser.org/ 3 http://sourceforge.net/ 4 SPSS, http://www.spss.com/ 2
153
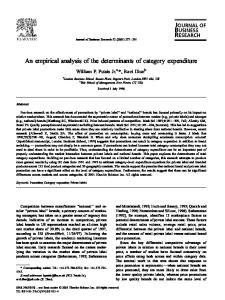
3 Results 3.1 Hypothesis 1: Pareto distribution of defects in files The first hypothesis related to the 80/20 rule concerns the distribution of defects in files. All OSPs presented in Section 2.2 have been analysed graphically in order to verify this hypothesis. Figure 1 shows the Alberg Diagram suggested by Fenton and Ohlsson [FO00] for the graphical analysis of the Pareto Principle. Thus, files are ordered in decreasing order with respect to the number of defects. Then the cumulated number of defects is plotted on the y-Axis of the Albert diagram relative to the percentage of files (plotted on the x-Axis). For example, in the case of the Jetspeed2 project, 80% of the defects are contained in 27% of the files. Figure 1 shows the distribution of defects of all analysed OSPs within one Alberg diagram.
Figure 1: Pareto distribution of defects for each OSP in an Alberg diagram
Approximately 80% of the defects are concentrated in a range of 1.3% (in the case of the TVBrowser project) to 27.2% (in the case of the Jetspeed2 project) of files. Thus, the TVBrowser project shows the strongest focus of defects on a very small part of the files. Only one project shows a concentration of 80% of defects in clearly more than 20% of the files. This is the case of the Jetspeed2 project, with 27.2%. In case of the Pentaho project, 21.9% of the files contain 80% of the defects that can be considered much closer to the 20% formulated in the hypothesis. Based on this analysis, Hypothesis 1 can be largely confirmed for OSPs: A small number of files account for the majority of the defects in OSPs. 7 OSPs show an even stronger focus of the majority of defects on a small part of files than required by the 80/20-rule. This is the case of TVBrowser, Jmol, OSCache, CDK, Ant and Freenet. Two other projects are close to the 80/20 rule.
154
3.2 Hypothesis 2: Pareto distribution of defects in files across releases In order to analyse this hypothesis, the percentage of the most fault-prone files containing 80% of the defects has been computed for several releases of the OSPs. Table 2 shows the results. The first column contains the name of the OSP, followed by the number of the analysed releases. The next two columns indicate the absolute and, respectively, the relative number of releases for which about 80% of the defects are concentrated in a small percentage (below 25%) of files. The column “Range” indicates the range for the concentration of defects. For example, the concentration of defects in the ANT project ranges from 8.23% to 24.97% of the files depending on the analysed release. Pareto distribution holds for …
OSP
Number of analysed releases
1. ANT 2. ApacheFOP 3. CDK 4. Freenet 5. Jetspeed2 6. Jmol 7. OSCache 8. Pentaho 9. TVBrowser
100% of defects contained in less than 25% of the files. This holds for … Absolute # Percentage of analysed of the releases analysed releases
Absolute # of analysed releases
Percentage of the analysed releases
5 4 7
5 4 7
100% 100% 100%
12.02% - 24.79% 3.14% - 20.56%
4 1 7
80% 25% 100%
6 3 9 4 3 4
6 2 9 4 2 4
100% 66.67% 100% 100% 66.67% 100%
1.95% - 17.29% 19.03% - 67.73% 1.52% - 17.42% 3.95% - 13.98% 9.12% - 35.12% 2.69% - 29.32%
2 0 8 4 1 3
17% 0 89% 100% 33% 75%
Range 8.23% - 24.97%
Table 2: Pareto Distribution of defects in files across releases
For 7 of the 9 analyses OSPs, 80% of the defects are contained in less than 20% of the most fault-prone files. The concentration of the defects ranges from 1.52% in the case of the Jmol project to 35.12%, in case of one analysed release of the Pentaho project. One exception is the Pentaho project. In one of the analysed releases, the defects are not concentrated on a few files but rather distributed among 67.73% of the files. In many releases of the analysed OSPs, we observed a high concentration of defects on a very small number of files. Thus, we additionally determined the percentage of files that account for 100%, i.e. for all defects in a system. The last two columns in Table 2 show the absolute and relative number of releases for which 100% of defects are contained in about 20 % of the files. Again, we used 25% of files as a threshold. In two thirds of the analysed releases of the OSPs (30 of 45), 100% of the defects are concentrated in less than 25% of the files. In 27 of 45 analysed releases, 100% of the defects are even contained in less than 20% of the files. Based on the results of these analyses, it can be concluded that the Pareto Principle largely persists across several releases of a software project. The concentration intensity can vary slightly from release to release.
155
3.3 Hypothesis 3: Pareto distribution of defects in code
100.00% 89.42%
90.00% 80.00% 70.00% 60.00% 50.00% 40.00%
24.97%
30.00% 16.93%
20.00%
10.18%
10.00%
2. 0 Jm ol 9 CD tb K ro 1 w s tb e r 1. ro 0 w se r Ap CD 0.9 ac K 2 he FO 0 05 P fre 0.9 en 4 fre et en 0.5 e fre t 0. en 5.2 et 0 os ca . 5.1 ch e an 2. 4 t1 .6 .5 . os a ca n t 1 ch e .7 2. CD 0.1 K . 20 06 Ap ac Jm ol he 10 Ap FO ac P 0 he .9 FO 3 os P 0 ca .2 ch e fre 2. en 1 et 0. 7 an t Jm 1.6 ol 11 .2 a pe n t 1 . nt a h 5.3 o 0 tb ro .8. 9 w se r2 an .6 Je t1 ts pe .6.1 ed 2 2. 0
0.00% tb ro w
se r
% of code vs. % of files containing 80% of the defects
In order to analyse the Pareto hypothesis for code, the percentage of code that accounts for 80% of the defects contained in the most fault-prone files has been computed. Consequently, this analysis determines if the small part of the files responsible for most of the defects also represent a small part of the code. The results of this analysis are shown in Figure 2. On the X-axis, the analysed releases of the OSPs are indicated5. The line chart and the bar chart indicate for each release the percentage of files and the corresponding percentage of code that account for approximately 80% of the defects. For example, in the case of the Jmol 9 release, 10.18% of the files that account for 80% of the defects make up 16.93% of the system’s code. Similarly, in the case of the Ant 1.6.1 release, 24.97% of the files that account for 80% of the defects make up 89.42% of the system’s code.
OSP releases % of code
% of files
Figure 2: Pareto distribution of defects in code
The concentration of the majority of the defects on a small part of the system’s code is true only for a small part of the OSP releases. About 5 releases show a concentration of defects on less than about 25% of the code (TVBrowser 2.0, Jmol 9, CDK 1, TVBrowser 1.0, TVBrowser 0.9). Most of the analysed releases show a distribution of the defects on about 30% to about 60% of the code. For a small part of the releases, the defects are distributed on almost the whole system. Based on this analysis, the hypothesis has to be rejected. A small part of the code accounts for the majority of the defects only in a few of the analysed cases. In addition, there is no evidence for the contrary hypothesis: If a small number of files account for 5
This analysis comprises all releases of the OSPs for which the source code is available.
156
the majority of the defects, it is because these files contain the most code. This statement is true for a small part of the analysed OSPs only. 3.4 Hypothesis 4: Pareto distribution of defects in code across releases
% of code vs. % of files containing 80% of the defects
Since the Pareto hypothesis on the distribution of defects in code has been rejected, the hypothesis 4 has to be adjusted. For all cases, in which the Pareto hypotheses could be confirmed: Does the Pareto distribution of defects in code hold for all or at least for the most releases of an OSP? Despite the fact that Hypothesis 3 has been rejected, this research question is important to be analysed. If this is the case, it means that for a small part of OSPs the Pareto Principle is valid and it is worthwhile to perform further analyses in order to determine characteristics of such programs and to find out factors that favour such a distribution. 100.00% 88.63%
90.00% 80.00% 70.00%
63.24%
60.00% 50.00% 40.00% 30.00%
30.78% 17.44%
29.32% 20.56%
20.00%
24.53% 18.09%
16.93%
14.44%
17.42% 7.74%
7.29%
10.00% 0.00%
44.65%
44.27%
20.38% 4.30%
10.18% CDK 2005
CDK 2006
CDK 1
% of code
30.78%
44.27%
% of files
17.44%
20.56%
7.88% 2.69%
Jmol 9
Jmol 10
Jmol 11.2 tbrowser 0.9 tbrowser 1.0 tbrowser 2.0 tbrowser 2.6
18.09%
16.93%
44.65%
63.24%
24.53%
20.38%
7.88%
88.63%
7.29%
10.18%
14.44%
17.42%
7.74%
4.30%
2.69%
29.32%
OSP releases % of code
% of files
Figure 3: Pareto distribution of defects in code across releases
Figure 3 shows the distribution of 80% of the defects in code across releases for all OSPs for which at least one release shows a concentration of most of the defects on less than 20% of the code. The bar chart shows the percentage of code that contains 80% of the defects, and the line chart shows the percentage of files accounting for 80% of the defects. In the case of the CDK and the Jmol project, only a single release shows a concentration of most of the defects on a small part of the code. For the other analysed releases, the defects are distributed on about 30% to 63% of the code. In the case of the TVBrowser project, three of four analysed releases show a concentration of most of the defects on a small part of the code. The last analysed release, however, shows a high distribution of the defects on about 88% of the code.
157
Based on the results of this analysis, the hypothesis can not be confirmed. A concentration of most of the defects on a small part of the code in one release does not mean that this concentration will persist in consequent releases.
4 Threats to validity Internal validity is concerned with the degree to which conclusions about the causal effect of the independent variables on the dependent variable can be drawn [WR+00]. One threat to validity is that not all developers deliver meaningful messages when they check-in files. Developers, for example, can also check in files without specifying any reason, even though they had corrected a defect. Thus, the defect count of a file can be higher than the defect count computed by our algorithm. This concern is alleviated by the size of the analysed OSPs. External validity is concerned with the degree to which results can be generalized [WR+00]. This issue is alleviated by the number and diversity of the analysed OSPs. The more OSP programs show the same characteristics, the higher the probability that other OSP programs would also show these characteristics. Additionally, we choose programs from different application domains in order to increase the representativeness of the study results. Furthermore, analyses of additional programs that are intended in our future work would increase the external validity.
5 Related Work There are several studies that analyse the Pareto distribution of defects in files. In contrast to our study, most of the studies concentrate on analysing few or one releases of a system or do not detail the results per release. Exceptions are the studies reported in [OW02] and in [KZ+08]. The Pareto distribution of defects in files is largely confirmed by most of the authors. The extent of the concentration varies from program to program. This is similar to the results obtained by studying OSPs in this paper and in [KZ+08]. In addition, the type of analysed defects differs from study to study. Roughly, the defect types can be categorized into pre-release6 and. post-release7 defects. The results of the studies in literature are summarised in Table 3. In [OW02] and in [KZ+08], the Pareto distribution across several consecutive releases is reported. In [OW02], the authors observe that the concentration of defects on a small part of files becomes stronger when the system matures. In [KZ+08], the authors report that for all analysed OSPs, 10% of the files account for 73%-95% of the defects. The results of the latter study are similar to the results reported in this study: The concentration remains low across nearly all releases of the analysed OSPs, but the extent to which defects are concentrated on a part of the files varies from release to release.
6
Pre-release defects are defects reported before release, usually by developers and testers. Post-release defects are defects reported after release, usually reported by developers, testers and in some case also by customers. 7
158
Ref.
Characteristics of the analysed projects
Relationship
Kind of defects analysed
[En79]
One release of the operating system DOS/VS Three projects from a large company in the telecommunications domain.
21 – 78
pre-release defects: defects found during system testing post-release defects8
[AR07]
20 – 87 (P1), 20 – 87 (P2) 20 – 80 (P3) 20 – 63 (P1), 20 – 70 (P2), 20 – 70 (P3)
[OA96]
Two consecutive releases of a telecommunication switching system
20 - 60
[KK96]
5 consecutive releases of a commercial telecommunications system
38 – 80
[FO00]
Two releases of a major commercial system developed at Ericsson Telecom AB
20-60
[MK92]
[OW02]
[KZ+08]
Two distinct data sets: command and control communication system, medical imaging system Thirteen releases of a large industrial inventory tracking system
Seven open source programs
pre-release defects pre-release and post-release defects altogether: defects reported during function, system and site tests, as well as during the first moths in operation21 pre-release and post-release defects altogether: defects reported as “Failure Reports” reported from validation teams and from customers pre-release and post-release defects altogether: defects reported during function test and system test by testers
10 – 100 1st release 10 – 80 2nd release
post-release defects: defects reported during operation21
20-65
pre-release and post-release defects altogether: defects recorded during system integration and test phases and for the first year of program deployment pre-release and post-release defects altogether: all kinds of defects recorded in one of these phases: development, unit testing, integration testing, system testing, beta release, controlled release, and general release.
10 - 68 10 -100 (for the last four releases)9.
pre-release, 36 – 80, 3 – 80 (in later releases), postrelease 1/2 - 80 10 – 73%-95%
separate analysis for pre-release and postrelease defects. pre-release and post-release defects altogether
Table 3: Pareto analyses in literature
Similarly to the results of this paper, there is little evidence for the Pareto distribution of defects in code reported in literature. The strongest concentration of defects on a small part of a system’s code size is reported in [OW02]. 10% of the files that account for a range of 68% - 100% of defects (depending on the analysed release) contain about 35% of the system’s code. But the percentage of the code contained in the most faultprone files always exceeded the percentage of the files that contained the defects. The results reported in [FO00], [AR07], and [KK96] do not provide evidence for the Pareto distribution of defects in code as well. This is the case for both pre-release and postrelease defects as reported in [AR07]. The only study analysing the Pareto distribution of defects in code across several releases is reported in [OW02]. In contrast to a decreasing concentration of defects on a small part of files from release to release, the corresponding percentage of code (contained in those fault-prone files) does not show such a trend. 10% of the most fault-prone files that account for the most of the system’s 8 It is not clear, whether post-release defects include the defects reported by the test team only or by the customers, too. 9 Concentration of defects on a small number of files gets increases as system matures.
159
defects make up about 35% of the code mass. This result is similar to the results obtained in this paper. The authors in [NZ+07] aim at predicting vulnerable components. In their case study, they report on the distribution of vulnerabilities across the Mozilla code base with the result that 4% of the components are involved in security fixes. There are several other studies that focus on predicting the defect count of a software entity using several indicators. Amongst others, in [GK+00], [AB06], [KA+98], [OWB05], [BOW06], [SC06], history characteristics (e.g. a file’s age or previous defects) and product characteristics (e.g. a file’s code complexity) are combined in order to predict the defect count. In [ZNZ08], indicators like complexity, problem domain, evolution and the development process are evaluated with respect to their ability to predict defects. A huge amount of research papers analyse the influence of other metrics of a software entity and its defect count, amongst others in [DP02], [NBZ06], [ZPZ07] and [GFS05]. In contrast to our study, the aim of these studies is defect prediction. Our main goal is to analyse the Pareto Principle on a large data set in order to increase the empirical body of knowledge in this area. If confirmed, the Pareto Principle can be used as basis for defect prediction as presented in [KZ+08].
6 Summary and Conclusions In this paper, we presented the results of an empirical study on the distribution of defects in software.In contrast to most of the studies considering a small number of commercial systems, we analysed the fault distribution in a wide range of open source projects across several releases. From the research point of view, this study increases the empirical body of knowledge. Replication of studies is advocated in order to gain confidence in the results instead of relying on single studies with specific context [Pf05], [BL99]. Two of our initial hypotheses could be confirmed: A small number of files accounts for the majority of the defects (Hypothesis 1). This is true even across several releases of software (Hypothesis 2). The results widely correspond to the findings reported in literature. Similarly to the results reported in literature, we did not find evidence for our initial hypotheses concerning the distribution of defects in code (Hypothesis 3). Defects concentrate on a small part of the files but they do not concentrate on a small part of the code. One reason for this could be that a considerable part of an application’s logic is concentrated on few files that are error-prone and not well understood. These files are candidates for refactoring and should be considered by maintainers. In addition, for fault-prone parts of the code, the unit test coverage criteria should be intensified. These files should also be higher prioritized during regression testing. One of the goals of the study has been to analyse the Pareto Distribution of defects. If confirmed, we expected to be able to give advices to testers on which parts of the software under test to concentrate their limited resources. Despite of the confirmation of the Pareto Distribution for files, defects are not concentrated on a small part of code.
160
Consequently, detecting which 20% of the files account for most of the defects is useful for testers, but not enough to prioritize testing activities because these 20% of the files possibly account for a high part of the code and hence of an application’s logic. For this purpose, additional indicators, e.g. a file’s age or its complexity should be used in combination with a Pareto analysis in order to give reliable advices to testers on which parts of the software testing activities should be focused. Algorithms like those presented in [KZ+08] that determine the most fault-prone files are also only useful when considering the amount of code covered by these files. The Pareto analysis is useful for maintainers too. The parts of code responsible for a high amount of software’s defects are candidates for refactoring. Acknowledgements We thank the anonymous referees for their valuable comments.
References [AB06]
Arisholm, E.; Briand, L. C.: Predicting fault-prone components in a java legacy system. In Proceedings of the 2006 ACM/IEEE international Symposium on Empirical Software Engineering, ISESE '06. ACM, New York, NY, 2006, 8-17. [AR07] Andersson, C.; Runeson, P.. A Replicated Quantitative Analysis of Fault Distributions in Complex Software Systems. IEEE Trans. Softw. Eng. 33, 5, May. 2007. [BL99] Basili, V. R.; Lanubile, F.: Building Knowledge through Families of Experiments. IEEE Transactions of Software Engineering, Vol 25, Issue 4, 1999, 456-473. [BOW06] Bell, R. M.; Ostrand, T. J.; Weyuker, E. J.: Looking for bugs in all the right places. In Proceedings of the 2006 international Symposium on Software Testing and Analysis (ISSTA '06). ACM, New York, 2006, 61-72. [CM03] Cubranic, D.; Murphy, G.C.: Hipikat: Recommending pertinent software development artefacts. 25th International Conference on Software Engineering (ICSE 2003), Portland, Oregon, 2003, 408-418. [DP02] Denaro, G. and Pezzè, M.: An empirical evaluation of fault-proneness models. In Proceedings of the International Conference on Software Engineering (ICSE), Orlando, Florida, USA, 2002, 241-251. [En79] Endres, A.: An analysis of errors and their causes in system programs. SIGPLAN Not. 10, 6 (Jun. 1975), 1975, 327-336. [FO00] Fenton, N. E.; Ohlsson, N.: Quantitative Analysis of Faults and Failures in a Complex Software System. IEEE Trans. Softw. Eng. 26, 8 (Aug. 2000), 2000, 797-814. [FPG02] Fischer, M.; Pinzger, M., Gall, H.: Populating a release history database from version control and bug tracking systems. Proceedings of the International Conference on Software Engineering (ICSE 2002), Orlando, Florida, USA, 2002, 241-251. [GFS05] Gyimothy, T.; Ferenc, R.; Siket, I.: Empirical Validation of Object-Oriented Metrics on Open Source Software for Fault Prediction. IEEE Trans. Softw. Eng. 31, 10, 2005, 897-910. [GK+00] Graves, T. L.; Karr, A. F.; Marron, J. S.; Siy, H.: Predicting fault incidence using software change history. IEEE Transactions on Software Engineering, vol. 26, 2000. [Ha08] Hatton, L.: The role of empiricism in improving the reliability of future software, Keynote Talk at TAIC PART 2008, http://www.leshatton.org/Documents/TAIC200829-08-2008.pdf, last visited October 2008.
161
[IS07] [JG88] [KA+98] [KK96] [KZ+08] [MK92] [NBZ06] [NZ+07]
[OA96]
[OW02]
Standard glossary of terms used in Software Testing Version 2.0 (December, 2nd 2007), Produced by the ‘Glossary Working Party’ International Software Testing Qualifications Board, http://www.istqb.org/downloads/glossary-current.pdf Juran, J.M.; Gryna, Jr.F.M.: Quality Control Handbook (4th edition), McGraw Hill, 1988. Khoshgoftaar, T. M.; Allen, E. B.; Halstead, R.; Trio, G. P.; Flass, R. M.: Using Process History to Predict Software Quality. Computer 31, 4, 1998, 66-72. Kaaniche, M.; Kanoun, K.: Reliability of a commercial telecommunications system. In Proceedings of the the Seventh international Symposium on Software Reliability Engineering (ISSRE '96), IEEE Computer Society, Washington, DC, 207, 1996. Kim, S.; Zimmermann, T.; Whitehead, E. J.; Zeller, A.: Predicting faults from cached history. Proceedings of the 1st Conference on India Software Engineering Conference ISEC, Hyderabad, India, 15-16, ACM, New York, 2008. Munson, J. C.; Khoshgoftaar, T. M.: The Detection of Fault-Prone Programs. IEEE Trans. Softw. Eng. 18, 5 (May. 1992), 1992, 423-433. Nagappan, N.; Ball, T.; Zeller, A.: Mining metrics to predict component failures. In Proceedings of the 28th international Conference on Software Engineering ICSE '06. ACM, New York, NY, 2006, 452-461. Neuhaus, S.; Zimmermann, T.; Holler, C.; Zeller, A.: Predicting vulnerable software components. In Proceedings of the 14th ACM Conference on Computer and Communications Security, Alexandria, Virginia, USA, ACM, New York, NY, 2007, 529-540. Ohlsson, N.; Alberg, H.: Predicting Fault-Prone Software Modules in Telephone Switches. IEEE Trans. Softw. Eng. 22, 12 (Dec. 1996), 886-894, 1996.
Ostrand, T. J.; Weyuker, E. J.: The distribution of faults in a large industrial software system. SIGSOFT Softw. Eng. Notes 27, 4 (Jul. 2002), 2002, 55-64. [OWB05] Ostrand, T. J.; Weyuker, E. J.; Bell, R. M.: Predicting the location and number of faults in large software systems. IEEE Trans. Software Eng., vol. 31, 2005, 340-355. [Pf05] Pfleeger, S. L.: Soup or Art? The Role of Evidential Force in Empirical Software Engineering. IEEE Softw. 22, 1 (Jan. 2005), 2005, 66-73. [Re05]
[Sc06] [SZZ05]
Reh, J.F.: Pareto's Principle - The 80-20 Rule, How the 80/20 rule can help you be more effective, about.com Management, http://management.about.com/cs/generalmanagement/a/Pareto081202_2.htm, last visited, December 2008. Schröter, A.; Zimmermann,T.; Premraj, R.; Zeller, A.: If Your Bug Database Could Talk. Proceedings of the 5th International Symposium on Empirical Software Engineering, Volume II: Short Papers and Posters, 2006, 18-20. Sliwersky, J.; Zimmermann, T.; Zeller; A.: When do changes induce fixes? On Fridays. Proceedings of the International Workshop on Mining Software Repositories (MSR 2005), St. Louis, Missouri, USA, 2005.
[WR+00] Wohlin, C.; Runeson, P.; Höst, M.; Ohlsson, M.C.; Regnell, B.; Wesslén, A.: Experimentation in Software Engineering: An Introduction. Kluwer Academic Publishers, 2000.
[ZNZ08] [ZPZ07]
Zimmermann, T.; Nagappan, N.; Zeller, A.: Predicting Bugs from History. In Software Evolution, 2008, 69-88. Zimmermann, T.; Premraj, R.; Zeller, A.: Predicting Defects for Eclipse. Proceedings of the Third International Workshop on Predictor Models in Software Engineering (PROMISE), Minneapolis, USA, 2007.
162