Impacts Of Credit Rating Announcements On Share Price In The NASDAQ Market And The Role Of The Credit Rating Agencies
Master Thesis: Msc in Finance_1 year by Wanlin Wu & Alexandros Michaildis
27/5/2014
Supervisors: Birger Nilsson Bujar Huskaj
Abstract
The purpose of this paper is to investigate the response of the stock prices of firms based on NASDAQ Select Market, during the Credit Rating Announcements made by one of the major rating agencies, Standard and Poor’s, before and after the Great Financial Crisis of 2007-2008. The test procedure is the application of the event study by which we are going to investigate whether or how much the markets respond to Credit Rating Announcements. Furthermore, some important added implications would be if the results suggest the existence of an asymmetric response according to the differences between upgrading, stable grading and downgrading, or between firms with different size of capitalization, as well as whether the strength of the response has changed after the 2008.Our empirical research showed that the firms that were assigned negative rating before the financial crisis, experienced a strong negative impact on their stock price. On the contrary, stable grading or up grading have no strong effect. However, it is shown that after the 2008 no Credit Rating Announcement has strong effect on the firms’ stock price. An analysis behind this intuition is provided.
Key words: Credit Rating Announcement, Standard and Poor’s , NASDAQ, Event Study
2
Table of contents 1. Introduction………………………………………………………………………….. 4 1.1
Why
use
the
Great
Financial
Crisis
of
2007-2008
as
a
time
threshold?........................................................................................................ .4 1.2 Role of Credit Rating Agencies, Incentives & Way of Assigning Ratings ……. 5 1.3 Why is Standard and Poor’s used as the main Credit Rating Agency?............... 7 1.4 Standard and Poor’s Outline of methodology framework……………………...8 1.5 Why NASDAQ?.................................................................................................11 2. Problem Discussion………………………………………………………………… 11 3. Data Collection………………………………………………………………………13 4. Methodology……………………………………………………………………… 16 4.1 Event Study…………………………………………………………………… 16 4.1.1. Definition of the event…………………………………………………...16 4.1.2. Estimation of normal and abnormal events………………………………18 4.1.3 Test for the abnormal returns……………………………………………..20 4.1.4 Analysis and interpretation of the result………………………………….21 5. Conclusion – Suggestions…………………………………………………………...26 6. Bibliography, References and Article review……………………………………….28 6.1 Books………………………………………………………………………28 6.2 Articles……………………………………………………………………..29 6.3 Electronic sources..………………………………………………………...30 6.4 Guest lecture………………………………………………………………..30
3
1. Introduction
We tried to underlie a modern and important question: How much and in which aspects has the recent Great Financial Crisis affected the markets and the behavior of the investors? In our case we investigated whether and how much the investors’ behavior has changed regarding their reaction in a Credit Rating Announcement.
1.1 Why use the Great Financial Crisis of 2007-2008 as a time threshold? We chose to conduct our research before and after the financial crisis since its effects were spread globally and had a huge impact in various aspects of the world economy. It is one of the biggest crises ever seen and we wonder about the impact that it would have on the market and the investors in the years to come. In order to understand better the importance of it, a small explanatory overview of the crisis will follow. It all began from the bubble that was created in the US real estate market. Individuals and speculators bought homes, which in general are considered to be illiquid assets, due to financing provided by mortgages with artificially low teaser rates for the first years and really high later on. The assumption behind that was that either the buyer’s income will grow granting him/her the possibility to repay back the loan or the upward trend of the value of the houses will be continuous, allowing the buyer to take again a new mortgage with initially low rates in order to roll over the debt. In order to avoid the exposure to the related high risk, banks tried to minimize and diversified it by packaging these debts into long- term securities and selling them to investors. The securities were characterized by high liquidity but their buyers used short-term debt for the purchase and increased the long term risk of the lenders. Furthermore, instead of using the diversification effect in a great extent to minimize the risk, they only managed to spread the risk globally. When the interest rate on the home buyers’ adjustable rate increased, people could not afford to make the repayments. This fact pushed the value of the houses further below the value of loans that were taken out to buy them, and the real estate market crashed.
4
Furthermore, home owners couldn’t repay back their loans nor sell their houses and banks became unwilling to roll over the relevant short debt, leading the investors to a fire sale of the securities, which destroyed their value. Finally, due to the complexity of the products and the large diversification the banks did not know the exact extent of their exposure to the risks, so they stopped conducting business with each other, triggering the credit crunch and the real global economic recession.1 It is quite reasonable that the value of the role of Credit Rating Agencies was widely questioned. Hundreds of billions of securities given the agencies’ highest ratings were downgraded to junk during the crisis. Rating downgrades have been blamed by EU officials for accelerating the crisis since credit ratings have become central features of global credit markets.2 So, our investigation mainly focuses to the possible change of the investors’ behavior before and after the crisis, toward the Credit Rating Agencies and the rating grading that they provide.
1.2 Role of Credit Rating Agencies ,Incentives & Way of Assigning Ratings We based our research on the assumption that the Credit Rating Agencies are playing a significant role in mitigating the information asymmetry that exists in the market. They incorporate price relevant information about the value of the firm in order to bridge the gap between the information held by the firm’s management, its current or future shareholders and creditors, as it is often necessary to prevent disclosure to various competitors regarding information about strategic plans and competitive advantages.
Credit Rating Agencies play a key role by enjoying privileged access to operating and financial information about issuers not only from company reports and other public sources, but through confidential discussions with key managers and owners as well.
1
Koller et al (2010)
2
Alessi (2010) 5
They also have the ability to devote important resources analyzing it and as a consequence rating announcements potentially convey new information to market participants.3 With the significant expansion of the global capital market, Credit Rating Agencies play a more and more important role in assessing creditworthiness of bonds issued by corporations, packages of asset-backed securities and governments and the firms themselves. Especially in the United States rating agencies are exempt from the Securities and Exchange Commission’s fair disclosure regulation. Introduced in 2000, Regulation FD prohibits firms from making selective non-public disclosures to market participants but allows them to share non-public information with rating agencies. Issuers might choose to communicate sensitive information with investors and creditors through confidential discussions with Credit Rating Agencies rather than through full public disclosure so as to avoid disclosing details to, for example, their competitors4. In conclusion Credit Rating Agencies analyze risk and provide their analysis to the general market in the form of ratings. Ratings are used by: 1) Investors as an independent benchmark of relative credit risk and for monitoring purposes. They close the information gap between lenders and borrower’s by providing independent opinions of credit worthiness reducing the information asymmetry and solving the well known “market for lemons” problem since the distinction among borrowers with different creditworthiness is more accurate. 2) Intermediaries as a tool to set initial pricing and by the issuers to diversify funding and investor base. Ratings help to more accurately map the interest that the lender charges to the true riskiness of the borrower.
3) Issuers as a management surveillance tool since it helps reduce the agency costs and align the interests between the investors and the management.
3
Micu et al (2004)
4
Griffin et al (1982) Ederington et al (1987) 6
In general, agencies also improve the market function and efficiency and reduce the ability of one investor to outperform another by making better judgments about creditworthiness.5
1.3 Why is Standard and Poor’s used as the main Credit Rating Agency? Credit Rating is a highly concentrated industry as the so-called big three Standard and Poor’s, Moody’s Investor’s Service and Fitch Ratings control approximately 95 % of the business. Moody’s and Standard and Poor’s are responsible for 80 % of the global market share.6 Standard and Poor’s rating agency has been in the business the last 150 years. It remains the world’s leading provider of independent credit risk research and benchmarks. They combine global reach with local knowledge with an office network of 23 countries and they have more than 1.1 million ratings outstanding. Of all corporate sector investment grade ratings issued, just 1 % has defaulted over the most recent five year period.7 The above facts and the influence they have in the global market led us to believe that Standard and Poor’s is the perfect candidate to base our research on.
5 6
Ekbom et al (2014) Alessi (2012) Hill (2002)
7
Ekbom et al (2014)
www.standardandpoors.com 7
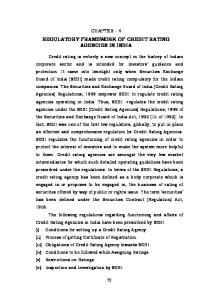
1.4 Standard and Poor’s Outline of methodology framework:8
Figure 1
This figure pictures the methodology of the risk assessment that the Credit Rating Agencies follow in order to assign the appropriate rating. First, the risk as a whole is divided in two different segments: the business risk and the financial one. After these segments are defined then the modifiers are being processed. For the latter, factors such as the capital structure, the financial policy or the management’s competence etc. are measured. Since they are regarded as factors that could increase or decrease the creditworthiness of the firm, they play a significant role before the credit profile of the firm is created. Finally, the exogenous factor of group or government influence is taken into consideration and the credit rating is assigned. We wanted to include in this paper also a table of the different rating categories in order to promote a better understanding of the news that they incorporate to the public.
8
Ekbom et al (2014) 8
Investment Grade AAA
Extremely strong capacity to meet financial commitments. Highest rating
AA
Very strong capacity to meet financial commitments
A
Strong capacity to meet financial commitments, but somewhat susceptible to adverse economic conditions and changes in circumstances
BBB
Adequate capacity to meet financial commitments, but more subject to adverse economic conditions
BBB-
Considered lowest investment grade by market participants
Speculative Grade BB+
Considered highest speculative grade by market participants
BB
Less vulnerable in the near term, but faces major ongoing uncertainties to adverse business, financial and economic conditions
B
More vulnerable to adverse business, financial and economic conditions, but currently has the capacity to meet financial commitments
CCC
Currently vulnerable and dependent on favorable business, financial and economic conditions to meet financial commitments
CC
Currently highly vulnerable
C
A bankruptcy petition has been filed or similar action taken, but payments of financial commitments are continued
D
Payments default on financial commitments
So each different rating provides different information of the financial health of the firm or the securitized product giving the probability of default. Our purpose is to measure the market reaction as it is expressed by the changes in the firms’ stock prices.
9
Figure 2
9
The figure above illustrates the probability of default calculated on a sample of debt securities rated by Standard and Poor’s in the period of 1981 and 2012.These probabilities are corresponding to each single rating at 15 yearly time horizon. We have to note that lower rating implies higher risk of default. Thus, it is shown that the probability of default is an increasing function of both credit risk and years to maturity. For the latter, we have to mention that a longer maturity term entails higher uncertainty level of the future conditions. For example we can see that while the average probability for securities with one year to maturity that were assigned a rating is 1.6% , this ratio would gradually increase to reach its highest level around 11.5% for securities with fifteen years to maturity. Also, it is also stated that investment grade securities with one year to maturity have 0.1% probability of default in contrast with speculative grade ones that their probability of default is 4.1%
9
Ekbom et al (2014) 10
1.5 Why NASDAQ? We decided to choose the firms of our sample from the NASDAQ’s different categories. Since our original objective was to make a comparison between the impacts of Credit Rating Announcement on big and small cap firms, it was the most reasonable choice as it is already composed by different groups regarding the capitalization distinction. NASDAQ itself is the second largest stock exchange in the world by market capitalization and it is divided in NASDAQ Capital Market, NASDAQ Global Market and NASDAQ Global Select Market. “The NASDAQ Capital Market is the equity market for companies that have relatively small levels of market capitalization and the listing requirements for this index are less stringent compared to the other two”. “NASDAQ Global Market has more strict financial and liquidity requirements, as well as strict corporate governance standards”. In our research, we came up with 8 firms out of more than 800 that had credit rating announcements. Especially, for the small capitalization firms of NASDAQ Capital Market only one had rating announcement. Except from the fact that the small cap firms do not usually seek for a rating as they finance their needs through other means, another possible reason for this outcome might be the high cost of this service. “The NASDAQ Global Select Market is a market capitalization weighted index made up of US-based and international stocks of firms with large capitalization”. It has strict financial and liquidity requirements and our sample is mainly consisted of this group’s firms. After careful consideration of more than 1100 firms we found 70 firms that had credit ratings, most of them though after the 2008 Financial Crisis.10
2. Problem Discussion
To set up our investigation we took under consideration the Efficient Market Hypothesis.11 The Efficient Market Hypothesis is one of the most important concepts in financial theory as it addresses the effects of competition in the financial markets on the 10
Definitions retrieved from investopedia.com ,(25 August 2013)
11
Fama (1970) 11
market prices of securities. It is based on the same assumptions that define the ideal capital market. It asserts that at all times a security’s market price fully reflects the true rational value of the security; it is fairly priced. For this to occur, the market price must reflect all available value relevant information. Fama specified the three forms of EMH as: 1) Weak, when the security price reflects all the historical information. 2) Semi strong, when both historical and public available information is incorporated at the price of the security. 3) Strong, when historical, public and private information is incorporated at the price of the security. In our case we assumed the semi strong form of Efficient Market Hypothesis in order to conduct the event study and value the effect of new information on the market value of the firm.12 So we based our research on the argument that a price response on the announcement of a rating change is evidence that agencies provide some information not already incorporated in a security or a stock price. Credit Rating Agencies can make different types of announcements in order to reflect the latest available information about a firm. The attempt to always be updated results to multiple announcements that can also lead to the increase of volatility. A great many of investors make investment decisions depending on the independent and objective ratings from rating agencies. According to Basel Accord II, credit rating is a key indicator for credit risk and companies with different credit ratings get different prices and economic capital weights. Therefore, the changes of credit rating on stock price are important both theoretically and practically. However, the financial crisis has brought Credit Rating Agencies in the teeth of the storm. Investors are wondering about the accuracy and the objective of the rating announcements whether they convey useful information of the certain firm. Do the credit rating announcements have the same impact on the stock price before and after the crisis? Do investors react differently toward different types of rating 12
Ogden et al (2003) 12
announcements due to the financial crisis? These are the practical questions brought out to be investigated.
Our aim is to build a model that would be able to measure the extent in which the credit rating announcement of a firm affects its stock prices. We explored the possible differences of the impact when it comes to firms with small and big capitalization as a firm’s size might be an indicator for the extent of the impact. Also, we wanted to analyze whether there is an asymmetric effect (i.e. downgrading of credit rating has greater impact than upgrading ones) or not. Finally we divided our test in two different time periods, before and after the 2008, year of the financial crisis. The intuition for the latter is to see if investors now pay more attention to the ratings although the agencies failed to come up with accurate predictions for the creditworthiness of high risk financial products that led to the crisis.
3. Data collection
First, we started by selecting the markets from which we would collect our sample data. We chose NASDAQ as it is a market broad index and the second biggest in the world according to market capitalization. Thanks to its different categories according to the firms’ market cap, it is the ideal candidate market to choose our sample from. We used NASDAQ Global Select Market for firms with large capitalization and the NASDAQ Capital one for the smaller firms. However, as we mentioned before, we had to abandon the firms with small cap in the NASDAQ Capital Market since in our process of collecting data, only very few of the small firms are rated and thus the appropriate sample is unavailable. In terms of the market returns, we needed to use a broad market index. We took the Standard and Poor’s 500 index as it covers 500 listed firms in US major trading markets. Compared to the Dow Jones Index, S&P 500 contains more diversified firms and therefore has better risk diversification, reflecting wider change of the market. The Capital IQ database provided us with the dates of the rating events, and DataStream the daily stock prices that we need in order to conduct the event study.
13
In order to implement the model, reorganization of data was of great significance for the following process. For stock returns the data from 100 days before of the event day to 100 days after the event day were required both for individual returns and the market return. Afterwards, we divided the returns into four groups according to their relative credit rating actions: upgrading and stable-grading before the crisis, downgrading before the crisis, upgrading and stable-grading after the crisis and downgrading after the crisis. The intuition behind the combination of upgrading and stable-grading is that previous studies show that stock prices usually do not respond in a different way whether there is a positive rating; upgrading or stable grading. Furthermore, in this way we tried to create bigger groups in order to provide more robust results.
Our total sample of the firms with ratings between the year of 2004 and 2014 is 77. Some firms faced severe problems during certain periods, leading to abnormal stock trading or even delisting for a long period, which would have made it unable to correctly identify the effect of the grading on the company's share price. In addition, it could also cause instability of estimation of model parameters within the estimated window. For precision, we got rid of these outliers. To be more specific, for each subsample we have: a group of 7 for the upgrading and stable-grading before the crisis, a group of 2 for the downgrading before the crisis, a group of 54 for the upgrading and stable-grading after the crisis and finally a group 14 for the downgrading after the crisis.
For simplification of the follow-up regression, we matched the stock prices of each firm (eg.FES) 100 days before of their corresponding announcement days with the index in each group (see table 1). What should be mentioned here is that we obtained both stock and market returns with the following formula:
Rt = ln (Pt / Pt-1). We saved the returns in estimation window in Table 1
14
(1)
Table 1
As is depicted above, Forbes Energy Services Ltd, with transaction code FES, is listed in the first column, followed by its credit rating announcement date 30 May 2012. In the fourth and fifth column, we collected and saved its stock returns and corresponding market returns of its estimated window, respectively . The same process was repeated for each firm. As for the data of the event window which is used for obtaining the abnormal returns, we summed up all the firms’ observed returns of each group in the 3day event window. After finishing this preparatory work, we are turning to the modeling section.
15
4. Methodology
4.1 Event study We wanted to conduct a typical event study before and after 2008, the usefulness of which derives from the fact that given rationality in the market any effect of an event such as a Credit Rating Announcement should be reflected immediately in asset prices due to the Efficient Market Hypothesis.
Event study is an effective method that specifically aims to measure the effects of an economic event that can be reflected on the firm’s asset price changes during a certain period. For listed companies, the purpose of an event study is to estimate whether the company's share price changes abnormally before and after the event.
Basically, there are four steps for a complete event study: 1) Define the event. The initial step is to determine the event and information of which we are going to conduct the research as well as in which period the corresponding stock prices are to be collected. 2) Estimate normal and abnormal returns. Normal returns are considered as the expected returns after the event while abnormal returns are calculated by the difference between the actual observed returns and the expected returns. 3) Conduct a test for abnormal returns. Based on the abnormal returns we have already observed, we aggregate them and implement a statistical significance test on them. 4) Analyze the result and give interpretation.
4.1.1 Definition of the event
To begin with, we defined the Credit Rating Announcement day as our event day. Then our focus is mainly on the measurement of the abnormal returns, making statistical inferences about them and aggregating over many event observations. Although the 16
usual procedure in relevant studies for the event window is to be 2 days, our event window is set to be three days: [-1, 1].
Figure 3 Estimation Window
T0
Event Window
T1
0
Post-Event Window
T2
T3
Time line for an Event Study
Seen from the figure above, the event window is from T1 to T2, namely the day before the announcement, the day of the announcement and the day after the announcement as is the usual procedure in relevant studies. The reason for it is the need to capture the price effect of the announcement which might occur after the closing of the stock market the next day. We adjusted this approach by taking into consideration the day before the announcement in order to avoid the case in which the market already knows or suspects the rating that is set to be announced. A knowledge that can lead to minimizing the effect that otherwise would have happened. A case that could be even more possible in our investigation, as our sample is composed mainly by firms of large capitalization which are being closely monitored by the market.
Next, the estimation window which is used for estimating the parameters of normal return model is shown on the figure from T0 to T1. Generally speaking, there is no fixed criterion when determining the length of estimation window. However, if we wrongly choose a short estimation window, it may lead to the imprecision of the parameters. Also, a rather long estimation window may to some extent cause the changes of data structure, meaning that the estimated parameters can also be influenced. According to relevant researches the normal length can vary between 60-100 days. In this thesis we took 100 days for the reason that within a reasonable range a longer estimation window is considered to be more precise. The post event window usually has the same length as the estimation one has, but either way is beyond of the scope of our investigation.
17
4.1.2 Estimation of normal and abnormal returns
After setting the length of windows, we proceeded with our work to choose an appropriate model to measure the normal returns, also defined as the expected return of event window. We decided to adopt the market model to calculate the normal returns instead of the other two widely used models: the constant-mean-return model and the market adjusted model. Here we used ERit to present expected return of stock i on time t. The market model is defined as:
ERit = αi + βiRmt
(2)
This model is based on the assumption that there exists a linear relationship between the individual expected returns and the market return during the event window. It provides a more sensitive adjustment of the return on a stock for contemporaneous market returns for two reasons: 1) The intercept of the regression
αi captures the average return on stock I given
that the market return is zero. 2) The term
βiRmt to
captures the sensitivity of returns on stock i to
contemporaneous market returns.13
According to the comparison that Brown in 1980 and Warner in 1985 have conducted to detect the efficacy of different abnormal returns obtained from different methodologies and limitations, market model is more effective when employing daily or monthly returns. In order to estimate the parameters α and β in the market model, we conducted an OLS regression for each group using data in Excel 1. The example regression results are summarized in Table 2.
13
Ogden et al (2013) 18
Table 2
c Std. Error(c) t-Statistic(c) P-value(c) β Std. Error(β) t-Statistic(β) P-value(β) R-Squared
up-stable before down before up stable after down after 0.0006 -0.0003 0.0002 -0.0003 0.0007 0.0010 0.0003 0.0002 0.8926 -0.3290 0.7160 -1.5058 0.3724 0.7425 0.4740 0.1323 0.7654 0.8630 1.2324 1.6117 0.0661 11.5771 0 0.1611
0.1146 7.5325 0 0.2227
0.0278 44.2761 0 0.2597
0.0054 298.7976 0 0.9846
Seen above, the basic inputs for our OLS regressions are listed for the four groups. None of the p-value for the constant is significant. Also, despite of the relatively low Rsquared we obtained , the p-value for the coefficients of the market returns are all zero, indicating that market returns can explain the individual stock returns to a large extent. Specifically, only R-squared for the down grating after the crisis is high among the four groups.
Before employing the estimates, in order for our parameter estimates to be more effective, we implemented a series of tests to examine whether there exist some problems to be solved with this time series data. We ran the following tests:
White test that showed no heteroscedasticity
ARCH test that showed no ARCH effect
Unit root that showed stationarity
Durbin Watson that showed no autocorrelation.
Afterwards, with the data in Excel 2, we calculated normal returns using the event window returns and the estimated coefficients α and β by the market model in each group.
19
4.1.2
Test for the abnormal returns
In terms of abnormal returns, we defined them as the difference between actual observed returns and normal returns in event window. In order to acquire the abnormal returns, we subtracted the normal returns from the observed returns:
ARit = Rit - ERit.
(3)
We aggregated the abnormal returns in each group to make overall inferences regarding the event of interest and took their average by dividing them with the number of firms N. In that way we computed the CAAR (Cumulative Average Abnormal Returns). The reason for which we took the average of CAR (Cumulative Average Returns) is that we wanted to eliminate the impact on stock prices which is caused by individual firms. Next, we implemented a t-test to observe whether the CAAR would reject the null hypothesis that CAAR in [t1, t2] equals zero. To conduct this test, we first computed the Variance of the CAR through the variance function of the excel. We took the average of VAR (CAR) to obtain VAR (CAAR), namely divide VAR (CAR) by the number of firms N. The test statistic J1 is given by the formula:
J1 = CAAR/ Var(CAAR)1/2 ~ N(0,1)
(4)
At last, with the increase of degrees of freedom, the t-distribution approaches to normal distribution. So we could simply employ the normal distribution because we have used a relatively long estimation window of 100 days. We used the function t-dist of excel to obtain the corresponding p-value for each group with the confidence interval 0.5:
p = 2*(1-NORMSDIST(ABS(J1)))
(5)
There are some assumptions made for the t-test here: First, there is no correlation across the abnormal returns of different stocks. Second, the abnormal returns should be normally distributed, also event windows of include securities do not overlap in 20
calendar time, etc. 14 In general, there are a few alternative test statistics when conducting an event study and we were supposed to choose the test statistic with the highest power. In this thesis, we adopted the J1 statistic for simplicity, since the test results are not likely to be sensitive to this choice over a short event window.
Regarding the investigation of the asymmetric effect, we have to note that the application of the relevant z test was avoided due to the specific reorganization and categorization of the data.
4.1.4 Analysis and interpretation of the result
Summary of results: Table 3
up-stable before down before up-stable after 0.0153 0.0213 0.0043 CAAR 0.0001 0.0001 6.6079E-06 VAR(CAAR) 1.3061 2.6694 1.6891 J1 0.1915 0.0076*** 0.0912* P-Value Accept Reject Accept
down after 0.0023 4.1014E-03 0.4643 0.6432 Accept
*, ** and *** represent statistical significance at the 10%, 5% and 1% level, respectively.
The summary of the results above lists the main inputs for our test. Since we conducted four eviews processes for each group, we obtained four groups of figures. For example in the second column, we got CAAR of 0.0153 of up-stable grading group before crisis through previous calculation with returns. Then we used the variance function in excel for VAR (CAAR) to get 0.0001. Afterwards we divided CAAR by the square root of VAR (CAAR) to obtain J1, 1.3061. Finally we implemented the t-dist function for the P-value, which is 0.1915. Because the result of t-dist is greater than the confidence level 5%, we accept the null hypothesis. The same process was repeated for the other three groups. It is very clear that the group upgrading and stable grading before the crisis,
14
John Y. Campbell et al, (1997)
21
upgrading and stable grading after the crisis and downgrading after the crisis accept the null hypothesis, indicating that the average abnormal returns equal zero in these three groups, which means the stock prices do not respond much toward Credit Rating Announcements. While the only group that rejects the null hypothesis under 5% confidence level is the downgrading before the crisis, showing that market does respond to the firms’ downgrading before the crisis. However, we have to note that we were unable to create a large enough sample for this specific group in order to provide a more robust result. Basically, the general result is consistent with what one would have expected intuitively as the financial crisis might have changed investors’ perspective toward rating adjustments and thus affect their investment decision.
Our sample led us to the conclusion that after the financial crisis the Credit Rating Announcements increased in a great extent. We can see that as a possible reassuring move from the rating agencies’ part toward the investors for providing better monitoring of the credit worthiness and the value of the firms in the market. However, based on our empirical results we can reach the conclusion that the effect of the Credit Rating Announcements is now limited especially for the positive and neutral ones. We believe that a possible reason might be the fact that investors have tried to extend their personal monitoring of the market, which minimizes the effect on their behavior that a possible announcement might have. Furthermore, we believe that their behavior also indicates that the trust between the investors and the agencies has been compromised15 for various reasons forcing them now to hold a skeptical altitude.
Possible reasons might be:
15
Information Asymmetry
The Economist print edition (2007)
Petroff (2009)
22
To assign a rating to certain corporation or financial products, Credit Rating Agencies have to search and collect relevant information as much as possible and evaluate their objectives based on it. However, Credit Rating Agencies usually cannot obtain sufficient information from their objective corporation or products. In fact, firms intend to conceal unfavorable information that will affect ratings thus rating agencies have difficulties reach a precise result. For instance, bond issuers never reveal emergencies which have negative impact on their capital liquidity.
Payment mechanism is been suspected
Theoretically, rating agencies represent benefits of investors while mostly rating fee is paid by issuers of firms themselves. Thus, from the investors’ prospective, rating agencies may assign high ratings to firms because they may be driven by profits and easily be bribed. This conflict may hinder rating agencies from passing objective judgment. Intuitively, rating agencies will lose the client if they do not meet their clients’ requirement. However, some agencies deny this conflict, stating that rating fee charged from single issuer is an extremely small proportion in the whole and thus the issuers are not able to have any effect on rating agencies. Before 1970, rating agencies charged fee from investors instead of bond issuers. Comparatively, nowadays 90% of rating agencies’ revenue comes from issuers. However, this mode also conveniently provides to the investors the free ratings of hundreds of thousands of firms and financial products; a great service when investment decisions are going to be made. At present, investors and other market participants can easily obtain numerous of free credit ratings from rating agencies and make comments or criticism toward them. Apparently, if the rating agencies charge the investors of certain firm or the financial product instead of the firm being rated, they will not put the rating results in public. Thus it can be seen that the current payment mode improves the transparency of rating standard and rating suggestions.
Over emphasize the importance of Credit Ratings 23
From the seventies, U.S. SEC (Securities and Exchange Commission) established NRSROs (Nationally Recognized Statistical Rating Organizations) for the reason of regulation. NRSROs empowered the major rating agencies special rights and kept consolidating their monopoly position in spite of their dissatisfactory performance and loss of reputation because these legislations could still bring them enormous benefits. According to the Basel Accord, banks whose internal risk management system and information disclosure cannot meet the strict criteria should adopt rating results from external credit rating agencies. Hence the three major credit rating agencies gradually became porters of financial market.16 Besides, investors overvalue the importance of credit ratings blindly due to information asymmetry and complication of financial products. Many investors lack thorough understanding of certain financial products and therefore Credit Rating Agencies are regarded reliable they provide access to undisclosed information.
Non-transparent rating process
Credit rating agencies have unpublished important information of firms; therefore they have the right to argue in favor of ratings they assign. Although, people hold the view that rating agencies have information that individual investors are not likely to obtain, they remain unaware of how they conduct the rating adjustments especially in terms of downgrading. This non-transparent rating process may have severe negative impacts on objective firms, thus lead to a sharp decrease of their share price. In addition, opportunistic practice will push it into an even worse situation. During this financial crisis, rating agencies did not dispose rating adjustments in time as well as not disclosing the supporting reasons, making investors consider they may have premeditated plans.
16
Avoidance of responsibility
Partnoy (2006) 24
Credit rating agencies state that the ratings are just their own viewpoint and they are thus been sheltered from both civil and criminal action. Especially, some district courts in the U.S published securities laws that prevent rating agencies to be free of legal liability. For this reason, the only consequence the rating agencies have to take is moral condemn from the public and loss of reputation.
Constraints of pricing models
To evaluate the complicated financial products, rating agencies have to take many factors into consideration. However, rating agencies adopted limited length of historical data when modeling, which increased the risk of biased ratings. This drawback of rating methods led to underestimation of credit crisis. More specifically, before the financial crisis, when rating agencies implemented models to evaluate subprime lending products, the data was constrained within the time horizon in which the housing price was likely to rise persistently. Without doubt, the combination of both lack of sufficient historical data and no former experience from a similar economic situation, led to imprecise ratings. Also, precisely estimation of the impacts of some exogenous factors can be tough and usually it might be simply ignored in some models e.g. impact on economy from rise of oil price.
Rating agencies have close relationship with objective firms
Inevitably, Credit Rating Agencies have close relationship with their objective firms. Common firms will take actions to avoid this kind of problems after a series of scandals while rating agencies seems that they don’t pay the necessary attention on it. For instance, Clifford Leopold Alexander, Jr., Moody’s previous leader of board of directors, also had been working in WorldCom Group for 19 years.17 During this period, WorldCom was assigned fairly good rating under the situation that its bond was traded with credit spread which belonged to the category of non-investment, in other words, below BBB/Ba. Consequently, the public become to wonder about the independence of suspected rating agencies.
17
Klein ( 2004) 25
5.
Suggestions and conclusion
In order to reach our conclusion and after stating the possible reasons for the skeptical behavior of the investors, we would like to suggest some possible resolutions regarding the role of every counterpart of the market accordingly: the agencies, the government and the investors.
Suggestions for Credit Rating Agencies
For clearness and investors’ better understanding of credit ratings, rating agencies should make their estimation models public as well as historical ratings and previous default information of the objective firms. Also, beside the documents and reports the firm present, rating agencies should work hard on searching and collecting objective information as much as possible, including public records, undisclosed information etc. and indentify carefully the authenticity of the materials. In addition, the rating agencies should extract experience and draw a lesson from the subprime crisis and try to modify and improve their statistical and econometric models under more comprehensive assumptions to better suit the current economy and finance condition, presenting us with more precise credit ratings.
Suggestions for government monitoring and regulation
In order to improve the quality of credit ratings and make the rating agencies more responsible for their significant role in the financial market, it is not enough to simply rely on their self-supervision and self-regulation. More importantly, the government should take actions to better supervise and regulate the rating agencies instead of letting things drift. First, the government should encourage competitiveness of credit rating industry. One of the most important reasons which is accounted for the subprime crisis is the monopoly of certain major Credit Rating Agencies. Under such condition, it is not possible for the rating agencies to supervise each other and reach a balance because the 26
industry is dominated and controlled by the big three.18 As we stated before the big three Credit Rating Agencies hold a collective global market share of roughly 95%. From
our perspective, encouraging competitiveness of credit rating industry may be an
effective way of improving this situation in which the big three rating agencies almost control the whole market. Moreover, the government should also regulate the payment method of credit ratings especially in terms of corporate bonds. Since the fee for the credit rating is no longer influential to the rating agencies, unified standards should be set to prevent the rating agencies from increasing the service fee. The government should consider it to be one of the market controlling measures for the rating fee as it is also a part of cost of the bond. By doing this, the conflict between rating agencies and client firms is remitted to some extent.
Suggestions for the investors
For millions of investors, credit ratings can be only considered as reference information instead of the major decision motivation no matter how precise they could be, letting along to replace the methods of risk analysis and management. Investors should hold the view that credit ratings are only an instrument for estimating risk and distinguishing between different credit qualities. Credit ratings cannot reveal market risk and it is not recommendation from rating agencies to sell or buy certain financial products. Moreover, because of the complexity of firms’ pecuniary condition or the structure of some financial products, it is impossible to mimic them accurately by statistical and econometric models in practice even though they may have assumptions and settings which seem to be matching. In words, investors should have their own judgment based on comprehensive measurements when making investment decision instead of relying only on credit ratings.
18
Indiviglio ( 2009) 27
In conclusion, through the application of the event study on a sample composed mainly by firms selected from the NASDAQ Global Select Market, we investigated the effect of a Credit Rating Announcement on the firm’s stock price using the year of the Great Financial Crisis as our time threshold. We made a comparison of the effect between and after 2007-2008 and our empirical research showed that the firms that were assigned negative rating before the financial crisis, experienced a strong negative impact on their stock price. On the contrary, stable grading or up grading have no strong effect. However, our investigation showed that although the rating announcements were increased after the 2008, none of them, positive or negative, has strong effect on the firms’ stock price. As we mentioned, investors now hold a more skeptical behavior after the Great Financial Crisis for reasons which might be the consequence of losing faith in the rating agencies. The world of economy is changing rapidly and is bringing new innovations all the time. Investors tend to be equipped with more specialized financial knowledge, become more and more rational both through information globalization and the lessons they have already learned from previous experience. Relevantly, rating agencies should also examine their own conscience carefully, take actions to improve themselves to regain their reputation from the public and provide better services for the financial market.
6.
Bibliograpy,References & Article review
6.1 Books
Campbell Y. J, Lo W. A., Mackinlay C. A, 1997, The Econometrics of Financial Markets (second edition)
Brooks C. ,2008 ,Introductory econometrics for finance ( second edition)
Koller T , Goedhart M, Wessels D , 2010, Valuation : Measuring and Managing the Value of Companies
Ogden P. J, Jen C. F, O’ Conor E. Philip, 2003, Advanced Corporate FinancePolicies and Strategies ,
Saunders A, Allen L, 2010, Credit Risk measurement in and out of the Financial Crisis 28
6.2 Articles
Alessi C, 29 May 2013, The Credit Rating Controversy. Campaign 2012, Council on Foreign Relations.
Brown J. S, Warner B. J, 1985, Use daily stock returns: The case of Event Studies.
Cornell, B, Landsman W, Shapiro A, 1989, Cross-Sectional Regularities in the Response of Stock Prices to Bond Rating Changes, Journal of Accounting, Auditing, and Finance, 4: 460-479.
Dichev, I. D. and Piotroski, J. D, 2001, The Long-Run Stock Returns Following Bond Ratings Changes, Journal of Finance56: 173-203.
Ederington L, Yawitz J, Roberts B, 1987, The informational content of bond ratings, The Journal of Financial Research.
Fama F. Eugene, 1970, Efficient Capital Markets: a review of theory and empirical work.
Goh C. J, Ederington H. L, 1999, Cross - sectional variation in the stock market reaction to bond rating changes.
Griffin A. P, Sanvicente Z. A, 1982, Common Stock Returns and Rating Changes: A Methological Comparison.
Hill, Claire A, 2002, Rating Agencies Behaving Badly: The Case of Enron, (Conn. L. Rev. 35, 1145)
Hilsche J, Wilson M, March 2013, Credit ratings and credit risk: Is one measure enough?
Holthausen W. R, Leftwich W. R, 1986, The effect of bond rating changes on common stock prices.
Hull J, Predescu M, White A, 2004, The relationship between credit default swap spreads, bond yields, and credit rating announcements.
Indiviglio D, June, 19, 2009, Three Suggestions for Reforming Rating Agencies.
29
Klein A, November 22, 2004, Moody’s board members have ties to clients , Washington Post.
Krivin D, Patton R, Rose E, Tabak D, 2003, Determination of the appropriate event window length in individual stock event studies , NERA
Li H, Visaltanachoti N, Kesayan P, 2004, The Effects of Credit Rating Announcements on Shares in the Swedish Stock Market.
May D. A, 2010, The impact of bond rating changes on corporate bond prices: New evidence from the over-the-counter market.
Micu M, Remolona E, Wooldridge P, 2004, The price impact of rating announcements: which announcements matter? ,Monetary and Economic Department BIS
Micu M, Remolona E, Wooldridge P, 2004, The price impact of rating announcements: evidence from the credit default swap market.
Norden L, Weber M, 2004, Informational efficiency of credit default swap and stock markets: The impact of credit rating announcements.
Partnoy F, 2006, How and Why Credit Rating Agencies are not like other gatekeepers? ,Social Science Network
Petroff E, Feb, 26th, 2009, Who Is To Blame For The Subprime Crisis?
The Economist print edition, Sep, 6th, 2007 , Credit and blame.
6.3 Electronic sources
www.standardandpoors.com
www.investopedia.com
6.4 Guest lecture at Lund University
Ekbom Alexander, Liedgren Gustav, 2014, Understanding Ratings
0
30