WP/05/214
The Impact on India of Trade Liberalization in the Textiles and Clothing Sector Prasad Ananthakrishnan and Sonali Jain-Chandra
© 2005 International Monetary Fund
WP/05/214
IMF Working Paper Office of Executive Director and Policy Development and Review Department The Impact on India of Trade Liberalization in the Textiles and Clothing Sector Prepared by Prasad Ananthakrishnan and Sonali Jain-Chandra1 Authorized for distribution by B.P. Misra November 2005 Abstract This Working Paper should not be reported as representing the views of the IMF. The views expressed in this Working Paper are those of the author(s) and do not necessarily represent those of the IMF or IMF policy. Working Papers describe research in progress by the author(s) and are published to elicit comments and to further debate.
We analyze the impact of the elimination of textile and clothing (T&C) quotas in 2005 on India. Our simulations suggest that while Indian exports of T&C will continue to expand in the presence of the safeguards on China, they will be affected adversely once these safeguards are lifted. We argue that India could emerge much stronger and expand its trade in T&C at a much faster pace, if some of the key domestic structural weaknesses are overcome. JEL Classification Numbers: F10, F13, F14, F17 Keywords: India, Agreement on Textiles and Clothing, MFA, GTAP, CGE models Author(s) E-Mail Address:
[email protected],
[email protected]
1
The authors would like to thank Mitali Das, Jean-Jacques Hallaert, Manoj Joshi, Deena Khatkhate, Kalpana Kochhar, Hans Peter Lankes, B.P. Misra, Monfort Mlachila, and Jerald Schiff for their helpful comments. They would further like to thank Jean-Jacques Hallaert for his help with the GTAP simulations and Dustin Smith for the U.S. trade data. All remaining errors are those of the authors.
-2Contents Page I. Introduction............................................................................................................................3 II. Trends in Trade in Textiles and Clothing: Where Does India Stand?..................................4 III. Impact of the Elimination of ATC Quotas: What Does the Literature Say?.....................10 IV. Simulation Results Using a General Equilibrium Model..................................................14 V. Constraints on the Textiles and Clothing Sector in India...................................................22 VI. Textiles and Clothing Sector Policy Environment in India...............................................24 VII. Policy Recommendations.................................................................................................25 VIII. Conclusions.....................................................................................................................29 Tables 1. Leading Exporters and Importers of Textiles and Clothing..................................................6 2. The Impact of Liberalization of Textiles and Clothing on Exports to the United States .....9 3. Imports of Textile and Clothing in the First Half of 2005 into the EU.................................9 4. Estimated Export Tax Equivalent of the ATC Quotas........................................................13 5. Impact of the Elimination of ATC Quotas on Welfare.......................................................17 6. Impact of the Elimination of Quotas on Trade...................................................................18 7. Impact on Export Volumes.................................................................................................19 8. Changes in Aggregate Export Prices..................................................................................20 9. Impact of the Elimination of Quotas on GDP....................................................................21 Figures 1. Shares of World Textile and Clothing Market, 1990-2003.................................................5 2. Shares in US Imports of Textiles.........................................................................................7 3. Shares in US Imports of Clothing........................................................................................7 4. Shares in EU Imports of Textiles.........................................................................................7 5. Shares in EU Imports of Clothing........................................................................................7 6. Shares in Japanese Imports of Textiles................................................................................7 7. Shares in Japanese Imports of Clothing...............................................................................7 Boxes 1. India - Targets of the National Textiles Policy (2000)......................................................30 2. Steps Taken by the Indian Government to Enhance Competitiveness... ...........................31 3. China’s Plans for the Textiles and Clothing Sector... ........................... ............................34 Appendix : Policy Responses by Other Countries.................................................................32 References..............................................................................................................................35
-3-
I. INTRODUCTION The textile and clothing (T&C) sector is an important one in the Indian economy. Textiles and clothing items have been significant in India’s export basket, accounting for nearly 20 percent of total exports during the 1990s. In 2003, T&C exports were the largest export group, accounting for 23 percent of Indian exports (or $13 billion). 2, 3 In addition, this sector is the second largest generator of employment (35 million or around 10 percent of the workforce), a significant earner of foreign exchange, and contributes 4 percent and 14 percent to GDP and value added in manufacturing, respectively (Ministry of Textiles, Annual Report 2003-04). The removal of quotas on textiles and clothing in 2005, under the Agreement on Textiles and Clothing (ATC) is expected to have a substantial impact on major exporting countries.4 A quota free regime represents an opportunity–as India has been constrained by quotas-as well as a challenge as there will be increased competition and no guaranteed markets. India has a competitive advantage stemming from its large and relatively low-cost labor force, a large domestic supply of fabrics, and the industry's ability to manufacture a wide range of products (USITC 2004). India has a very strong and diverse raw material base for manufacturing natural and artificial fibers. Furthermore, India also has capacity-based advantage in textile and spinning, and India’s textile industry covers the entire supply chain. Despite these advantages, whether India can benefit from the quota elimination will depend on the degree to which the existing constraints are removed. These constraints include stringent labor market regulation, inadequate investment, and unfavorable government policy in the past. The implementation of the ATC, meant as a transition period to full integration of the T&C sector, occurred in a back-loaded fashion. Before the ATC took effect, a significant portion of textile and clothing exports from developing countries to the industrial countries was subject to quotas under a special regime outside normal rules of the General Agreement on Tariffs and Trade (GATT). These former Multi-Fiber Agreement (MFA) quotas, when carried over into the ATC on January 1, 1995, represented the starting point for an automatic liberalization process. Liberalization was to be in four stages, with half of the integration to take place in the first three stages (1995-2005) and the second half to take place in the final phase in 2005. However, importing countries have had a great deal of flexibility over the elimination of quotas and items for which quotas were not binding were liberalized earlier. 2
The National Textile Policy targets textile and apparel exports of $50 billion by 2010. With comprehensive reforms, McKinsey (2004) expects India to increase its exports by 15-18 percent annually and win 5 percent of the global apparel export market by 2008 and to earn $25-30 billion. With only minor reforms, annual growth of 8 percent at best is expected. 3 4
World trade in T&C was $395 billion in 2003.
It is also expected to have a substantial impact on major importing countries, in particular on consumer prices and employment.
-4The removal of quotas on the most restrictive categories was back loaded by importing countries until the end of the transition period. Only 20 percent of the products subject to quotas were integrated in the first three phases of the ATC. This implies that the removal of quotas on the remaining 80 percent in 2005 has the potential to lead to sharp shocks including job and income losses in some developing countries.5 The structure of the global T&C industry renders some countries more competitive. The T&C industry employs semiskilled and unskilled labor, providing developing countries with a comparative advantage.6 However, in addition to labor costs, lead times and flexibility in production have become increasingly important. The mass retailers in developed countries, especially the United States, require flexibility and a fast turnaround. This implies that some developing countries are better poised to gain than others. Many early studies concluded that China and India will be the major beneficiaries of the quota elimination while many other developing countries may lose their export markets. A few recent papers however find that India may lose in the aftermath of the liberalization. This paper examines the impact of the elimination of quotas on India. Section II examines the trends in trade in the T&C industry during the transition period of the ATC. Section III presents current literature currently on the impact of the quota phase-out and elimination. Section IV analyzes the impact of the elimination of the ATC quotas on India using a general equilibrium model. Section V focuses on the specific constraints facing the Indian T&C sector. Section VI describes the policy environment in the Indian T&C sector. Section VII discusses a possible strategy for the future and Section VIII concludes. II. TRENDS IN TRADE IN TEXTILES AND CLOTHING: WHERE DOES INDIA STAND? Distinct signs of shifting of competitiveness have emerged from the data even during the early phases of integration. Globally, India’s market share increased only marginally in both sectors between 1995 and 2003 whereas China’s share increased significantly (Table 1 and Figure 1). India has gained larger access to the United States and Canada since 1995, but has lost market share in the European market.7 India’s market share in Japan is negligible. While India is an important player in T&C imports into the United States, China remains the dominant source of imports (Figures 2 and 3). Furthermore, while China increased its share in the U.S. market of T&C to 20 percent and 17 percent, respectively, in 2003, India could 5
The final stage, beginning on January 1, 2005, witnessed the removal of 701 quotas by the United States, 167 quotas by the European Union (EU) and 239 quotas by Canada.
6
The literature estimates that developing countries as a whole would have income gains of about $24 billion a year, export revenue gains of about $40 billion, and employment generation of 27 million jobs (IMF and World Bank 2002). 7
It should be noted that developments in the pre-2005 period were biased by the quotas that constrained many but not all countries.
-5increase its share in the U.S. textile market marginally and its share in the U.S. clothing sector fell slightly.8 A study by the U.S. International Trade Commission (2004) predicts that China is expected to become the "supplier of choice" for most U.S. importers (the large apparel companies and retailers) because of its ability to make almost any type of textile and apparel product at any quality level at a competitive price.9 However, the extent to which China continues to expand its shipments following quota elimination in 2005 will be tempered by use of the textile-specific safeguard provisions contained in China's protocol of accession to the World Trade Organization (WTO).
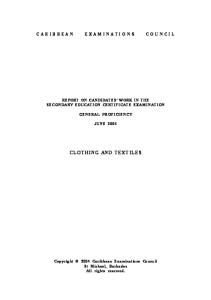
Figure 1. Shares of World Textile and Clothing Market, 1990-2003 20 18 16 14
Percent
12 10 8 6 4 2 0 1990 1991 1992 1993 1994 1995 1996 Source: World Integrated Trade Solutions (WITS) Database China
1997
1998
1999
2000
2001
2002
2003
India
8
India exports textiles and clothing mainly to the quota-imposing markets of the United States and EU; with these two markets comprise over 70 percent of Indian exports (World Bank, 2004). 9
The same study also observes that other low-cost countries, particularly India, will benefit, as U.S. importers try to reduce the risk of sourcing from only one country.
-6Table 1. Leading Exporters and Importers of Textiles and Clothing Value (US$ Billion)
Share in world exports/imports
Percent change
1995
2003
1995
2003
1995-2003
13.9 22.0 7.4 12.3 11.9 4.4 7.2 4.3 2.5 2.7 1.4 1.9 1.3 1.3
26.9 26.4 10.9 10.1 9.3 6.5 6.4 5.8 5.2 2.9 2.3 2.2 2.1 1.7
12.4 19.6 6.6 11.0 10.6 3.9 6.4 3.8 2.3 2.4 1.2 1.7 1.1 1.2
19.7 19.3 8.0 7.4 6.8 4.8 4.7 4.2 3.8 2.1 1.7 1.6 1.5 1.2
93.3 20.0 48.1 -17.8 -21.6 49.4 -10.4 36.5 107.4 7.6 64.9 11.5 63.7 24.7
24.0 14.9 6.1 2.7 4.1 6.7 2.0 3.4 1.4 5.0 5.0 ... 0.8 1.6
52.1 19.0 9.9 7.3 6.5 5.5 4.4 4.1 4.1 3.6 3.6 3.6 2.8 2.7
19.3 12.0 4.9 2.2 3.3 5.3 1.6 2.7 1.1 4.0 4.0 ... 0.6 1.3
28.1 10.3 5.4 4.0 3.5 3.0 2.0 2.2 2.2 2.0 1.9 1.9 1.5 1.5
116.5 27.5 62.4 168.8 57.2 -16.7 121.4 21.7 199.3 -27.7 -27.2 ... 255.1 68.2
Textiles China European Union (15) United States Korea, Republic of Taiwan Province of China India Japan Pakistan Turkey Indonesia Canada Thailand Mexico Czech Republic Clothing China European Union (15) Turkey Mexico India United States Bangladesh Indonesia Romania Thailand Korea, Republic of Vietnam Morocco Pakistan Source : World Trade Organization.
-7-
Figure 2. Shares in U.S. Imports of Textiles
Figure 3. Shares in U.S. Imports of Clothing 18
20 18
16
16
14
14
12 Per cent
12 10
10 8
8 6
6 4
4
2
2
0
0 China
Mexico
India
Pakistan
Korea
Source: WTO
1995
Taiwan Province of China
Turkey
China
Mexico
Hong Kong SAR
Honduras
Indonesia
India
Thailand
Dominican Republic
Korea
Source: WTO
1995
2003
Figure 4. Shares in E.U. Imports of Textiles
2003
Figure 5. Shares in E.U. Imports of Clothing 25
16 14
20 12 15 Percent
Percent
10 8
10
6 4
5 2 0
0 China
Turkey
Source: WTO
India
Pakistan
1995
Czech Republic
Korea
China Source: WTO
Turkey
2003
Romania
Bangladesh
1995
Figure 6. Shares in Japanese Imports of Textiles
Tunisia
India
2003
Figure 7. Shares in Japanese Imports of Clothing 90
60
80 50 70 60 Percent
Percent
40 30 20
50 40 30
10
20 10
0 China
Indonesia
Korea
Taiwan Province of China
India
0 Source: WTO
Source: WTO
1995
2003
China
Korea
Thailand
Indonesia
1995
Malaysia
India
2003
Exports to the EU show a weakening of India’s relative market share. In the T&C sector, while China accounted for 14 percent and 20 percent, respectively, of the European T&C market share by 2003, India’s share in this market declined to 5 percent and 9 percent (Figures 4 and 5). India’s exports of textiles to the EU were stagnant while exports of clothing grew marginally. China, on the other hand, more than doubled its exports in both sectors. The market structure in Japan is indicative of a post-quota world as Japan did not impose quotas in the pre-2005 period (Figures 6 and 7). China accounted for nearly half and 80 percent, respectively, of Japan’s T&C imports in 2003. Recently, imports from India, the Republic of Korea, Taiwan Province of China, and Hong Kong SAR have fallen, while
-8imports from Vietnam, Indonesia, and other member countries of the Association of SouthEast Asian Nations (ASEAN) countries have risen notably. The changes in the exports of items liberalized in 2002 provide an indication of the possible impact after the abolition of quotas in 2005. During this third phase of integration, Indian exports of products for which quotas were eliminated grew by 20 percent, whereas Chinese exports trebled (Table 2). T&C exports showed a fall of more than 50 percent on average for Bangladesh, Hong Kong SAR, Korea, Indonesia, the Philippines, and Thailand. Preliminary U.S. data for the first half of 2005 confirm that exports of T&C from China have surged, while some of the other exporters are facing sharp declines.10 In other exporting countries, exports are holding up though orders have weakened significantly as the industry is in the midst of transition to liberalized trade. U.S. trade data for the first half of 2005 indicate that, as expected, China has increased its T&C exports by around 242 percent in liberalized product lines11 and 66 percent of total textile products (value terms, Table 2). Export volumes from China rose by almost 50 percent in the first half of 2005, while prices of Chinese imports fell sharply. The prices of all apparel imports from China fell by almost 8 percent in first half of 2005, with wool product prices falling by 30 percent, prices of cotton coats, dresses, and knit shirts declining by more than 60 percent, and those of cotton trousers, skirts and sweaters falling by almost 50 percent. India’s textile exports to the United States grew by 30 percent, faster than all major exporters with the exception of China. The above trend is also witnessed in the case of the EU. EU imports from China and India grew by 35 percent and 11 percent, respectively, in value terms during January-May 2005 (Table 3). Import volumes from these two countries increased by 40 percent and 6 percent, respectively. For the products liberalized in January 2005, China’s exports surged at 80 percent, while India posted a moderate growth of 10 percent. Surprisingly, while the prices of exports of most countries fell (by almost 20 percent for Chinese exports), Indian export prices rose by 5 percent.
10
Caution is needed in analyzing the developments in the first half of 2005 as they reflect many factors including the end of the quota regime but also reflect the uncertainty regarding EU and US treatment of Chinese imports. 11
These are the product lines liberalized in January 2005, or the “Phase IV liberalization.”
-9-
Table 2. The Impact of Liberalization of Textiles and Clothing on Exports to the United States (In percent)
Bangladesh China Hong Kong SAR India Indonesia Korea Mexico Pakistan Philippines Thailand Turkey
Impact of the Phase III Liberalization on Exports 1/
Impact of the 2005 Quota Elimination on Phase IV Products 2/
Impact of the 2005 Quota Elimination on Value of Exports of all T &C Products 3/
Impact of the 2005 Quota Elimination on Volume of Exports of all T &C Products 3/
-52.4 298.5 -55.3 21.3 -44.2 -45.6 -14.9 14.8 -53.4 -66.3 -16.9
27.5 241.8 -26.0 34.2 16.7 -38.0 -4.0 -0.4 -4.9 8.9 -6.9
22.1 65.7 -26.8 29.1 15.4 -19.2 -4.0 10.5 -2.4 7.7 -2.5
19.4 46.6 -24.2 24.2 -1.4 -13.4 -4.4 5.9 -14.4 -4.6 -8.8
Sources: US International Trade Commission and U.S. Department of Commerce Office of Textiles and Apparel. 1/ Change in exports to the United States of textile and clothing items liberalized during Phase III (2002-04). 2/ Change in the value of exports to the United States of Phase IV textile and clothing items since end 2004 (January-June 2005). 3/ Change in the value of exports to the United States of all textile and clothing items since end 2004 (January-June 2005). 4/ Change in the volume of exports to the United States of all textile and clothing items since end 2004 (January-June 2005).
Table 3. Imports of Textile and Clothing in the First Half of 2005 into the EU (In percent) Change in Total Imports of Textile and Clothing 1/
Bangladesh China Hong Kong SAR India Indonesia Korea Mexico Pakistan Philippines Thailand Turkey
Change in Liberalized Imports of Textile and Clothing 2/
Value
Volume
Value
Volume
Prices
-7.2 35.3 -51.9 11.0 -18.3 -23.2 0.0 -16.8 -34.7 -14.0 1.8
5.0 40.4 -37.7 6.0 -13.9 -19.0 11.1 -7.0 -31.6 12.7 1.7
-7.5 80.3 -55.3 10.5 -20.8 -51.8 -12.1 -11.9 -37.3 -18.5 2.8
7.7 119.0 -43.9 5.2 -17.0 -51.0 15.0 -10.1 -35.5 -12.1 3.1
-15.2 -17.9 -20.0 4.8 -4.2 -1.7 -23.5 -8.9 -2.9 -7.4 -0.7
Source: European Commission. 1/ Change in total imports in January-May 2005, relative to 2004. 2/Change in imports of products liberalized on January 1, 2005 during January-May 2005. relative to 2004.
- 10 -
III. IMPACT OF THE ELIMINATION OF ATC QUOTAS: WHAT DOES THE LITERATURE SAY? The elimination of quotas on T&C is expected to have a significant impact on the production, exports, and employment in exporting countries in aggregate and a positive impact on the welfare of consumers in importing countries. The quota-imposing countries-the United States, EU countries and Canada-are expected to experience gains in welfare, despite a decline in production of T&C, through reduced consumer prices and through increased efficiency following enhanced specialization. For developing countries the net effect will depend on two factors: while the terms of trade will deteriorate resulting in welfare loss, quota-constrained exporters will experience an increase in efficiency as the distortionary trade regime is removed. The impact on specific developing countries is expected to be mixed, as the elimination of quotas is widely expected to lead to winners and losers. Most studies predict an increase in global welfare as a result of the phasing out of the ATC quotas (Yang 1994). Furthermore, the gains are expected to exceed those from the liberalization of other sectors in the Uruguay round (Nyugen, Perroni and Wigle 1993). Estimates of the gains range from $23 billion to $324 billion (Trela and Whalley 1990, 1995; Francois, McDonald, and Nordstrom 1994; Yang, Martin and Yanagishima 1997; and Lankes 2002). The estimates of the increase in welfare for the EU are around euros 25 billion (Francois, Glismann, and Spinanger 2000). The welfare impact on the United States is estimated at $7.3 billion (Reinart 1993). The differences in the results of the studies reflect differences in the methodologies including partial versus general equilibrium modeling, the different base years for the data, differences in the sectoral and regional aggregations used, and the absence of preference schemes from the GTAP database until recently. For the major exporting developing countries, the studies provide mixed results (Yang, Martin, and Yanagishima 1997). The WTO (Nordas 2004), using the GTAP model, concludes that while there will be substantial increases in market shares for China and India, developing countries where quotas were not restrictive are likely to lose.12 This study estimates that China will gain significantly, while India will increase its market share only modestly.13 Francois and Spinanger (2001) estimate that Indian clothing exports are likely to
12
This and other studies use 1995 or 1997 as the base. The results are based on the trade patterns observed in these two years. The results presented in this paper use the updated 2001 base year.
13
Simulations, using 1997 as the base year, suggest that China will increase market share in the EU from 10 percent to 12 percent for textiles, and from 18 percent to 29 percent for clothing, whereas India is projected to increase market share in the EU from 9 percent to 11 percent for textiles and from 6 percent to 9 percent for clothing. For the U.S. market, China’s share is expected to increase from 11 percent to 18 percent for textiles and triple in the clothing sector, from 16 percent currently to half of the market after the phase out. India’s (continued…)
- 11 double after 2005.14 For other developing countries and regions such as Mexico, Bangladesh (Mlachila and Yang 2004), Indonesia, the Philippines, and Hong Kong SAR, simulations suggest that the quota elimination may lead to a decline in the U.S. market share. Latin American and sub-Saharan African countries are expected to reduce exports of clothing significantly (Terra 2001, Avisse and Fouquin 2001, and Francois and Spinanger 2001). Recent work include simulations using the GTAP version 6, with 2001 as the base year (Cerra, Rivera and Saxena 2005, Manole 2005), shows a fall in economic welfare for India due to deterioration in the terms of trade. Our paper extends the analysis to scenarios with incomplete liberalization vis-à-vis China. The exports of China, India, and other Asian countries are the most restricted. The degree of restrictiveness of quotas is quantified by the export tax equivalent (ETE) of that quota. Exporters in countries where the quotas were binding had to buy the quota. Since the market clearing supply of quotas is not available, they sell at a premium, imposing in effect a tax on exports. Therefore increasing restrictiveness leads to rising export tax equivalents. There are many estimates of ETEs in the literature. Kathuria and Bhardwaj (1998) show that Indian exports to the United States faced an ETE of 39 percent for cotton-based exports and have risen over time. Our estimates suggest that ETEs on Indian exports are in the range of 6½-9 percent (Table 4). Until 2005, the United States and the EU had binding quotas on many categories of textile and clothing products from India, with many quota categories being 90 percent or more utilized. Terra (2001) estimates that the clothing production of restrained producers could increase by 20 percent. Although the existing literature on India suggests mixed results on the impact from the elimination of the quotas, the extent to which exports grow post-2005 will be tempered by structural rigidities (discussed in Section V) and the extent of the resurgence of protectionism. The United States and EU have signed preferential regional trade agreements containing tariff exemptions. These agreements and the Everything But Arms initiative provide quota free and duty-free imports in T&C with certain groups of countries.15 While market share in the U.S. is projected to remain at 5 percent for textiles, while its share of clothing is estimated to almost quadruple from 4 percent to 15 percent. 14
It is argued that if the removal of quotas is supplemented with domestic reforms geared towards the textile and clothing industry, welfare gains to India may be three times as high as compared to just the removal of quotas (Kathuria et al 2001).
15
The United States has signed the Caribbean Basin Trade Partnership Act (CBTPA), the African Growth and Opportunity Act (AGOA), the North American Free Trade Agreement (NAFTA), and the Andean Trade Preferences Act (ATPA). The EU accords preferential access to Eastern European countries and countries in the Mediterranean rim. Its preferential trade agreements include the Euro-Mediterranean Association Agreements, Africa Caribbean Pacific (ACP) Trade Agreement, and the Everything But Arms (EBA) Initiative with 49 least developed countries.
- 12 quota-free access to the EU and U.S. markets is likely to benefit currently constrained suppliers, this preferential access will also continue to impinge on textile and clothing exports of countries without it, due to relatively high tariffs in this sector.16, 17 Furthermore, the use of a textile-specific safeguard provision contained in China's WTO protocol of accession would be in other exporting countries’ favor.18 In addition, China has voluntarily decided to curb exports by imposing a tax on exports of T&C. A major dampener to the higher volumes of exports is the reduction in prices. In 2002, when quotas under the third phase of integration were lifted, prices of apparel fell by an average of 34 percent. As a result of increased competition and the disappearance of quota rents, it is estimated that China’s prices for apparel declined on an average by 53 percent between 2001 and June 2004 (American Textiles Manufacturers Institute).
16
The average post-Uruguay Round tariffs on textiles and clothing for the United States, EU, and Japan are 14.6 percent, 9.1 percent and 7.6 percent, respectively. At a disaggregated level, 52 percent of the textiles and clothing imports in the United States have tariff rates of 15.7 percent to 35 percent, 54 percent of EU imports have duties between 10.1 percent and 15.0 percent and 55 percent of the Japanese imports have the duties between 5.1 percent and 10.0 percent (UNCTAD 2004) 17
Recently, the EU unveiled the new generalized system of preferences (GSP) under which India will continue to enjoy GSP benefits for exports of clothing but not textiles to the EU. China will also lose the GSP benefits for exports of T&C to the EU.
18
On May 13 2005, the United States imposed safeguards, initiated in April 2005, on cotton knit shirts and blouses (Category 338/339), cotton trousers (Category 347/348), and cotton and man-made fiber underwear (Category 352/652) limiting import growth to 7.5 percent. It claimed that the U.S. market is being disrupted with substantial increases in imports of these products from China. In addition, currently there are other cases pending. On May 23, 2005, the EU initiated safeguards on two categories of textile products: t-shirts and flax yarn, constraining import growth to 7.5 percent. Furthermore, on June 10, 2005, the EU and China agreed on an arrangement that will manage the growth of Chinese textile imports to the EU until the end of 2008 on 10 categories of T&C.
- 13 -
Table 4. Estimated Export Tax Equivalent of the ATC Quotas (In percent) Exporting Countries/Regions
United States
EU Textiles
India China Hong Kong SAR Taiwan Province of China Bangladesh Other South Asia Philippines Indonesia Mexico
8.8 20.8 0.0 0.0 0.0 3.0 0.0 13.0 0.0
7.6 28.7 16.9 0.0 0.0 14.8 18.7 17.7 0.0 Clothing
India China Hong Kong SAR Taiwan Province of China Bangladesh Other South Asia Philippines Indonesia Mexico Source: GTAP 6.
6.7 27.3 0.0 0.0 0.0 0.2 0.0 0.0 0.0
6.7 25.3 7.2 0.0 0.0 7.3 19.9 9.7 0.0
- 14 IV. SIMULATION RESULTS USING A GENERAL EQUILIBRIUM MODEL A. Data and Model Specification We use the computable general equilibrium model from the Global Trade Analysis Project (GTAP version 6) to simulate the impact of the quota elimination. The GTAP contains the database and the software for the simulations. The GTAP database contains the bilateral trade, transport, and protection matrices that link all regions of the world. In turn, the regional matrices are derived from individual country input-output tables. The GTAP relates trade policy shocks to the medium term changes in global production and trade flows. We use the standard GE closure for the simulations. We present a regional aggregation model with 13 regions/countries, with the major exporters and importers (as per the WTO data) of textiles and clothing included. The countries/regions included are: Bangladesh, China, EU15, Hong Kong SAR, India, Indonesia, Korea, Mexico, Philippines, South Asia (other), Taiwan Province of China, United States and rest of the world (ROW). We use a five-sector aggregation, focusing on textiles, clothing, food, manufacturing, and services, for the simulations. Finally, we use a five-factor GE model. We simulate two scenarios to estimate the impact of the elimination of quotas on India. The first is a complete removal of the quotas, by eliminating the export tax equivalents of the MFA/ATC quota.19 The second scenario includes a partial reduction of quotas on China (of 50 percent), and a full removal of quotas (or equivalently ETEs ) imposed on other countries.20 This scenario aims to estimate the impact of the liberalization keeping in mind the somewhat more limited liberalization vis-à-vis China, as is permissible under China’s accession protocol to the WTO until 2008. Our paper’s contribution is to include an analysis of the incomplete liberalization and a focus on the impact on India. In both scenarios we present results for exports (prices, volumes, and values), GDP, trade balance, and welfare. The results are in 2001 constant dollar terms. The impact on welfare is measured as the change in equivalent variation.
19
However, we may be overestimating the liberalization as we remove all export tax equivalents (ETEs) as the GTAP does not permit the removal of simply those export taxes related to the MFA/ATC quota elimination. 20
We simulate a 50 percent reduction in the quotas imposed on China’s exports to analyze the sensitivity of scenario 1 to the presence of safeguards and are not intended to capture the precise impact of the current EU and US limits on imports of Chinese T&C. It should be noted, however, that these simulations can serve only as benchmarks since they are based on very aggregate information.
- 15 B. Results Tables 5 to 9 report the results from eliminating the MFA/ATC quotas on exports, imports, GDP, prices, and welfare. Scenario I assumes a full elimination of quotas, while Scenario II assumes a partial elimination of quotas for China and a full elimination for other countries. The results are as follows: •
World welfare would increase but India's welfare would drop due to a negative terms of trade effect even though there is a positive allocative efficiency effect (Table 5). 21 The main gains in welfare would accrue to the consumers in the EU and the United States via a reduction in prices. Of the exporting countries, China would stand to gain welfare despite a negative terms of trade effect as the increase in allocative efficiency is tremendous. In the pre-2005 world, Chinese exports were severely restricted and faced binding quotas in many product categories. In Scenario II, we see a smaller increase in world welfare due to incomplete liberalization, and a smaller increase in the welfare of the United States, EU, and China. On the other hand, we see a smaller (than Scenario I) negative welfare effect on other exporting countries such as India, Mexico, and Bangladesh. 22
•
In Scenario I, total world exports would grow only by 0.1 percent only but exports of clothing would grow by 3.1 percent and those of textiles by 0.4 percent (Table 6). There would be an asymmetric impact on Indian exports as textile exports are simulated to grow by 5.6 percent, whereas clothing exports fall by 4 percent under Scenario I. In the next scenario, with the incomplete liberalization vis-à-vis China, textiles and clothing exports from India are to grow at 13 percent and 11 percent, respectively. The higher Indian exports in Scenario II compared with Scenario I shows that some countries, including India, will benefit from the temporary restrictions imposed on Chinese exports.
21
In the GTAP model, economic welfare is represented as being derived from the allocation of national income between private consumption, government consumption, and savings. This recognizes that households gain benefits from the current net national saving since this increases their future household consumption. Benefit is also acquired from the government’s provision of public goods and services, as proxied by current government expenditure. Thus, the negative welfare effect for India is derived after taking into account the possible positive effect on domestic consumers because of the reduction in prices. 22
The negative effect on India is in contrast to the previous studies based on earlier versions of the GTAP database. This paper uses GTAP version 6, which includes an improved domestic coverage of India and also improved coverage of tariffs on agriculture and manufactures.
- 16 •
While export values for India fall in the first scenario, this can be explained by the fall in prices rather than export volumes. In both scenarios, the volume of textile and clothing exports grow, albeit much more robustly in the presence of safeguards on China (Table 7).
•
As expected, prices of T&C exports fall with the lifting of the quotas, with the quota rents disappearing and resulting in increased consumer welfare. Prices of Indian exports of T&C tumble by 4 percent (Table 8).
•
The impact on GDP is insignificant for the world, India and most other countries in the aggregation in the first scenario (Table 9). The exceptions are China and Bangladesh, where GDP rises by 2 percent in the former and falls sharply by 4 percent in the latter. In the second scenario, India’s GDP is projected to rise by half a percent, while that of China’s by 1 percent. The impact on Bangladesh’s GDP is moderated to a fall of 2.4 percent.
These results need to be interpreted with caution since the GTAP does not model the possible impact of domestic structural reforms in this sector in the intermediate period. Furthermore the simulations are comparative static in nature and do not capture the dynamic effects of, for instance, the impact on productivity of greater competition. It should also be noted that the comparative static approach also renders it difficult to capture the impact of uncertainty over U.S. and EU trade policy on the sourcing decisions of importers.
- 17 Table 5. Impact of the Elimination of ATC Quotas on Welfare ( In 2001 constant US Dollars) Scenario I- FULL ELIMINATION OF QUOTAS Decomposition
India China Hong Kong SAR Taiwan Province of China Bangladesh South Asia, other Philippines Korea Indonesia United States Mexico EU 15 Rest of the World Total
Total
Effect of Allocative Efficiency
Effect of Terms of Trade
-449 2,855 -717 12 -486 -383 -96 -143 -270 5,657 -477 10,507 -2,166 13,846
66 9,260 78 3 -165 94 73 54 185 872 -205 3,978 -515 13,779
-555 -4,560 -842 24 -249 -485 -174 -147 -385 3,827 -326 6,101 -2,180 50
SavingsInvestment Effect 1/
40 -1,845 47 -15 -73 8 5 -51 -69 959 54 428 529 17
Scenario II- PARTIAL ELIMINATION OF QUOTAS ON CHINA 2/ India China Hong Kong SAR Taiwan Province of China Bangladesh South Asia, other Philippines Korea Indonesia United States Mexico EU 15 Rest of the World Total
-144 2,768 -214 -18 -269 -114 8 11 -157 2,478 -241 5,807 -1,349 8,565
206 5,271 105 2 -88 185 91 194 252 404 -96 2,237 -213 8,551
-364 -1,744 -356 -11 -141 -310 -96 -124 -299 1,588 -169 3,383 -1,347 11
Source: Simulations using GTAP 6.0. 1/The breakdown of the terms of trade effect for India is food: 10; textiles: -325; clothing: -251; manufacturing: -10; and services: 20 2/ This scenario assumes a complete elimination of quotas for all countries except China. For China, it assumes a 50 percent reduction in quotas.
14 -760 37 -9 -40 10 13 -59 -110 486 24 187 211 3
-68.2
Hong Kong SAR -0.4 23.4 -4.2 -1.1 -0.4 0.1
-25.9
Hong Kong SAR 0.4 18.7 -17.3 -0.3 0.3 -0.4
Taiwan Province of China 0.2 -0.1 -14.4 0.2 0.0 0.0
-23.7
Taiwan Province of China 0.2 1.0 -29.3 0.5 -0.1 0.1
Korea -0.4 10.0 -8.3 -0.5 -0.8 0.1
-10.6
41.1
-129.4
(In Millions of 2001 US Dollars)
Philippines 1.1 8.9 -14.6 0.8 0.5 0.1
Impact on Value of Exports (in percentage change) South Asia, other -0.7 14.7 -21.2 -0.5 -0.6 -0.5
-15.49
76.81
Bangladesh 7.7 -10.4 -11.6 11.2 6.3 -5.6
Philippines -0.5 20.1 3.9 -0.5 -0.7 0.1
-111.4
-50.96
-98.07
Korea -0.5 10.7 6.0 -0.9 -0.7 0.2
(!n Millions of 2001 US Dollars)
South Asia, other -3.6 18.2 -7.4 -5.6 -3.5 1.7
Impact on Value of Exports (in percentage change)
Scenario II- PARTIAL ELIMINATION OF QUOTAS ON CHINA 1/
138.9
Bangladesh 13.8 -14.1 -24.0 21.6 11.7 -10.1
1/ This scenario assumes a complete elimination of quotas. 2/ This scenario assumes a complete elimination of quotas for all countries except China. For China, it assumes a 50 percent reduction in quotas.
Source: Simulations using GTAP 6.0
894.6
Food Textiles Clothing Manufactures Services Total
-55.72
China -3.1 19.6 36.7 -4.0 -2.3 1.5
India -1.9 12.5 10.7 -2.5 -1.5 0.8
Trade balance, change
Trade Balance, change
438.0
-97.7
Food Textiles Clothing Manufactures Services Total
China -7.7 51.0 85.1 -9.8 -5.7 3.5
India -0.6 5.6 -4.0 -0.3 -0.4 0.0
Scenario I- FULL ELIMINATION OF QUOTAS
Table 6. Impact of the Elimination of Quotas on Trade
-105.3
-53.45
-168.35
Indonesia United States -1.1 0.4 39.2 -2.8 2.1 -1.1 -2.0 0.3 -1.5 0.1 1.0 0.2
-94.9
Indonesia United States -0.2 0.6 30.2 -3.9 -13.1 0.7 -0.7 0.6 -0.8 0.1 0.5 0.4
16.42
Mexico 0.5 -11.1 -15.5 0.9 0.5 -0.1
46.2
Mexico 0.9 -19.3 -33.1 1.9 0.8 -0.1
-437.77
EU 15 0.0 -10.7 -10.8 0.4 0.1 -0.1
-593.0
EU 15 0.0 -15.8 -18.8 0.6 0.1 -0.1
Rest of the World 0.3 -6.9 -13.9 0.3 0.1 -0.1
416.4
Rest of the World 0.5 -11.4 -28.7 0.7 0.1 -0.2
71.58
Total 0.0 0.2 1.4 0.0 0.0 0.0
Total 0.0 0.4 3.1 0.0 0.0 0.1
- 18 -
- 19 -
Table 7. Impact on Export Volumes (Percentage change) Textiles
Scenario I 1/ Clothing
10.3 66.2 24.6 1.0 -11.5 21.4 15.2 12.1 39.9 -3.5 -19.0 -14.6 -10.9
0.6 113.5 -16.0 -29.3 -22.0 -19.0 -11.4 -5.5 -10.2 1.8 -32.9 -17.7 -28.2
India China Hong Kong SAR Taiwan Province of China Bangladesh South Asia, other Philippines Korea Indonesia United States Mexico EU 15 Rest of the World
Scenario II 2/ Textiles Clothing 17.2 24.7 29.6 -0.1 -8.9 24.2 26.9 13.0 49.7 -2.6 -11.0 -9.9 -6.3
Source: Simulations using GTAP 6.0 1/ This scenario assumes a complete elimination of quotas. 2/ This scenario assumes a complete elimination of quotas for all countries except China. For China, it assumes a 50 percent reduction in quotas.
15.8 46.4 -2.6 -14.4 -10.4 -5.6 7.6 9.3 5.3 -0.6 -15.3 -10.1 -13.4
- 20 Table 8. Changes in Aggregate Export Prices (Percent Change) Scenario I- FULL ELIMINATION OF QUOTAS
India China Hong Kong SAR Taiwan Province of China Bangladesh South Asia, other Philipinnes Korea Indonesia United States Mexico EU15 Rest of the World
Food 0.1 2.3 0.1 0.0 -3.4 0.2 -0.2 0.3 0.1 -0.1 -0.3 -0.1 -0.1
Textiles -4.3 -9.2 -4.7 0.0 -3.0 -5.6 -5.4 -1.9 -6.9 -0.5 -0.3 -1.4 -0.6
Clothing -4.7 -13.4 -1.6 0.0 -2.5 -2.7 -3.7 -2.9 -3.2 -1.1 -0.3 -1.3 -0.7
Manufacturing 0.1 1.7 0.2 0.0 -3.1 0.1 -0.1 0.2 0.2 -0.1 -0.3 -0.1 -0.1
Services 0.1 2.0 0.1 0.0 -3.9 0.2 -0.2 0.2 0.2 -0.1 -0.3 -0.1 -0.1
Scenario II- PARTIAL ELIMINATION OF QUOTAS ON CHINA 1/ Food India 0.6 China 0.9 Hong Kong SAR 0.2 Taiwan Province of China 0.0 Bangladesh -1.9 South Asia, other 1.2 Philipinnes 0.2 Korea 0.2 Indonesia 0.4 United States 0.0 Mexico -0.2 EU15 -0.1 Rest of the World -0.1 Source: Simulations using GTAP 6.0.
Textiles -4.0 -4.1 -4.8 0.0 -1.6 -4.8 -5.3 -2.1 -7.0 -0.2 -0.2 -0.9 -0.6
Clothing -4.4 -6.6 -1.6 0.0 -1.3 -1.9 -3.5 -3.0 -3.1 -0.5 -0.2 -0.8 -0.7
Manufacturing 0.4 0.7 0.2 0.0 -1.7 0.9 0.1 0.2 0.4 0.0 -0.1 -0.1 0.0
1/ This scenario assumes a complete elimination of quotas on for countries except China. For China, it assumes a 50 percent reduction in quotas.
Services 0.5 0.8 0.2 0.0 -2.1 1.2 0.2 0.2 0.5 0.0 -0.2 -0.1 -0.1
- 21 Table 9. Impact of the Elimination of Quotas on GDP (In percent) Scenario I- FULL ELIMINATION OF QUOTAS
India China Hong Kong SAR Taiwan Province of China Bangladesh South Asia, other Philippines Korea Indonesia United States Mexico EU 15 Rest of the World Total
Consumption 0.0 2.2 -0.2 0.0 -4.4 -0.3 -0.3 0.1 0.0 -0.1 -0.4 -0.1 -0.1 0.0
Investment 0.1 2.5 0.0 0.1 -4.3 0.0 -0.4 0.3 0.4 -0.1 -0.4 0.0 -0.1 0.1
Government 0.0 2.1 -0.3 0.0 -4.5 -0.3 -0.3 0.1 0.0 -0.1 -0.4 0.0 -0.1 0.0
Exports 0.0 3.5 -0.3 0.1 -10.1 -0.5 0.1 0.2 0.5 0.4 -0.1 -0.1 -0.2 0.1
Imports 0.2 4.7 -0.2 0.1 -9.1 -0.4 0.0 0.3 0.9 0.3 -0.2 -0.1 -0.2 0.1
Total 0.0 2.1 -0.2 0.0 -4.3 -0.2 -0.3 0.1 0.0 -0.1 -0.4 -0.1 -0.1 0.0
Imports 0.9 1.8 0.2 0.0 -5.1 2.2 0.2 0.3 1.7 0.1 -0.1 -0.1 -0.1 0.1
Total 0.4 1.0 0.1 0.0 -2.4 1.0 0.2 0.2 0.3 0.0 -0.2 0.0 -0.1 0.0
Scenario II- PARTIAL ELIMINATION OF QUOTAS ON CHINA 1/ Consumption India 0.4 China 1.0 Hong Kong SAR 0.1 Taiwan Province of China 0.0 Bangladesh -2.4 South Asia, other 1.0 Philippines 0.2 Korea 0.2 Indonesia 0.3 United States 0.0 Mexico -0.2 EU 15 -0.1 Rest of the World -0.1 Total 0.0 Source: Simulations using GTAP 6.0.
Investment 0.5 1.0 0.3 0.0 -2.4 1.5 0.5 0.3 0.8 0.0 -0.2 0.0 -0.1 0.0
Government 0.4 1.0 0.1 0.0 -2.5 1.0 0.2 0.2 0.3 0.0 -0.2 0.0 -0.1 0.0
Exports 0.8 1.5 0.1 0.0 -5.6 1.7 0.1 0.2 1.0 0.2 -0.1 -0.1 -0.1 0.1
1/ This scenario assumes a complete elimination of quotas for all countries except China. For China, it assumes a 50 percent reduction in quotas.
- 22 -
V. CONSTRAINTS ON THE TEXTILES AND CLOTHING SECTOR IN INDIA The opportunities unleashed by the removal of the quotas are tempered in India by domestic policy constraints and business environment. The absence of labor market flexibility, reservation of certain items for the small-scale sector until recently, and the absence of an effective exit policy are obstacles to achieving economies of scale. The failure to reap economies of scale in turn prevents the requisite investment. The lead time in India tends to be fairly long, and this is likely to dampen increases in market share as the current structure of the T&C industry gives significant importance to a short turnaround time. The lack of infrastructure and administrative hurdles, such as delays at customs and other red tape, and high tariffs further constrain India’s ability to maximize the gains from the abolition of the ATC quotas. Survey results confirm that significant constraints face the Indian T&C industry that may be preventing it from realizing its export potential. These are highlighted by two surveys conducted of 14 major T&C producers and global traders in 2000 and 2003 (Winters and Mehta 2003). The following seven factors influence investment and sourcing decisions in the T&C sector: politics and stability of the host country, quality of transportation and telecom in the host country, trade and investment policies, labor costs and policy, health and environment, and the lack of restrictions on capital transactions. A survey by the ExportImport Bank of India to estimate the magnitude of transaction costs of Indian exports revealed that although transaction costs have declined between 1998 and 2003, they still continue to impose significant costs in certain sectors of Indian exports.23 Among the leading export sectors, the study finds that the incidence of transaction costs is highest in textiles, resulting mainly from delays in receiving refunds (Reserve Bank of India 2004). The proximity of markets, bureaucratic impediments, and the poor infrastructure quality are also important constraints, especially in market segments that shift rapidly. In the absence of quotas, retailers will likely choose suppliers based on the reliability of delivery and short lead time (Birnbaum 2001, Tait 2002). It is estimated that an additional day in transport is equivalent to an extra 0.8 percentage point increase in applied tariff rates (Hummels 2001). China enjoys a 13 percent cost advantage in shipping garments from Shanghai to the U.S. East Coast, or in weighted terms an even larger advantage of 37 percent. In addition, delivery times from India are longer than from other comparator countries. The minimum delivery time (transportation alone) from India to the United States is 24 days compared to 18 days from Thailand, 15 days from China, 12 days from Hong Kong SAR and 3 days from Mexico (Winters and Mehta 2003). While geographic location might explain this partly, a major factor for the delays can be attributed to lower efficiency and smaller tonnage of berthing capacity at Indian ports. Moreover, India does not seem to compare favorably in terms of customs processing where the mean delay is 10.3 days, compared to 7 days in Korea and 23
The surveys covered 111 firms in 12 sectors in 1998, and 82 firms in 10 sectors in 2003.
- 23 Thailand. In addition, the price of industrial power is higher in India than in Mexico, Taiwan Province of China and Korea. The structure of the T&C industry in India is also a constraint. India’s T&C sector has been dominated by small producers,24 is fragmented, and there is little vertical integration in the apparel industry (USITC 2004). Indian manufacturers set up several small plants instead of a single large one, to take advantage of labor laws. Consequently, the Indian T&C sector loses out on reaping economies of scale and therefore a lack of investment to upgrade obsolete machinery .25 India’s exports in T&C have been characterized as low technology intensive. Thus, in a sector where India has a large share of exports, the technology intensity is low compared with many other competitors, where the improvement has been dramatic during the 1990s. The Technology Upgradation Fund Scheme for textiles and jute industries is a significant step in the process of modernization and technology upgradation of the textile industry in India.26 In addition, to prepare for a quota-free world, a few corporates have recently announced investment of 500 million (FitchRatings 2004). Other countries, such as China, have invested far greater amounts. While labor costs in India are one of the lowest in the world, these are offset by significantly higher prices for other inputs and low labor productivity. Survey results indicate that labor costs are not the major determinant for potential investors, implying that higher labor costs can be accepted if they are compensated by other factors. The labor cost per unit of production is higher due to the lower productivity of labor.27 A study by McKinsey and Company (2004) found that Indian exporters’ productivity was at 35 percent of U.S. levels. China scores a much more impressive 55 percent. This rise in productivity in China in the T&C sectors led to a growth in output of 37 per cent in the second half of the 1990s, while
24
Until 2001, most of the textile and clothing sector was reserved for the small-scale sector. The policy change allowing for de-reservation should help to form an integrated supply chain.
25
As a result, they have on average 10 to 20 percent of machines that Chinese plants have (McKinsey 2004). 26
The scheme provides a 5 percent interest reimbursement or 12 percent upfront subsidy on loans for investments in technology for specified sectors of the Indian textile industry. More than $1 billion has been disbursed under the scheme so far. However, many segments are yet to avail themselves of this fund as a majority of the loans have gone to the large mills.
27
Illustratively, compared to 20.6 women’s blouses that Hong Kong SAR manufactures per machine per day, India manufactures only 10.2. Similar figures for trousers for Hong Kong SAR and India are 19.3 and 16.8 and men’s shirts are 20.9 and 9.1.
- 24 the number of workers decreased by 27 percent . Furthermore, over time the textile industry has become less labor intensive, especially in weaving and processing.28 The quality of the T&C products also constrains Indian exports. A recent study (World Bank 2004) demonstrates some challenges to Indian industry including perceptions about the low quality of India’s T&C products and quality inconsistency of large cotton-based Indian textiles and clothing products. VI. TEXTILES AND CLOTHING SECTOR POLICY ENVIRONMENT IN INDIA The Indian government has focused on the textile sector with the aim of doubling India’s share in global textile trade by 2010 and to increase India’s textile exports to $50 billion from $13 billion currently. This echoed the government’s textile policy of end 2000 (see Box 1), which focused on strategic areas to strengthen the competitiveness of the textile industry. The focus was on facilitating technological upgradation, increasing the raw material base with emphasis on productivity and quality, encouraging human resource development, product diversification, innovative marketing, and ensuring adequate financing. An important policy change over the years has been the progressive dereservation of the garments sector from the small scale sector (see Box 2). The existence of a number of sectors under small-scale industry (SSI) had precluded investment and modernization in the past. This policy also contributed to the fragmentation in the supply chain in the T&C industry.29 Until the beginning of 2005, items in the knitting and hosiery sectors continued to be reserved for the small-scale sector.30 The investment in the textile industry remained low and stagnant between 2000 and 2003 at around $1 billion to $1.5 billion.31 The dismantling of the 28
A preliminary exercise by the RBI (RBI 2004), on the assumption of constant returns to scale, in a growth accounting framework, suggests a decline in total factor productivity growth (TFPG) of the textile sector in the 1990s. While capital intensity increased during the 1990s, growth in capital productivity in the textile sector declined during 1991-2000 vis-à-vis the previous decade. On the other hand, growth in labor productivity increased during the same period, but does not compare favorably with other countries. 29
Apart from spinning, the rest of the activities like weaving, processing, made ups, and garmenting are all found to be fragmented in India with consequential impact on quality and standardization. Only 3 ½ percent of total cloth production is from the organized sector and 12,000 of the 14,500 are hand processing units. Most of the garment exports are from SSI units because of the reservation policy in place until recently.
30
In the 2006 budget, 30 items under the category “Textile Products includes Hosiery” were dereserved from the SSI list. 31
In 2004, there was an increase to $2 billion, reflecting expansion and diversification (Economic and Political Weekly, December 4, 2004). According to a recent statement by the Union Textiles Minister, investments in the T&C sector increased to a little over $3 billion in 2004-05.
- 25 quota regime has led to a pick up in investment in all segments. In the long run, the Indian garment industry will have to be dominated by large firms to reap economies of scale. Foreign direct investment in this sector has been insignificant, although the government has allowed foreign equity participation up to 100 percent in the textile sector, except in the knitwear/knitting sector, which was still reserved for SSI until recently.32 Notwithstanding the funding that it would have brought in, India has missed the associated technology transfer. Until recently, the excise tax regime for the textile sector was not conducive to new investment. The budget for FY 2004-05 reduced the excise duties for yarn and fiber. However, blended textiles and pure noncotton textiles (polyester, viscose, acrylic, and nylon) continued to be subject to a different tax regime. In the 2005-06 budget, the excise duty on polyester filament yarn and polyester texturized yarn was reduced from 24 percent to 16 percent. With the man-made fiber textile sector accounting for a large share of trade, the rationalizing the taxation structure for this sector can strengthen competitiveness.33 The 2005-06 budget focused on investment in apparel parks, cluster development, cotton procurement, health and insurance, and technical skill development. It has proposed about $700 million for investment in the textile sector for the above purposes as well as for technology upgradation. VII. POLICY RECOMMENDATIONS While the Textile Policy of 2000 targeted exports of textiles and apparel at $50 billion by 2010, India’s exports reached $13 billion in 2003. Although, achieving this target seems doubtful, the dismantling of quotas at the end of 2004 put an end to the distortionary trade regime and presents an opportunity for competitive producers. The quotas had kept prices artificially high under the previous regime. In the future, prices will fall to market determined levels and growth will depend on enhanced efficiency. Specifically, in a competitive environment, success will depend on quality, price, delivery schedules, and marketing skills. So far, India’s performance seems to have been modest; however with further domestic reform, India may be able to increase its exports at a more rapid pace. The appropriate policy response and creating an enabling environment can help India increase its market share. The strategy should aim to overcome specific constraints that have been identified in the earlier sections such as low quality of products, fragmentation of the 32
Official sources presenting sector-wise recipients of foreign direct investment (FDI) does not give data on textiles, implying that FDI flows were not significant in this sector. This is despite the government allowing 100 percent FDI in this sector since 2001.
33
The website (http://www.txcindia.com) of the Office of the Textile Commissioner, Economic Research and Market Intelligence Unit, Ministry of Textiles, gives a comparative picture of the excise and customs duty structure of major items of the textile industry during the last five years.
- 26 industry, concentration on low- to medium-priced apparel, long time-to-delivery, delays in customs clearance, low level of technology, unfavorable trend in labor productivity as compared to some competitors, lack of scale economies, and high costs of inputs and branding. The Export Import Bank of India has called for sharpening of India’s competitive advantage by lowering the cost of operations through efficient use of production inputs and better integration of manufacturing processes, enhanced technology, foreign investment, improving the efficiency in logistics and supply chain management, and improving soft skills such as design capabilities. A coherent response would involve both increasing the volume of exports and upscaling its products. This section presents some sector-specific and general policies that could foster growth in this sector. In a large number of policy areas, the role of the government should be to create an enabling environment and remove obstacles, rather than creating a complex regulatory framework that will only hamper innovation and quick turnaround. Sector-specific policy initiatives could include the following:
34
•
Technological development will have a more dominant influence in the market in future (OECD 2004).34 It would be preferable for the government to enable the import of existing technology in addition to investing in research and development. International trends also point to the fact that most innovation in T&C are created in other industries. For example, new materials are developed in the chemical industry and new processes are developed in the machinery industry. The government should therefore concentrate on technology transfer and diffusion of innovation both globally and within the country.
•
To minimize lead times, India should further integrate the supply chain and develop strong textile clusters, capable of handling all stages of production in a coordinated manner. In particular, the weaving and fabric processing (dyeing and finishing) sector, considered to be the weakest link in the supply chain due to inadequate investment and lack of technology, should be strengthened. There needs to be integration from weaving to garment making to reduce lead time, cut costs, and improve quality. The problem arises from the small scale of operation of this sector, resulting from the tax incentives favoring them. Foreign investment and transfer of technology would help the industry to be more technology savvy and improve quality and productivity. However, it would be preferable if the integration of the supply chain occurs in tandem with reducing the tariffs to source from the most efficient producer, domestic or foreign.
International experience shows that technological innovation has progressed in all levels of the supply chain from weaving to processing, to designing, packaging, patternmaking, cutting, inspecting, pressing, and packaging. Inroads have been made in the labor-intensive core of clothing manufacturing process.
- 27 •
Focus on manufacturing high-quality and defect free processed fabric.35 Noncost factors are also becoming important, particularly for brand name and eco-labeled products. Greater emphasis should be placed on quality certification and branding.
•
While increasing productivity in cotton, capacity in man-made fibers needs to be enhanced. While India is one of the largest producers of cotton yarn and fabric, the productivity of cotton as measured by yield is lower than in many countries, including China, Turkey and Brazil.36 Market share has shifted to manmade fibers, and India needs to increase capacity and technology in this subsector.37 Since it is not clear whether the shift in fashion to man made fiber is cyclical or structural in nature, efforts to improve the productivity and quality of cotton, which is India’s core strength should continue.
•
Developing services-related expertise in designing, marketing, retailing, financing and the gathering of market intelligence on foreign markets. To this end FDI flows should be encouraged. India has not permitted FDI in the retail segment, but to begin with, it may be appropriate to permit FDI in retail distribution services for textiles and clothing.38
•
Making greater inroads into the area of upscale high-fashion and highly customized clothing segment. Extensive use of computer-aided design (CAD) and computeraided manufacture (CAM) systems will aid innovation and enhance competitive efficiency by reducing the lead time.
•
Greater emphasis on training to offer service-related skills and integrated solutions to prospective buyers. The plan by some state governments to set up training institutes to upgrade skills of personnel is noteworthy and should be emulated by other states.
35
Goldman Sachs (2004) recently surveyed about 30 major wholesalers, manufacturers, and retailers globally to examine the impact of the elimination of textiles and apparel import quotas in 2005. Both U.S. and EU respondents cited product quality as the top consideration in sourcing decisions post quota elimination, followed by product cost, production speed, working conditions, access to inputs, transportation speed, political stability, transportation cost, and geographical diversity. 36
The government is rightly focusing on technology to play a lead role in improving productivity. 37
The share of cotton in world fiber demand declined from around 50 percent in the early 1990s to around 38 percent in 2003, while the share of man-made fiber has increased from 44 percent to 60 percent. 38
In China, foreign retailers will have the right to set up distribution networks through wholly owned foreign enterprises, without any geographical or quantitative restrictions.
- 28 -
Technical textiles39 represent a significant proportion of the total textile activity in the world.40 It is estimated that technical textiles are growing at roughly twice the rate of textiles for clothing applications and now account for more than one-half of total textile production in the world (OECD 2004). The current growing demand is for geotextile, civil engineering markets, and environmental protection applications. Although non-wovens account for the bulk of the demand, there is increasing interest in composite fabrics. There is a huge market for packaging, sports textiles, medical and hygiene textiles, and military textiles, which fall under the definition of technical textiles. As the production of technical textiles requires expensive equipment and more skilled labor, India should encourage diversification of established textile firms to capture this growing market.
•
•
There is need to forge business contacts between domestic clusters and retail groups. The growth of retailers have shifted the market power from producers to retailers.41
Some general policy prescriptions to reduce the lead-time and improve time-to-delivery of products to retailers could include: •
Enhancing the reliability of transport and improving turnaround time of ships. More firms internationally are expected to use air freight to tighten inventory and shorten delivery time, even if transport costs are higher. The apparel industry is estimated to be one of the fastest growing air freight markets between 2004-2009. There might be scope for greater use of air freight for garment exports. A policy approach of setting small textile cluster-linked airports with emphasis on freight and business traffic (like Canary Wharf in London) could be an option in the medium term until ports and other capacities are enlarged.
39
Technical textiles are nonclothing items used in aerospace, marine, medical, civil engineering, and other industrial applications (USITC). They are defined by their performance properties. Some studies identify this segment as having the greatest growth potential. The United States and Europe continue to be the major markets for technical textiles. Transportation and clothing components had the highest market share in early 2000, but the growth in these segments have flattened with their maturing. 40
The estimated worldwide consumption of technical textiles by the end-use market in 2000 was $60 billion and grew by an estimated 4 percent since then until 2005 (Chang and Kilduff 2002).
41
Through use of technology, retailers are able to monitor their sales more efficiently and reduce their inventory. The recent trend is for retailers to place more frequent small orders and shorter time lags.
- 29 •
Improving the infrastructure and removing the inefficiencies in the power sector leading to a high cost of power. Specifically, in the T&C sector this can be done by ensuring dedicated power delinked from State Electricity Boards, and better quality of power in textile parks.
•
Increasing the efficiency in customs procedures. These could include streamlining the administrative requirements to clear customs and expedite the customs procedures, computerizing customs, etc.
•
Increased labor market flexibility is required to enable the setting up of mega production plants similar in scale to those in China. VIII. CONCLUSIONS
The dismantling of the quota presents an opportunity for India to increase its global export market share. We analyze the impact of the quota elimination on India using GTAP 6. In addition to examining the impact of the full removal of the quotas as is standard, we also analyze the impact of the removal in the presence of safeguards on China. The results of the simulations do not present an optimistic scenario for India in terms of export growth of T&C in a quota-free world (Scenario I). They also show that Indian exports of T&C will continue to expand in the presence of the safeguards on China, but will be adversely affected once these are lifted (Scenario II), essentially providing India’s T&C industry some respite until 2008, when all safeguards on China will be lifted. It appears that in the face of falling prices, Indian industry needs to become more competitive. Most of the domestic reforms in India’s T&C sector took place after 2000, with substantial policy initiatives in 2004. The impact of these policy changes of the last few years in the T&C sector would produce results after a lag. India could emerge much stronger and expand its trade in textiles and apparel at a much faster pace if the some of the key weaknesses are overcome.
- 30 -
Box 1. India. Targets of the National Textiles Policy (2000) •
Achieve the target of textile and clothing exports from the 2001 level of $11 billion to $50 billion by 2010 of which the share of garments will be $25 billion.
•
Implement, in a time-bound manner, the Technology Upgradation Fund Scheme (TUFS) covering all manufacturing segments of the industry.
•
Achieve increase in cotton productivity by at least 50 percent and upgrade its quality to international standards, through effective implementation of the Technology Mission on Cotton.
•
Launch the Technology Mission on Jute to increase productivity and diversify the use of this environment-friendly fiber.
•
Assist the private sector to set up specialized financial arrangements to fund the diverse needs of the textile industry.
•
Set up a venture capital fund for tapping knowledge-based entrepreneurs of the industry.
•
Encourage the private sector to set up world class, environment-friendly, integrated textile complexes and textile processing units in different parts of the country.
•
Dereserve the garment industry from the small scale industry sector;
•
Strengthen and encourage the handloom industry to produce value-added items and assist the industry to forge joint ventures to secure global markets.
•
Redesign and revamp, during the Tenth Five-Year Plan, the schemes and programs initiated in the handloom, sericulture, handicrafts, and jute sector to ensure better returns for those belonging to the disadvantaged categories, and the North East and other backward regions of the country.
•
Facilitate the growth and strengthen human resource development institutions, including the National Institute of Fashion Technology on innovative lines.
•
Review and revitalize the working of the Textile Research Associations to focus research on industry needs.
- 31 Box 2. Steps Taken by the Indian Government to Enhance Competitiveness • • • • • • • • • • • • • •
Dereservation of woven readymade garment, and hosiery and knitted products from SSI sector. Allowing foreign equity participation up to 100 percent through automatic route in this sector with certain exceptions. Adoption of cluster development approach for the production and marketing of handloom products, initially to take up to 20 clusters. Introduction of the Technology Upgradation Fund Scheme (TUFS) to facilitate the modernization and upgradation of the textile sector. 10 percent capital subsidy for the textile processing sector under TUFS. Launch of hi-tech weaving and processing for modernizing power loom sector. Launch of Cotton Technology Mission for boosting productivity and quality of cotton. Launch of a program to induct 50,000 shuttleless looms and to modernize 250,000 power looms in the decentralized sector by 2004. Rationalization and progressive reduction of the excise duty structure in the textile sector. Import of textile machinery items and raw materials and parts for manufacture of such machinery at concessional customs duty to reduce the cost of production. Introduction of a debt-restructuring package for organized textile mills. Focus on health and life insurance for weavers and technical skill development. Plans for massive investment in the textile sector. Banks to issue guarantees or standby letters of credit in respect of external commercial borrowings raised by textile companies for modernization or expansion of textile units. Launch of the Scheme for Integrated Textile Parks (SITP) to provide the industry with infrastructure facilities on the basis of public private partnerships.
- 32 -
APPENDIX
Appendix Policy Responses by Other Countries Some countries, including China (see Box 3), used the 10-year phase-out period to formulate effective strategies for the post-quota regime. Actions taken by other governments have been in the form of financial support, trade facilitation measures such as reduction in customs duty, encouraging joint ventures with foreign companies, restructuring the textile sector, removing constraints on foreign investment, and improving infrastructure among others. As noted previously, many countries have already entered into agreements with United States, Canada and the EU, which accords them preferential treatments. It would be helpful to analyze what others have done to draw some lessons for India.42 Pakistan’s Textile Vision 2005 is aimed at making its textile industry internationally integrated and competitive. Approximately $2 billion has been invested in the last three years for restructuring the textile industry. Policy changes under way include a draft law to standardize cotton, rationalize cotton trading, and encourage forward trading in cotton (World Bank 2004). Pakistan is also increasing the share of man-made-fibre-based products by expanding the raw material base for this sector. A textile city is proposed in Karachi and may be replicated in other cities. On the simplification of customs procedures, Pakistan recently introduced 24-hour clearing of goods with only a small fraction of shipments to be physically examined. The government is also planning to focus on high value-added products for exports. The Philippines has developed an Industry Transformation Plan focused on improving productivity through investment in technology and skill upgrading by the provision of finance. In addition the government plans to increase the speed of marketing, developing and promoting diversified products, with a shift to penetrating the high-end market for apparel. The Philippines has also implemented social responsibility in manufacturing. Under this program, garment exporters are mandated to follow internationally accepted labor standards in manufacturing to meet the demands of the market for “clean clothes”, i.e., free of child labor. There has also been a continuous streamlining of export and import procedures designed to improve the speed to market capability. Procedural simplifications include the new electronic visa system (since September 2002) and the integration of garments and textiles forms. On the tax side, incentives to investors include income tax holidays, additional deduction for incremental labor expenses during the first five years from registration, tax and duty exemption on imported spare parts when brought in through the firm’s own bonded manufacturing warehouses, the unrestricted use of consigned equipment, and tax credits for imported raw materials used for exported products (Garments and Textiles Export Board 2002). Investments are strongly encouraged in the areas of manufacturing, dyeing, printing, and finishing to promote competitiveness.
42
Other studies (Appelbaum 2004, Oxfam 2004, World Bank 2004, Spinanger and Verma 2003) have also documented policy actions taken in other countries.
- 33 -
APPENDIX
In Bangladesh, a number of schemes have been instituted over the years to mitigate the supply constraints in the ready-made garment sector and encourage capacity building. These include duty drawback schemes, duty-free imports of raw materials, and reduced corporate tax rates for the ready-made garment industry until June 2006. In addition, a cash compensation scheme for domestic suppliers to export oriented ready-made garment units equivalent to 10 percent of the value added of exported garments has been put in place (Mlachila and Yang 2004). The government is also focusing on upgrading its port, restructuring the energy sector, and facilitating training and marketing programs. The restrictions on FDI in the ready-made garment sector outside the Export Processing Zones have recently been removed. The government is also lobbying for duty-free access for readymade garment exports to the U.S. market. The Sri Lankan government has also focused on penetrating the higher end apparels market. It has offered many incentives to the garment industry in the 2005 budget. Exemptions from the VAT were extended to the import of textiles and ancillary inputs for garment manufacturers and on garment buying offices, which facilitate overseas buyers to place their orders with Sri Lankan manufacturers. The budget also proposed the setting up of an industrial park. The government also pledged funds for productivity improvement measures in the apparel industry and for international image building campaigns. However, in moving up the value-added chain, the government has imposed a tax on garments to fund technological skills upgrading in the industry (Appelbaum 2004). The textile industry of Taiwan Province of China is renowned for its innovations in garment manufacturing and the high quality of its products. Some recent innovative products include infrared, UV protective, electromagnetic shielding, breathable-waterproof, and anti-static textile garments. The competitive advantages of Turkey’s textile and apparel industry stems from a large variety of designs and colors, quick response, fine workmanship and packing, and efficient delivery. The apparel and cotton cloth industry has been receiving incentives to the tune of over 10 percent of the total incentives allocated by the government. These incentives are available for projects that reduce inequality among regions, spread capital ownership, create employment, make use of advanced technology, and increase competitiveness. They are in the form of investment allowance, tax exemptions including import duties, levies, and VAT on the purchase of machinery and equipment, and credits from an investment fund. The industry also attracts significant foreign investment.
- 34 -
APPENDIX
Box 3. China’s Plans for the Textile and Clothing Sector •
Foreign exchange income from textile and apparel exports targeted to increase from $52 billion in 2000 to $70-75 billion in 2005.
•
Labor productivity to record a 40 percent increase over 2000 in 2005.
•
The contribution rate of technological progress to reach over 50 percent in 2005.
•
Energy consumption per 10,000 yuan worth of output will fall by 15 percent in 2005 against 2000.
•
Recycling rate of water in the textile dyeing and printing industry will reach around 30 percent; water consumption of dyeing and printing per 100 meters of fabric will drop from 3.6 to 3 tons.
•
Keep up with the international development trend of new technology and restructure the traditional industry by using advanced, new technologies.
•
Renovate the capacity of 10 million spindles together with looms; raise the quality of wool fabric and develop high-count yarn and light and thin products; increase the proportion of high-class fabric to 70 percent; develop new types of composite fibers with silk as the main content; and develop new types of knitted products.
•
Focus on the research and development of 40 kinds of textile machineries in the areas of chemical fibers, yarn spinning, weaving, knitting and dyeing, and finishing; a breakthrough in the development of 36 key manufacturing technologies; electronics technology will be applied extensively to raise the level of tech-electronic integration.
•
Emphasize the development of brand apparel, children’s apparel, garments for middle-aged and old people, and special garments; research and development of ecological, health-care garments; development of garments suitable for rural consumption to adapt garment making to the multilayered consumption demands of the domestic market, and expanded exports.
- 35 REFERENCES American Textiles Manufacturers Institute, “The China Threat to World Textile and Apparel Trade,” available via the Internet at www.atmi.org. Appelbaum, Richard, 2004, “Assessing the Impact of the Phasing-out of the Agreement on Textiles and Clothing on Apparel Exports on the Least Developed and Developing Countries,” Institute for Social Behavioral and Economic Research, Center for Global Studies, University of Santa Barbara. Avisse, Richard, and M. Fouquin, 2001, “Textiles and Clothing: the End of Discriminatory Protection,” La Lettre du CEPII, No. 198. Birnbaum, David, 2001, “The Coming Garment Massacre,” available via the Internet at juststyle.com. Cerra, Valerie, Sandra A.Rivera, and Sweta Chaman Saxena, 2005, “Crouching Tiger, Hidden Dragon: What Are the Consequences of China’s WTO Entry for India’s Trade?” IMF Working Paper 05/101, (Washington: International Monetary Fund). Chang, Woon, and Peter Kilduff, 2002, “The US Market for Technical Textiles,” Small Business Technology Development Center (SBTDC), Technical Textiles Industry Study, North Carolina, USA. Economic and Political Weekly, December 4, 2004, “Trends in Total Investment by Industries.” Export Import Bank of India, 2005, “Textile Exports : Post MFA Scenario, Opportunities and Challenges,” Working Paper Series No. 9, February, Mumbai. Fitch Ratings, 2004, “Dismantling of Quotas : India to Benefit.” Francois, J.F., B. McDonald, and H. Nordstrom, 1994, “The Uruguay Round: A Global General Equilibrium Assessment, CEPR Discussion Paper, (London : Centre for Economic Policy Research). Francois, J.F., H.H. Glisman, and D. Spinanger, 2000, “The Cost of EU Trade Protection in Textiles and Clothing,” Kiel Institute of World Economics Working Paper 997. Francois, J. F. and D. Spinanger, 2001, “With Rags to Riches but then what? Hong Kong’s T&C Industry vs. the ATC and China’s WTO Accession,” Fourth Annual Conference on Global Economic Analysis Paper. Garments and Textiles Export Board, Department of Trade and Industry, 2002, “The Philippines Garments and Textile Industry,” December 31. Goldman Sachs, September 2004, “Textile, Apparel and Footwear, 2005 Quota Elimination Survey Results.”
- 36 Government of India, 2005, Union Budget 2005-06, New Delhi. Government of India, Various Years, Ministry of Textiles, Annual Report, New Delhi. Hummels, David, 2001, “Time as a Trade Barrier,” Purdue University, July, Unpublished. International Monetary Fund and World Bank, 2002, “Market Access for Developing Country Exports- Selected Issues, ” available via the Internet at www.imf.org/external/np/pdr/ma/2002/eng/092602.pdf Kathuria, Sanjay, and Anjali Bhardwaj, 1998, “Export Quotas and Policy Constraints in the Indian Textile and Garment Industries,” mimeo World Bank. Kathuria, Sanjay, Will Martin, and Anjali Bhardwaj, 2001, “Implications for South Asian Countries of Abolishing the Multifiber Agreement,” World Bank Policy Research Working Paper 2721. Lankes, Hans Peter, 2002, “Market Access for Developing Countries,” Finance and Development. Manole, Vlad, 2005, “Winner or Loser ? Effects of Quota Abolition in World Markets for Textile and Apparel,” World Bank DECRG mimeo. McKinsey, 2004, Apparel and Textile Trade Report. Mlachila, Montfort, and Yongzheng Yang, 2004, “The End of Textiles Quotas: A Case Study of the Impact on Bangladesh,” IMF Working Paper 108, (Washington:International Monetary Fund). Nordas, H.K., 2004, “The Global Textile and Clothing Industry Post the Agreement on Textile and Clothing,” World Trade Organization. Nyugen, T.T., C Peroni and R.M.Wigle, 1993, “An Evaluation of the Draft Final Act of the Uruguay Round,” The Economic Journal 103:pp. 1509-49 Organization for Economic Co-operation and Development, 2004, A New World Map in Textiles and Clothing – Adjusting to Change, Paris. Reinert, K.A., 1993, “Textile and Apparel Protection in the United States: A General Equilibrium Analysis,” World Economy, pp 359-376 Reserve Bank of India, 2004, Report on Currency and Finance, 2002-03, Mumbai. Spinanger, Dean and Samar Verma, 2003, “The Coming Death of the ATC and China’s WTO Accession: Will push come to shove for Indian T &C Exports?” Bridging the Differences – Analyses of Five Issues of the WTO Agenda, ed. by Alan Winters and Pradeep S.Mehta, 2003, CUTS, Jaipur, India.
- 37 Tait, Beverly, 2002, “Towards 2005: the Survival of the Fittest,” just-style.com. Terra, M.I., 2001, “Trade Liberalization in Latin American Countries and the Agreement on Textiles and Clothing in the WTO,” Paper Presented at the Conference on the Impact of Trade Liberalization Agreements in Latin America and the Caribbean, Inter-American Development Bank. Trela, I. and J. Whalley, 1990, “Global Effects of Developed Country Trade Restrictions on Textiles and Apparel,” Economic Journal, Vol. 100, pp 1190-1205. , 1995, “Internal Quota Allocation Schemes and the Costs of the MFA,” Review of International Economics, 3(3), pp. 284-306. UNCTAD, 2004, Trade and Development Report, 2003, Geneva. US International Trade Commission, 2004, “Textiles and Apparel: Assessment of the Competitiveness of Certain Foreign Suppliers to the US Market.” Winters, Alan, and Pradeep S. Mehta, 2003, In Bridging the Differences – Analyses of Five Issues of the WTO Agenda, CUTS, Jaipur, India. World Bank, 2004, Trade Policies in South Asia: An Overview, Report No.29949, September 7. World Trade Organization, 2002 and 2003 and 2004, International Trade Statistics, Geneva. Yang, Y., 1994, “Trade Liberalization and Externalities: A General Equilibrium Assessment of the Uruguay Round,” Australian National University (Unpublished). , W. Martin, and K. Yanagishima, 1997, “Evaluating the Benefits of Abolishing the MFA in the Uruguay Round Package,” in Global Trade Analysis: Using the GTAP Model, ed. by Thomas Hertel (Cambridge University Press)