The Changing Status of Women in Asian Societies
Economic, social, and political developments in Asia have brought with them profound changes in the status of women. In general, women’s conditions have improved with economic development and social and political change that favors equality and individual rights. At the same time, cultural traditions, especially those related to family life, continue to have a strong influence on the status of women in the region. Until recently in most Asian countries, few women attended secondary school or university, and few worked outside the home. Over the past 50 years, larger and larger proportions of women have completed primary and secondary school. The proportion of women attending university, although much smaller, is also growing. More recently, women have started taking up paid employment in greater numbers, particularly in the manufacturing, clerical, and service sectors. Over the past 50 years, women’s life expectancy has improved across the region, overtaking men’s life expectancy in nearly all countries. Yet during early childhood, girls are still more likely to die than boys in some Asian countries, while in other countries, unusual birth rates for boys and girls in recent years point to the prevalence of sex-selective abortion.
Education levels improving
Rates of change have varied, but education and employment opportunities have improved for women and girls across the region (Kuala Lumpur, Malaysia) © Stuart Franklin/Magnum
Primary school education is nearly universal in many countries of East and Southeast Asia—both for boys and for girls. Women’s enrollment in secondary school has increased dramatically since the 1960s throughout the region, and, in many countries, the traditional gender gap in secondary school enrollment is gradually disappearing. In Asia as a whole, 14 percent of girls age 15 to 19 were enrolled in school in 1950; by 1990, this proportion had risen to 26 percent (Xenos, Kabamalan, and Westley 1999). East Asia had the highest levels of school enrollment for this age group and the greatest increase over the 40-year period—from 36 percent in 1950 to 74 percent in 1990. In Southeast Asia, the enrollment rate for girls age 15 to 19 increased from 12 percent in 1950 to 34 percent in 1990. In South Asia, enrollment rates have been much lower, but the trend is similar—from 8 percent in 1950 to 16 percent in 1990. Table 1 shows trends in female secondary and tertiary school enrollment from 1975 to 1995 for 20 Asian countries. By the mid-1990s, more than 60 percent of girls of secondary-school age were attending school in all East Asian countries plus Malaysia, the Philippines, and Singapore in Southeast Asia and
41
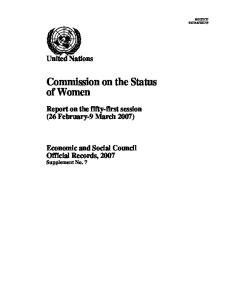
Sri Lanka in South Asia; 30 to 60 percent were attending secondary school in India, Indonesia, Myanmar, Nepal, Thailand, and Vietnam; and fewer than 30 percent were attending secondary school in Cambodia, Laos, Afghanistan, Bangladesh, and Pakistan (UNESCO 1999). In some Asian countries, women’s secondary-school enrollment is steadily catching up with enrollment levels for men. In South Korea, Thailand, and Hong Kong, secondary-school enrollment is nearly the same for both sexes, while in the Philippines enrollment is slightly higher for women. Yet in many countries, substantial gender gaps remain, especially in South Asia. Figure 1 shows trends in three countries that exemplify these patterns—South Korea, the Philippines, and India. Women are much less likely to attend college or university than they are to attend secondary school (Table 1). In most Asian countries, they are also much less likely to attend college or university than are men (UNESCO 1999). In South Korea, for example, 38 percent of women in the appropriate age group were enrolled in university in 1995, compared with 66 percent of men. In India, 5 percent of university-age women were enrolled, compared with 8 percent of men. Thailand and the Philippines are exceptions with unusually high university enrollment rates for women. In Thailand, 20 percent of university-age women were enrolled in 1992, compared with 17 percent of men. In the Philippines, 33 percent of women were enrolled in 1995, compared with 25 percent of men.
120
100 Percentage of age group in school
Figure 1. Percentage of all girls and boys at secondary-school age enrolled in secondary school: South Korea, Philippines, and India, 1970–95
South Korea boys South Korea girls
80 Philippines girls 60
Philippines boys
40
India boys
India girls
20
0 1970
1975
1980
1985
1990
Year
Source: UNESCO (1999). Note: The percentage enrolled can be more than 100 if girls and boys outside the normal age range are also enrolled in school.
42
The Future of Population in Asia
1995
Table 1. Trends in female secondary and tertiary enrollment in 19 Asian countries and Hong Kong: Percentage of girls in the appropriate age groups who were enrolled in 1975, 1985, and 1995
Country
1975 Secondary Tertiary
1985 Secondary Tertiary
1995 Secondary Tertiary
East Asia China
38
0
33
2
62
4
Hong Kong SAR
47
5
73
NA
76
20
Japan
92
17
96
20
104
36
Mongolia
83
8
95
28
68
21
South Korea
48
5
91
21
101
38
Southeast Asia Cambodia
5
NA
19
NA
20
1
Indonesia
15
NA
35
NA
48
8
5
NA
19
1
21
2
Malaysia
39
NA
53
5
63
NA
Myanmar
20
NA
22
5
30
7
Philippines
54
19
65
26
78
33
Singapore
53
7
61
10
70
31
Thailand
22
3
28
NA
37
20
Vietnam
41
1
41
NA
46
NA
Laos
South Asia Afghanistan
2
0
5
NA
11
NA
Bangladesh
NA
1
11
2
13
1
India
16
2
26
4
38
5
Nepal
4
NA
12
1
30
3
Pakistan
7
1
10
1
17
2
Sri Lanka
49
NA
66
3
78
4
Source: UNESCO (1999). Notes: Reference years for individual countries may vary slightly from those indicated. The percentage enrolled can be more than 100 if girls outside the normal age range are also enrolled in school. NA: Data not available.
The Changing Status of Women in Asian Societies
43
Better employment opportunities Over the past half-century, women’s participation in the labor force has increased steadily in many Asian countries, particularly in the rapidly growing economies of East and Southeast Asia (Figure 2). Singapore is a clear example. There, rapid industrialization generated a strong demand for labor, but few could be drawn from the countryside because the agricultural sector was already small. Thus economic growth relied in large measure on women’s movement into the labor force. About 22 percent of women age 15 to 64 were employed in 1957 (Bauer 2001), rising to 55 percent by 1999 (ADB 2001). In Thailand at the beginning of industrialization, women were already widely employed in agriculture, so their overall employment rates have not gone up. However, many have moved from agriculture into other sectors of the economy. In South Korea, women’s employment levels have gone up steadily since about 1980, while in Taiwan, women’s employment stagnated during the 1990s with economic setbacks in Asia. In 1999, half or more of women age 15 to 64 were employed in all sectors, including agriculture, in nine Asian countries (ADB 2001). These were: ■
■
■
80 Thailand
70 60 Percent in labor force
Figure 2. Labor force participation rates (percent) for women age 15 to 64 years: Thailand, Singapore, South Korea, and Taiwan, 1970–99
East Asia: China (74 percent), Mongolia (66 percent), and South Korea (53 percent) Southeast Asia: Cambodia (65 percent), the Philippines (53 percent), Singapore (55 percent), and Thailand (68 percent) South Asia: Bangladesh (56 percent) and Pakistan (86 percent)
Singapore
50 South Korea
40
Taiwan
30 20 10 0 1970
1980
1990 Year
Source: Bauer (2001) and ADB (2001). Note: Reference years for individual countries may vary slightly from those indicated.
44
The Future of Population in Asia
1999
In addition to women’s traditional employment in agriculture, some have argued that Asia’s labor-intensive, export-led industrialization drives would not have been possible without the participation of women. In developing countries, it is common for women to work as unpaid family labor with little or no direct income or other benefits of employment. Mason (1995) considers this a form of employment “that is least likely to yield power or control over resources.” In many Asian countries, economic development and gains in education have increased opportunities for women seeking paid employment outside the home. Although direct information on women’s control over their earnings is rarely available, the expansion of opportunities to earn wages outside the family environment can probably be viewed as a gain in women’s status. The distribution of workers in three employment categories—paid employee, self-employed, and family worker—provides an indication of what types of employment opportunities are available for women. In Japan, more than eight out of 10 women who work are employed for wages, while only one out of 10 works as unpaid family labor (Figure 3). In Bangladesh, by contrast, fewer than one in 10 women works for wages, and nearly eight out of 10 work as unpaid family labor. Women’s employment status in South Korea and Sri Lanka falls in between these two extremes. In all four countries, men are much less likely than women to be employed as unpaid family labor. The distribution of women’s and men’s employment between these three categories in more- and lessadvanced economies suggests a decline, but not a disappearance, of gender inequality in Asia’s labor markets. In the rapidly growing economies of East Asia, the most dramatic change in women’s employment has been the decline in agricultural employment and the
Employee
Family worker
Unclassified
100 90 80 70 60 Percent
Figure 3. Percentage of economically active women and men who are paid employees, selfemployed, and unpaid family workers: Japan (1999), South Korea (1999), Sri Lanka (1995), and Bangladesh (1996)
Self-employed
50 40 30 20 10 0 Women Men Japan
Source: ILO (2000).
Women Men South Korea
Women Men Sri Lanka
Women Men Bangladesh
The image that appears here in the printed version of this publication was not made available for use on the internet.
Table 2. Percentage of employed women by occupational category: Japan, Taiwan, South Korea, Singapore, and Thailand, various years Country and year
Agriculture
Clerical
Industrial
Sales/ Service
Professional/ Managerial
1960
43
10
21
21
5
1970
26
18
25
24
7
1980
14
24
25
27
11
1990
8
27
26
26
12
1999
6
29
22
26
15
Japan
Changes in the types of positions
Taiwan
open to women suggest a decline,
1980
18
17
38
21
6
but not a disappearance, of gender
1990
10
23
31
27
9
inequality in Asia’s labor markets (Phnom Penh, Cambodia)
South Korea
© Kevin R. Morris/Corbis
1970
60
3
15
20
0
1980
46
9
20
22
4
1990
27
16
21
28
9
1999a
12
8
26
49
4
1957
12
6
25
45
10
1970
3
17
31
34
15
1980
1
27
35
24
12
1990
0
27
26
29
16
1999
0
19
26
40
14
1960
86
0
4
8
1
1970
84
1
5
9
2
1980
73
1
8
11
3
1990
65
3
12
16
4
Singapore
Thailand
Sources: ILO, Yearbook of labor statistics, various years; ILO (1990); Bureau of Statistics [Republic of China] (1991). a ILO statistics for South Korea were revised on the basis of the 1995 population census.
The Changing Status of Women in Asian Societies
47
Some have argued that Asia’s laborintensive industrialization would not have been possible without the participation of women (South Korea) © Anna Clopet/Corbis
rise in office and clerical positions. In Japan, for example, the proportion of working women engaged in agriculture dropped from 43 percent in 1960 to only 6 percent in 1999 (Table 2). Over the same period, the proportion engaged in clerical work rose from 10 to 29 percent. While the proportion of working women who hold professional and managerial positions has increased in recent decades, it is still quite low. Between 1960 and 1999, the proportion of working women holding such relatively well-paid positions rose from 5 to 15 percent in Japan, for example, and from 0 to 4 percent in South Korea. Women in an economically advanced economy such as South Korea tend to be heavily employed in the clerical, sales, and service sectors and in manufacturing (Figure 4). By contrast, women’s employment in Bangladesh is overwhelmingly in the agricultural sector. Even in South Korea, however, women’s employment in the most highly paid professional and managerial category is small, at only 4 percent. The Philippines is exceptional, with 12 percent of economically active women in the professional and managerial category as well as large proportions in clerical, sales, and service (50 percent) and in industry (11 percent). This pattern undoubtedly reflects the relatively low levels of discrimination against women in the Philippines. Within the manufacturing sector, women have been heavily concentrated in
The image that appears here in the printed version of this publication was not made available for use on the internet.
Professional/managerial
Clerical/sales/service
Industrial
Agricultural
100 90 80 70 60 Percent
Figure 4. Percentage of economically active women and men working in the professional/ managerial, clerical/sales/service, industrial, and agricultural sectors: South Korea (1999), Bangladesh (1996), and the Philippines (1999)
50 40 30 20 10 0 Women Men South Korea
Women Men Bangladesh
Women Men Philippines
Source: ILO (2000).
low-wage, labor-intensive industries. In 1999, wages for Japanese women employed in manufacturing were on average 58 percent of the wages for men (ILO 2000), up from 42 percent in 1989. In South Korea, women in manufacturing earned 55 percent of men’s wages (up from 51 percent in 1989). In Southeast Asia during the late 1990s, women’s wages were 74 percent of men’s in the Philippines, 68 percent in Thailand, 63 percent in Malaysia, and 59 percent in Singapore. Although the wage gap is narrowing in some countries, there is no consistent trend. During the industrial restructuring of the 1980s, women suffered disproportionately from losses in manufacturing jobs. In Taiwan, for example, manufacturing employment declined by 364,000 jobs between 1987 and 1990, and 58 percent of the workers who lost their jobs were women. The question arises whether women will be similarly disadvantaged in future periods of economic readjustment.
Improving life expectancy Life expectancy at birth is one of the most basic indicators of health and wellbeing (Mason 1995). Although life expectancy does not capture all aspects of health, it is a widely available measure that makes it possible to compare the health status of various groups (in this case, women and men) across countries and time periods. Life expectancies are improving all across Asia, but longevity still varies widely between subregions and countries (Appendix Table 3). Survival is generally
The Changing Status of Women in Asian Societies
49
lowest in South Asia and highest in East Asia, particularly in the region’s most advanced economies. In most countries, the gains over the past 50 years have been greater for women than for men, as indicated by the female-male differences at the right of Appendix Table 3. By 2000, women could expect to live longer than men, on average, in every major country of the region except Nepal and Pakistan. In East Asia, where the risks of dying in infancy and childhood have been low for some time, women’s gains in life expectancy are associated with population aging and the greater inherent frailty of men (Mason 1995). In South Asia and parts of Southeast Asia, by contrast, women’s gains in life expectancy most likely represent real improvements in nutrition and healthcare for women and girls. In societies where women live longer than men, improvements in women’s life expectancy come at a cost, however. As women survive their husbands and live into old age as widows, issues of financial support, medical care, and companionship become critical for families and national governments alike. As a recent report from the United States Census Bureau points out, “. . . Women are expected to make up the majority of the world’s elderly population (particularly at the oldest ages) well into the next century. Continuing or growing disparities in sex ratios mean that many of the challenges and problems faced by the elderly of today and tomorrow are, in essence, challenges and problems faced by older women” (Kinsella and Velkoff 2001). Nowhere is this more true than in Asia.
Persistent high mortality for young girls Despite improvements in life expectancy for adult women, in some South and East Asian countries girls are more likely to die than boys between the ages of 1 and 4 years. Among children in this age group, mortality is normally slightly higher for boys. In Bangladesh, India, and Nepal, however, girls age 1 to 4 years are much more likely to die than boys (Figure 5). This unusual mortality pattern reflects a preference for sons within some Asian families. During the 1990s in India, mortality rates at ages 1 to 4 years were nearly 50 percent higher for girls than for boys (IIPS and ORC Marco 2000). In northern India, where son preference is particularly strong, girls in this age group are 74 percent more likely to die than boys (Arnold, Choe, and Roy 1998). More than 10 years of demographic data from Bangladesh’s Matlab region show that mortality at ages 1 to 4 years is strongly affected by a child’s sex and the sex of older siblings: The highest death rates are for girls with older sisters. In South Asian countries, son preference may not only increase death rates for girls but may also impede national efforts to lower fertility (see box). How does son preference result in higher mortality for girls? Among South Asian families with limited resources, boys may receive more food than girls, better care to prevent diseases and accidents, and better treatment when they
50
The Future of Population in Asia
IS SON PREFERENCE SLOWING DOWN INDIA’S TRANSITION TO LOW FERTILITY?
of gender preference is then estimated by identifying the group of women least likely to have another child. The assumption is
The image that appears here in the printed version of this publication was not made available for use on the internet.
that if there were no gender preference, all women would be just as likely to have another child as this group. The difference between this—lowest—percentage having another child and the percentage of all women having another child is taken as a measure of the “extra” fertility that is due to gender preference. Estimates for India based on data from the first National Family Health Survey (NFHS) of 1992
Fertility in India would decrease
Early observers predicted that
to 1993 suggest that fertility at
by an estimated 8 percent in the
son preference would impede
the national level would decrease
absence of gender preference, which
efforts to slow down population
by about 8 percent in the absence
is most often a preference for sons
growth because couples would
of gender preference, which is
(Delhi, India) © David Cumming;
keep having children until they
most often a preference for sons
Eye Ubiquitous/Corbis
obtained the desired number
(Mutharayapa et al. 1997). A
of boys. In fact, several studies
decline of this magnitude would
have shown a relationship
have a substantial impact on
between son preference and
India’s population growth rate.
contraceptive use. For example, among South Korean women with
Women in India who are literate
two children, one study found
tend to have fewer children than
that the probability of having a
illiterate women. Yet the influence
third child was 12 percent if the
of son preference on fertility is
woman already had at least one
actually higher among literate
son and 54 percent if the woman
women. This suggests that
had only daughters (Choe et al.
women who are literate may want
1998). Among women with three
to have small families and may be
children in Bangladesh, the prob-
well equipped to stop childbear-
ability of having a fourth was 10
ing when they choose, but liter-
percent for women with two sons
acy does not necessarily change
and one daughter (the preferred
a woman’s attitude concerning
combination) and 17 percent for
the importance of having sons.
women with only daughters.
Such findings indicate that reducing son preference will require
Arnold (1985) has developed a
specific policies and programs—
method to estimate the influence
the problem will not necessarily
of gender preference on fertility
disappear automatically with
levels in quantitative terms. First,
gains in education for women.
women with a specific number of children are grouped according to their children’s sex. The influence
do become ill. In India, boys are breastfed slightly longer than girls, and they are slightly more likely to be fully vaccinated (Mutharayappa et al. 1997). Girls are less likely than boys to be reported as ill, possibly because their illnesses receive less serious attention, and when they become ill they are less likely to be taken to a health facility for treatment. Indian girls are also more likely than boys to be severely undernourished. Even in countries where child health is generally good, death rates may be higher for girls than for boys. In the late 1980s, Chinese families enjoyed nearly universal access to healthcare, and mortality among children age 1 to 4 years was less than 25 per 1,000. Among first-born children, child mortality was similar for girls and boys, but among second-born and subsequent children, child mortality was 15 percent higher for girls (see Figure 5) (Choe, Hao, and Wang 1995). In other countries of East Asia, such as South Korea, high incomes and low fertility now allow parents to provide good nutrition and high-quality care to both sons and daughters. As Figure 5 illustrates, however, excess female mortality has not disappeared entirely even in South Korea (Choe et al. 1998).
Selective abortion of female fetuses In societies that prefer sons, several practices may lead to abnormally high ratios of boys to girls at birth. The birth of baby girls may not be reported, or girls may not be counted in census enumerations. In some cases, families may even resort to female infanticide. In China during the 1980s, couples who wanted sons but faced harsh penalties if they had too many children sometimes gave baby girls away for adoption without registering their births.
60
50
57
46 Girls
Deaths per 1,000
Figure 5. Child mortality (deaths at ages 1–4 years per 1,000 children surviving to age 1): Nepal (1987–96), Bangladesh (1990–99), India (1989–98), China (1965–87), and South Korea (1981–85)
38
40
Boys
37 28
30
25
25 22
20 11
10
10
0 Nepal
52
Bangladesh
India
China
S. Korea
Source: For Nepal, Pradhan et al. (1997); for Bangladesh, NIPORT, Mitra and Associates, and ORC Macro (2000); for India, IIPS and ORC Macro (2000); for China, Choe, Hao, and Wang (1995); and for South Korea, Choe et al. (1998). Note: Mortality rates for China are for second-born and subsequent children.
Male births per 100 female births
Figure 6. Sex ratios at birth for China, South Korea, and Taiwan, 1980–92
120
China
115
S. Korea Taiwan
110
105
Normal range
100
95 1980
1982
1984
1986 Year
1988
1990
1992
Source: For China and Taiwan, UNFPA and Republic of Korea (1994); for South Korea, Park and Cho (1995).
More recently in Korea, China, and Taiwan, the introduction of technologies to determine the sex of unborn fetuses combined with the widespread availability of abortion has led to a record preponderance of male births, suggesting that couples are selectively aborting female fetuses. The normal sex ratio at birth is 104 to 107 males for every 100 females born. Sex ratios in China, Taiwan, and South Korea began to rise abruptly above this biological norm in the 1980s (Figure 6). The 1992 figures were 119 boys for every 100 girls in China, 114 in South Korea, and 110 in Taiwan. Evidence is accumulating that sex-selective abortion is also occurring in India. During the 1990s, 104 to 105 boys were born for every 100 girls in the southern states of Tamil Nadu, Kerala, and Karnataka, where son preference is low. By contrast, 110 to 120 boys were born for every 100 girls in Punjab, Rajasthan, and Haryana, where son preference is high (IIPS and ORC Macro 2000). In South Korea, a conservative estimate suggests that more than 30,000 fetuses were screened in 1990 alone, at a total cost to couples of approximately US$3 million. In discussing amniocentesis with a weekly news magazine, one Korean obstetrician estimated that 90 percent of all requests for fetal screening were for sex determination, rather than to detect genetic disorders. The 1990 census suggests that nearly 80,000 female fetuses were aborted between 1986 and 1990 for purposes of sex selection, a number equivalent to about 5 percent of all female births. The Korean government banned tests to determine the sex of fetuses in 1987 and increased the penalties for sex screening in 1990 and again in 1994. By the late 1990s, these policies, together with changing attitudes, began to bring sex ratios at birth closer to the normal range. Today, in South Korea’s urban areas, sex ratios at birth have returned to normal (NSO 2001). In regions of the country where traditional attitudes still prevail, however, the return to normal sex ratios at birth has been much slower.
The Changing Status of Women in Asian Societies
53
There is also evidence from China that current high sex ratios may be temporary. Ratios are low in the least developed rural provinces, high in more developed provinces, and low in the relatively modern cities of Shanghai and Beijing. The trend in these large cities may represent the future for China as a whole.
Conclusions
Financial support and care for the elderly will be important women’s issues in the future (Chiangmai, Thailand) © Wisut Jaijagcome/ East-West Center
54
On balance, economic development and social modernization have benefited women in Asia. Shrinking gender gaps in schooling and employment in many countries suggest that the status of women is improving. Women’s increasing life expectancy at birth also points to advances in nutrition and heathcare. Yet significant improvements in women’s status require changes in attitudes that are embedded in centuries of traditional culture. Detailed studies often show that high levels of education and household income do not necessarily assure women’s status in societies with strong traditions of male domination. In fact, relatively wealthy, educated women may be more restricted within the household than poor, uneducated women who are forced to play a stronger, more independent role by economic necessity. In Japan, married women with a college education are less likely to be employed outside the home than are less-educated women (Choe, Bumpass, and Tsuya forthcoming). In India, the influence of son prefer-
Many women in East Asia are balancing work and family responsibilities, and help from husbands is more the exception than the rule (Seoul, South Korea) © Alain Le Garsmeur/Corbis
The image that appears here in the printed version of this publication was not made available for use on the internet.
ence on fertility is stronger among women who are literate and who live in urban areas than among other women (Mutharayappa et al. 1997). What does the future hold? Advances in women’s education can be expected to continue, although in some countries the pace of change is slow. A shrinking proportion of working-age men in some Asian populations combined with continuing reductions in hours worked will exert pressure on employers to hire women and to encourage women to remain in the workforce. In the process, employers will have to accommodate women’s needs to manage both work and family responsibilities, and husbands will have to provide more help at home. Lingering problems of son preference and the advent of sex-selective abortion pose a dilemma for Asian policymakers. Evidence suggests that social and economic development alone may not fully counteract these manifestations of women’s low status in a patriarchal society—at least not right away. As one South Korean observer remarked, “Given the existing gender differences in earnings in the marketplace, parents or parents-in-law may perceive long-run returns from sons to be substantially higher than from daughters.” Social development for men and women—in the form of education, media exposure, and opportunities to work outside the home—can provide access to new ideas and, with time, a transformation of cultural values. In Asia’s developing countries and advanced economies alike, hiring practices and employment conditions need to be reviewed to reduce gender discrimination and to make it easier for parents—both men and women—to balance work and family obligations. Although it has proven difficult to end gender discrimination by government legislation alone, specific issues—such as sex-selective abortion and care and support for elderly women—require immediate policy attention.
The Changing Status of Women in Asian Societies
55