The Handbook of Environmental Chemistry Vol. 3, Part P (2003): 43–62 DOI 10.1007/b 10447
The Biogeochemistry of Chlorine in Soil Gunilla M. Öberg Department of Thematic Studies, Campus Norrköping, Linköpings universitet, 60174 Norrköping, Sweden. E-mail:
[email protected]
The chlorine-cycle in soil is described from a budget-perspective focussing on the interaction between organic and inorganic chlorine. The concentration and storage of organically bound chlorine and chloride in soil and vegetation is estimated for various eco-systems. The origin of the chloride and organic chlorine in soil is considered and major sinks and sources are pinpointed and estimated. Processes causing formation of organic chlorine (consumption of chloride) and mineralisation of organic chlorine (release of chloride) are discussed. It is shown that the extent of organic chlorine turnover is likely to influence the geochemical cycling of chloride. A rough global budget of the chlorine cycle is outlined at the end of this paper. Keywords. Chloride, Organic chlorine, Biogeochemistry, Cycling
. . . . . . . . . . . . . . . . . . . . . . . . . . . . . 44
1
Introduction
2
Storages . . . . . . . . . . . . . . . . . . . . . . . . . . . . . . . . 45
2.1 2.1.1 2.1.1.1 2.1.2 2.1.2.1 2.2 2.2.1 2.2.2
Soil . . . . . . . . . . . . . . . . . . . . . . . . . . . . . . . Organic Chlorine . . . . . . . . . . . . . . . . . . . . . . . . An Estimate of the Global Storage of Organic Chlorine in Soil Chloride . . . . . . . . . . . . . . . . . . . . . . . . . . . . . An Estimate of the Global Storage of Chloride in Soil . . . . Vegetation . . . . . . . . . . . . . . . . . . . . . . . . . . . . Organic Chlorine . . . . . . . . . . . . . . . . . . . . . . . . Chloride . . . . . . . . . . . . . . . . . . . . . . . . . . . . .
3
Fluxes . . . . . . . . . . . . . . . . . . . . . . . . . . . . . . . . . 51
3.1
Mineralisation of Organic Chlorine (Release of Chloride) and Formation of Organic Chlorine (Consumption of Chloride) Wet and Dry Deposition . . . . . . . . . . . . . . . . . . . . . Organic Chlorine . . . . . . . . . . . . . . . . . . . . . . . . . Chloride . . . . . . . . . . . . . . . . . . . . . . . . . . . . . . From Vegetation to Soil . . . . . . . . . . . . . . . . . . . . . . Litter . . . . . . . . . . . . . . . . . . . . . . . . . . . . . . . . Throughfall . . . . . . . . . . . . . . . . . . . . . . . . . . . . Through Soil to Groundwater . . . . . . . . . . . . . . . . . . Organic Chlorine . . . . . . . . . . . . . . . . . . . . . . . . . Chloride . . . . . . . . . . . . . . . . . . . . . . . . . . . . . .
3.2 3.2.1 3.2.2 3.3 3.3.1 3.3.2 3.4 3.4.1 3.4.2
. . . . . . . .
. . . . . . . .
. . . . . . . . . .
. . . . . . . .
. . . . . . . . . .
45 45 46 48 48 49 49 50
51 52 52 53 53 53 55 56 56 56
© Springer-Verlag Berlin Heidelberg 2003
44
G. M. Öberg
3.5 3.5.1 3.5.2
From Soil and Vegetation to the Atmosphere . . . . . . . . . . . . 57 Biomass Burning . . . . . . . . . . . . . . . . . . . . . . . . . . . 57 In Situ Formation in Soil . . . . . . . . . . . . . . . . . . . . . . . 58
4
The Global, Terrestrial Chlorine Cycle
5
References . . . . . . . . . . . . . . . . . . . . . . . . . . . . . . . 60
. . . . . . . . . . . . . . . 59
1 Introduction Chlorine is one of the most abundant elements on the surface of the Earth. In soil, it is mainly present as chloride ions (Cl–) and as an integrated part of the organic matter, that is organically bound (Clorg). The major source of the chloride ions is the oceans, whereas the organically bound chlorine originates from various sources. The geochemical cycling of chloride ions or the cycling of chloride that is driven by a combination of physical forces (such as wind, water and fire) and chemical forces (such as weathering, precipitation and ion-exchange), has been studied for decades. The more complex biogeochemical cycling that involves the formation, degradation and cycling of inorganic and organic chlorine compounds is of younger age. Consequently, there is extensive information on the geochemical cycling of chloride ions, but far less is known about the biogeochemical cycle of chlorine as a whole. Here, I will sketch the outlines of the entire cycle and construct a rough global budget to highlight more clearly those parts of the cycle that are fairly well known and those components that are more or less unknown. This paper begins in the part of the ground where roots and soil organisms are found, and the simplified chlorine cycle as described in Fig. 1. In the following discussion, each of the components of the chlorine cycle in soil will be described in detail. I start with the two major storages: soil and vegetation, and continue with the fluxes as indicated in Fig. 1, ending with a rough outline of the global biogeochemical cycle of chlorine in the terrestrial environment (Fig. 2).
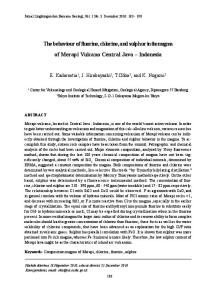
Fig. 1. A conceptual model of the chlorine cycle in the terrestrial environment. From the right to the left the arrows illustrate: deposition of chloride; loss of inorganic chloride to the atmosphere; loss of chloride by leaching; transformation of chloride to organic chlorine (top-horizontal arrow); mineralisation of organic chlorine to chloride (bottom-horizontal arrow); deposition of organic chlorine; loss of organic chlorine by leaching and loss by the formation of volatile chlorinated organic compounds (after [1])
The Biogeochemistry of Chlorine in Soil
45
Fig. 2. A rough sketch of the global chlorine cycle. Storages are given in million tons of chlo-
rine and fluxes in million tons of chlorine per year
2 Storages 2.1 Soil 2.1.1 Organic Chlorine
The past years of research have made it clear that organic chlorine is ubiquitous in soil and that organic matter contains chlorine, in amounts similar to that of phosphorus, which is only about one order of magnitude less than that of nitrogen and sulphur (Table 1). Topsoil samples have been collected from a number of places around the world and the concentration of organic chlorine in soil varies from a few micrograms per gram to milligram levels ([1–4]; Table 2). The detection limit of the method is approximately 0.5 µg Clorg g–1 (d.w.) and no samples have so far been reported to contain concentrations close to this limit.
46
G. M. Öberg
Table 1. Typical elementary composition of soil organic matter (After [1, 8–11])
Element
Mass fraction in dry matter (%)
C O H N S P Cl
40–50 30–40 3–6 1–5 0.1–1.5 0.03–0.2 0.01–0.5
Even though the concentration of organic chlorine has been determined in soil samples collected at various places around the world; the amount of organic chlorine that is stored in soil has to the best of my knowledge only been determined at five sites [4–6]). Three of these sites are situated in Scandinavia and two are situated in the Anhui Province in southeast China (Table 2). In one of these studies, two hundred samples that had been collected within the Swedish National Survey of Forest Soils and Vegetation during 1985–1987 were, among other things, analysed for organic chlorine [4]. Concentrations of 210–500 µg Clorg g–1 soil (d.w.; 1st and 3rd quartiles) were found, which gave a median storage of 8.3 g Clorg m–2 of organic chlorine in the O-horizon. In another study, soil samples were collected in a spruce forest soil in northwest Denmark in 1993. The storage was estimated to be 14 g Clorg m–2 in the top 20 cm and 75 g Clorg m–2 when a depth of 60 cm was taken into account [5]. In an ongoing study, ten soil cores with a depth of 15 cm were collected in April 2000 in a catchment in southeast Sweden [6]. The concentration of organic chlorine in the soil cores was 190–490 µg Clorg g–1 soil (d.w.; 1st and 3rd quartiles), and the median storage was estimated to be 10 g Clorg m–2 in the upper 15 cm. The storage of organically bound chlorine has also been determined in a forest soil and a paddy field that are situated in the Anhui Province in southeast China. Approximately 30 samples were collected to a depth of 15 cm at each site, and the amount stored in the soils was around 4.2 g Clorg m–2 in the forest soil and 2.5 g Clorg m–2 in the paddy soil [7]. 2.1.1.1 An Estimate of the Global Storage of Organic Chlorine in Soil
In 1989, it was suggested that the organic chlorine content might be related to the amount of organic matter in soil [12]. This conclusion is based on the observation that the chlorine-to-carbon ratio varies considerably less than the organic chlorine concentration does. Since there are numerous estimates of the global carbon storage in soil, a rough estimate of the organic chlorine storage can be reached by combining carbon storage data with chlorine-to-carbon ratios. According to Schlesinger [13], the global carbon storage in the pedosphere is 1456 billion tons. It appears as if the chlorine-to-carbon ratio in topsoil (the upper 15 cm) is in general slightly below 1 mg Clorg g–1 C, but it appears as if the chlorine-to-carbon
b
a
44
26 28
0–60 cm
0–15 cm
0–15 cm
0–15 cm
58°44¢N, 16°21¢E
30°49¢–30°55¢N, 118°41¢–118°46¢E 30°49¢–30°55¢N, 118°41¢–118°46¢E
Number of replicates. Not determined.
18
0–5 cm
10
199
Na
O–horizon
Southern Sweden Southern Sweden Klosterhede, Denmark Stubbetorp, SE Sweden Anhui Province, SW China, Anhui Province, SW China,
Depth
57°03¢–57°69¢N, 11°99¢–16°65¢E 55°–59°N, 13°–17°E 56°28¢N, 8°24¢E
Geographic co-ordinates
Location
25 (21–26)
28 (20–31)
68 (37–126)
5.2 (4.4–5.4)
7.6 (5.4–8.2)
3.0 (2.0–3.6)
Nd
Nd
Nd b Nd
1.8 (1.2–2.7)
68 (42–107)
Chloride Storage concentration (g Cl– m–2) (µg Cl– g–1 d.w.)
75 (62–84)
Nd
8.3 (5.8–11.5)
Storage (g Clorg m–2)
[74]
Source
[7]
[7]
[6]
Coniferous [75] forest Spruce forest [5]
Mixed forest
Vegetation
10.5 (6.5–13.4) Coniferous forest 16 (13–18) 4.2 (3.6–4.9) Coniferous forest 11.7 (10.6–13.1) 2.5 (2.2–2.7) Rice paddy
314 (190–492)
43 (10.5–56)
212 (161–331)
309 (207–497)
Org chlorine concentration (µg Clorg g–1 d.w.)
Table 2. Concentration and amount of chloride and organic chlorine in various soil systems. Median with 1st and 3 rd quartiles in parenthesis
The Biogeochemistry of Chlorine in Soil
47
48
G. M. Öberg
ratio often increases with soil depth [8]. This suggests that an estimate that is based on the assumption that soil organic matter in general has a chlorine-to-carbon ratio of 1 mg Clorg g–1 C is at risk of underestimating the organic chlorine content in the pedosphere. The overall chlorine-to-carbon ratio in soil cores that are deeper than 15 cm has only been determined at a site in northwestern Denmark [5]. The ratio clearly increased with depth from below 1 mg Clorg g–1 C in the litter layer to above 7 mg Clorg g–1 C in the deeper layers. When the organic chlorine storage is divided by the carbon storage in the six profiles that were studied, the median chlorine-to-carbon ratio in the soil as a whole was found to be 2.3 Clorg g–1 C. If we assume that this ratio is more valid as an average estimate of the chlorine-to-carbon ratio in world soils and that the global carbon storage is 1456 billion ton C, then the total storage of organic chlorine in the pedosphere can be estimated to be 3350 million ton Clorg . 2.1.2 Chloride
Chloride is generally studied with regard to the transport (i.e. input versus output) in a eco-system. Calculations are therefore most often based on measurements of the concentration of chloride in soil-water and surface-water. Even though there is numerous data on chloride concentrations in soil-water and surface water, data on chloride concentrations with respect to soil on a weight basis is rare and information on the storage of chloride in soil is as a consequence also rare. In the following discussion, I describe studies in which the authors have investigated the amounts of organic chlorine and chloride that are stored in the soil (Table 2). The concentration of chloride in the two hundred samples that were collected within the Swedish National Survey of Forest Soils and Vegetation during the period 1985–1987 were 42–110 µg Cl– g–1 soil (d.w.; 1st and 3rd quartiles), which gave a median storage of 1.8 g Cl– m–2 of chloride in the upper 15 cm [4]. The concentration of chloride in the ten soil cores that were collected in southeast Sweden in April 2000 were 37–130 µg Cl– g–1 soil (d.w.; 1st and 3rd quartiles), and the median storage was estimated to be 3.0 g Cl– m–2 in the upper 15 cm [6]. The storage of chloride at the two sites situated in the Anhui Province in southeast China gave 7.6 g Cl– m–2 in the forest soil and 5.2 g Cl– m–2 in the paddy soil [7]. 2.1.2.1 An Estimate of the Global Storage of Chloride in Soil
In summary, the amount of chloride in the abovementioned studies ranged from 2 to 8 mg Cl– m–2, but only the top 15 cm were taken into account. The median concentration of chloride in these studies varied from 25 to 70 µg Cl– g–1 soil (d.w). If we assume that the concentration of chloride is evenly distributed in the soil profile and that the density of soil is on average 1 g cm–3 (d.w.), then these figures allow us to approximate the storage in the top 2 m as 50–140 g Cl– m–2. Graedel and Keene [14] have made an outline of the global geochemical chlorine cycle.Among other things, they present a global estimate of the concentration of
The Biogeochemistry of Chlorine in Soil
49
chloride ions in soil. This estimate assumes an average soil depth of 2 m as calculated by Webb et al. [15] and a mean soil density of 1.0 g cm–3.According to Arimoto (personal communication as cited by Graedel and Keene [14]), the average concentration of chloride in soil in the world should be about 100 µg Cl– g–1. This renders a storage of chloride in soil of 200 g Cl– m2. Graedel and Keene do not present or discuss the data that underlie the estimation and it is consequently not possible to evaluate its accuracy. However, the chloride concentration they give is of the same order of magnitude as the studies commented on above, although the figure given by Graedel and Keene is in the higher span (Table 2). Consequently, a storage of approximately 200 g chloride in the upper 2 m appears to be a plausible figure. Starting with the same assumptions as suggested by Graedel and Keene, that is that the average soil depth over the continental areas that are not covered by ice is about 2 m, that the mean soil density is about 1 g cm–3 and that the average concentration of chloride in soil is 100 µg g–1, renders a total pedospheric reservoir content of about 24,000 million ton Cl–. 2.2 Vegetation 2.2.1 Organic Chlorine
It appears as if plant tissue in general contains organically bound chlorine. However, although more than 80 plant species are known to produce chlorometabolites [16], few studies have dealt with the quantification of such compounds in plants. In one study, eight plant species, representing different plant families were analysed for the total amount of organic chlorine [17]. It was found that the concentrations varied from 0.07 to 0.1 mg Clorg g–1 (d.w.). In another study, common beach leaves, spruce needles, sphagnum moss and bulk samples of grass were found to contain 0.01–0.1 mg Clorg g–1 (d.w.) [18]. These studies indicate that the concentration of organic chlorine varies among plants and it is likely that the concentration also varies among different types of plant tissues within the same plant (e.g. stem, leaves and bark). However, the data that has hitherto been collected is too scattered to permit differentiated estimates for various types of plants or plant tissues. A best estimate of the storage of organic chlorine in vegetation is thus achieved by assuming a chlorine-to-carbon ratio of all biomass. On the basis of the studies by Nkusi et al. [17] and Asplund et al. [18], a ratio of 0.05 mg Clorg g–1 (d.w.) appears reasonable. The discussion on global warming has led to intensified research into the size and changes of the carbon storage in plants and soil, and numerous studies are available on the subject. Plants form a major part of the biomass in an ecosystem, but the amount of biomass of plants varies strongly between areas. According to Houghton and Skole [19], the plant biomass in the major ecosystems of the world varies from 0.3 kg C m–2 in deserts to 15 kg C m–2 in tropical wet and moist forests (Table 3). If we assume that plant tissue in general contains 50% carbon and 0.05 mg Clorg g–1 C, the organic chlorine storage in the major ecosystem can be es-
50
G. M. Öberg
Table 3. Area and mean plant biomass of the major ecosystems in the world ([19]) and esti-
mated amount of organic chlorine stored in these systems. The organic chlorine estimates are based on the assumption that the chlorine-to-carbon ratio is on average 0.1 mg Clorg g–1 C Ecosystem
Tropical wet and moist forest Tropical dry forest Temperate forest Boreal forest Tropical woodland and savanna Temperate steppe Desert Tundra Wetland Cultivated land Rock and ice Global total
Area (1012 m2)
10.4
Mean Carbon in plant vegetation biomass (1015 g) (kg C m–2)
Organic chlorine in biomass (g Clorg m–2)
Organic chlorine in vegetation (1012 g Clorg)
15
156
1.5
15.6
7.7 9.2 15.0 24.6
6.5 8 9.5 2
49.7 73.3 143 48.8
0.65 0.8 0.95 0.2
4.97 7.33 14.3 4.88
15.1 18.2 11.0 2.9 15.9 15.2 145.2
3 0.3 0.8 2.7 1.4 0
43.8 5.9 9 7.8 21.5 0 558.8
0.3 0.03 0.08 0.27 0.14 0
4.38 0.59 0.9 0.78 2.15 0 55.88
timated to range from 0.03 g Clorg m–2 in deserts to 1.5 g Clorg m–2 in tropical and moist forests (Table 3). Based on the same assumptions, the global storage of organic chlorine in vegetation can be estimated to 56 million ton Clorg. The organic chlorine estimates are based on the assumption that the chlorine-to-carbon ratio is on average 0.1 mg Clorg g–1 C. 2.2.2 Chloride
All organisms contain chloride, which is mainly used to adjust the turgor and ionic strength of the cells. In addition, it is well documented that chloride also participates in certain essential processes such as photosynthesis [20]. From a biogeochemical point of view, the amount of chloride in organisms is considered as a temporary storage that varies with the amount of living organisms in the system. The variation is largest in areas with pronounced seasons, as for example during summer and autumn in the temperate regions, since this is the time when life proliferates in these areas. The storage of chloride in biomass can be estimated by combining the estimates on biomass given by for example Houghton and Skole [19] and discussed above (Table 3) with data on chloride concentrations in plant tissue. If we assume that the average concentration is 0.9%, the total global storage of chloride in vegetation can be estimated to be approximately 10,000 million ton Cl–. However, the concentration of chloride in plant tissue can range from as little as 0.03 mg g–1 (w/w) in severely deficient plant tissues to as much as several percent in plants
The Biogeochemistry of Chlorine in Soil
51
growing in salt marshes [21]. Lobert et al. [22] have made a compilation of the chlorine content in various types of biomass. The focus of their study is the contribution of biomass burning to chlorine emissions and it is thus not comprehensive regarding biomass in general. However, their compilation strongly suggests that the chloride content in plant tissue in general is considerably lower than 0.9%. It is shown that woody tissue often contains lower concentrations than leafy tissue and that the concentration in temperate forests is in general lower than in tropical forests.According to the compilation by Lobert et al. [22], woody tissues on average contain 109 µg Cl– g–1 and 254 µg Cl– g–1 in temperate and tropical areas, respectively. The leafy tissues contain on average 389 µg Cl– g–1 and 873 µg Cl– g–1, respectively, whereas grass on average contains 1022 µg Cl– g–1. By combining these figures with the biomass estimates by Houghton and Skole [19] and an assumption that leafy fraction of the biomass comprises 30% in forests, 90% in grasslands and 60% in deserts [13], renders a modified estimate of the storage of chloride in vegetation. On the basis of these assumptions, the storage in the major ecosystems of the world can thus be estimated to vary from 0.16 to 13.6 g Cl m–2 in deserts and tropical wet and moist forests, respectively. On the basis of the same assumptions, the total global storage of chloride in vegetation can be estimated to be 615 million ton Cl–.
3 Fluxes 3.1 Mineralisation of Organic Chlorine (Release of Chloride) and Formation of Organic Chlorine (Consumption of Chloride)
The past decade of research has revealed that formation and mineralisation of organic chlorine actually takes place in soil [23–29]. Formation of organic chlorine renders the soil to act as a sink of chloride, while a mineralisation of organic chlorine renders the soil to act as a source of chloride. There is strong evidence that various forms of biotic processes drive both the formation and the degradation of organic chlorine. The numerous soil organisms that are reported to have an ability to transform chloride to organic chlorine compounds further strengthen this conclusion [30].A recent report suggests that abiotic processes may also be of importance in the chlorine cycle [31]. However, the rates of these processes are poorly understood and so far only net changes have been studied in the field. In a field study of decomposing spruce needles over 3–6 years, it was found that a net formation of organic chlorine took place at a rate of approximately 50 µg Clorg g–1 until 30–40% of the litter was lost (i.e. after 3–4 years); thereafter, the rate rapidly decreased to zero [24]. The net formation on an area basis was estimated to be 0.036 g Clorg m–2 by combining the information from the former study with litterfall data from a study at the Klosterhede plantation in northeast Denmark [5]. In another study, the amounts of chloride leaching through soil at different levels were investigated and the results indicate that as much as 0.2 g Cl– m–2 actually was withdrawn annually from the deeper layers as com-
52
G. M. Öberg
pared to the surficial layers (Sandén and Öberg, unpublished). The annual deposition of chloride in the area has been estimated to be 0.7 g Cl– m–2 [32]. These studies suggest that the formation of organic chlorine (consumption of chloride) under prevailing circumstances was larger than the mineralisation of organic chlorine (release of chloride). There are indications that the net formation decreases with nitrogen fertilisation and increases with decreasing pH [23, 24]. The studies also indicate that the net formation varies seasonally with a maximum occurring during autumn and a minimum during early summer in Scandinavian soils. All in all, these studies strongly indicate that internal net changes of the organic chlorine storage in soil are influenced by environmental variables. However, the rates of the two underlying processes (mineralisation/formation) have so far not been separated and it is consequently not known if the observed net changes are caused by a change in the formation, a change in the mineralisation rate or a change in both. It is thus not possible to make even a rough estimate of the formation/mineralisation of organic chlorine in soil on a global basis. 3.2 Wet and Dry Deposition 3.2.1 Organic Chlorine
Wet and dry deposition does in general contain organically bound chlorine [33–37]. The concentration of organic chlorine in precipitation varies from a few to around 30 µg Clorg L–1. If we assume an average concentration of 10 µg Clorg L–1, the amount deposited in areas with high wet deposition (>2000 mm yr–1) via rain and snow can thus be estimated to be about 0.02 g Clorg m–2. The deposition in areas with moderate to low wet deposition is thus estimated to be in milligram levels. The origin of the organic chlorine in precipitation is unclear, but appears to a major extent to originate from natural sources such as marine aerosols, volcanic eruptions and other terrestrial sources and perhaps a photochemical formation in the atmosphere. The presence of compounds in throughfall that does not originate from precipitation is generally attributed to either external sources outside the actual site or internal sources within the actual site. The former is often referred to as dry deposition or leaf washing, while the latter is referred to as leaf/canopy leaching, exudates, leachates, drip etc. A study of throughfall in a spruce forest in northwest Denmark showed that the concentration of organic chlorine in the throughfall was considerably higher than what is normally found in precipitation [38]. The deposition pattern suggested that the increase was mainly attributed to internal sources rather than dry deposition. This suggests that dry deposition is not a major source of organic chlorine. It has been shown that several specific organohalogens are often present in precipitation. For example, DDT (dichlorodiphenyltrichloroethane), PCBs (polychlorinated biphenyls), PCDDs (polychlorinated dibenzodioxins) chlorobenzenes, chlorophenols and chloroacetic acids may be found in rain [36, 39–43].
The Biogeochemistry of Chlorine in Soil
53
Such compounds can only explain a minor fraction of the total amount of organically bound chlorine in rain, since they are only detected in ppt or ppb levels. From a chlorine budget perspective, the relative contribution from such compounds is thus negligible. Several attempts have been made to determine the chemical character of the bulk organically bound chlorine in precipitation [44, 45], but the major fraction has still not been identified. The annual rainfall over land areas of the world is approximately 110,000 km3 yr–1 [14]. Assuming a median concentration of organic chlorine of 10 µg Clorg L–1 renders a total deposition of 1.1 million ton Clorg yr–1. 3.2.2 Chloride
Through the action of sea spray, chloride ions are widely transported from the oceans and spread as wet and dry deposition over land and water. The wet deposition is the amount of chloride that is brought to the ground with precipitation (rain and snow), while dry deposition is the amount of chloride that is deposited as dust and the like. The wet deposition can be easily monitored, whereas the dry deposition is rather difficult to determine. As a rule of thumb, it can be said that the dry deposition is assumed to be about the same order of magnitude as the wet deposition. The dry deposition mainly depends on the distance from the sea, wind direction and topography. The concentration of chloride ions in precipitation mainly depends on the distance from the sea and the wind direction. The amount of chloride that is deposited on the ground via precipitation depends on the concentration of chloride in the precipitation in combination with the amount of precipitation. Since the amount of precipitation varies strongly, the deposition pattern of chloride via precipitation resembles, but is certainly not identical, to the precipitation pattern. The annual wet deposition may be as high as 10 g m–2, as on the Norwegian West Coast, or far below 0.01 g Cl– m–2, as on the inland of the US [46, 47]. Assuming a median chloride concentration of 0.1 mg Cl– L–1, an annual wet deposition of 110,000 km3 yr–1 and twice as high dry deposition renders a global deposition of 33 million ton Cl– yr–1. 3.3 From Vegetation to Soil 3.3.1 Litter
The net primary production (NPP) in an ecosystem is the total amount of biomass formed by plants, including stem wood, branches, leaves, plants and roots. A large fraction of the NPP is delivered to the soil as dead organic matter. Plant litterfall appears to contain organic chlorine in general, which is in line with the findings that plant tissue contains organic chlorine [16, 17]. Only a few studies have focussed on the concentration of organic chlorine in plant litter, and even fewer have focussed on quantitative estimates.
54
G. M. Öberg
A study on the deposition of organic chlorine via litterfall has been conducted in a spruce forest soil situated in northwest Jutland in Denmark [5]. Litterfall was collected every third month over a year. The average concentration of organic chlorine in the needle litter was 0.1 mg Clorg g–1 of litter. The total deposition of litter during the investigation period was 280 g m–2 (d.w.), which gave an input of 35 mg Clorg m–2. Roots and ground vegetation were not included. So far, information is actually only available on the organochlorine content of aboveground parts from higher plants, whereas no information is available on roots or lower plants such as ferns and mosses. It is clear that the annual growth and death of fine roots contribute considerably to the soil organic matter content [48, 49]. The transport of organic chlorine from plants to soil will therefore be underestimated if only the litterfall is taken into account. The annual amount of biomass that is brought to the ground through decomposing roots and aboveground litter varies strongly among ecosystems and the deposition decreases with increasing latitude from tropical to boreal forests (Table 4). Global patterns of the deposition of plant litterfall are similar to global patterns in net primary production [13]. In most terrestrial ecosystems, the majority of the NPP enters the decomposition sub-system as plant litter. Meentemeyer et al. [50] used NPP models in combination with actual evapotranspiration to predict global patterns of plant litterfall and estimated the annual production of worldwide, aboveground litterfall to be 54.8 billion ton C. If we assume that detritus in general has a chlorine-to-carbon ratio of 0.1 mg Clorg g–1 organic matter (d.w.), the flux from vegetation to soil can be roughly estimated to be 5.5 million ton Clorg (Table 4).
Table 4. A rough estimate of the annual transport of chloride and organic chlorine from plants
to soil in the world ecosystems. The estimates are based on the assumptions that all of the net primary production enters the terrestrial system as detritus and that all detritus contains 0.9% chloride and 0.1 mg Clorg g–1 organic matter (d.w.). The net primary production estimates are from Houghton and Skole ([19]) Ecosystem
Tropical wet and moist forest Tropical dry forest Temperate forest Boreal forest Tropical woodland and savanna Temperate steppe Desert Tundra Wetland Cultivated land Global total
Area (1012 m2)
Net primary production (g C m–2 yr–1)
Transport of chloride (g Cl– m–2 yr–1)
Transport of organic chlorine (g Cl org m–2 yr–1)
10.4
800
7.2
0.16
7.7 9.2 15.0 24.6
620 650 430 450
5.58 5.85 3.87 4.05
0.12 0.13 0.09 0.09
15.1 18.2 11.0 2.9 15.9 145.2
320 80 130 1300 750
2.88 0.72 1.17 11.7 6.75
0.06 0.02 0.03 0.26 0.15
The Biogeochemistry of Chlorine in Soil
55
3.3.2 Throughfall
A study in a mature spruce forest in northwestern Denmark showed that the concentration of organic chlorine in the throughfall was considerably higher than normally found in precipitation. The mean value of all samples gave an annual deposition of 0.04 g Clorg m–2, which is in the same order of magnitude as the deposition of organic chlorine via litterfall. It was found that the concentrations were closely related to the distance to the closest tree. The annual deposition in the samplers that were placed closer than one metre from a tree was around 0.06 g Clorg m–2 yr–1, whereas the deposition in samplers that were placed more than two meters from a tree were less than 0.01 g Clorg m–2 yr–1. The studied forest is situated less than 10 km from the ocean and is exposed to strong westerly winds. Previous studies have shown that the soil chemistry in the area is strongly influenced by the ocean [51–53]. Dry deposition of particles and gases from external sources usually renders a deposition gradient from the forest edge and inwards, while compounds that originate from internal sources do not exhibit such a pattern [54, 55]. No such pattern was observed in the discussed study. Furthermore, the concentration of organic chlorine closely followed that of organic carbon, which indicates a common source. It is generally agreed that the major part of the organic carbon in throughfall originates from internal sources of a forest [56–58]. Finally, the concentration of compounds that originate from internal sources is generally higher during the growing season than during the dormant season. Such a pattern was observed for the organic chlorine in the discussed study. Substances that mainly originate from external sources, such as the sea or fossil fuel combustion tend to show an opposite pattern [55]. All in all, the results of the study strongly indicate that the increased amount of organic chlorine in throughfall as compared to precipitation, originate from internal sources in the forest. The data on the transport of organic chlorine from vegetation to soil via throughfall is far too weak to make even a rough estimate of the global transport. However, the study in northwestern Denmark suggests that the contribution from this source is of the same order of magnitude as the contribution from aboveground litter. This suggests that the transport from vegetation to soil via throughfall cannot be assumed to be negligible. This component is therefore included here in the budget and assumed to be half as large as the transport via litterfall, that is 2.25 million ton Clorg . The reason why litter contains organic chlorine is hitherto unknown. As it is not uncommon for plants to be able to form such compounds [16], it is tempting to suggest that the chlorine content in litter is due to the plants themselves, or perhaps microorganisms on the leaves that transform chloride to organic chlorine.
56
G. M. Öberg
3.4 Through Soil to Groundwater 3.4.1 Organic Chlorine
The loss of organic chlorine by leaching is poorly understood. However, it is well documented that organic matter is transported through soil with soil water. Consequently, it can be concluded the transport of organic chlorine with soil leachates cannot be neglected when a chlorine budget is to be constructed. The concentration of organic chlorine in soil leachates has been determined in a few cases. A study of soil leachates collected at Klosterhede, southwest Denmark rendered organic chlorine concentrations that varied from 70 to 250 µg Clorg L–1 (Grön and Öberg, unpublished) and the transport was roughly estimated to be 0.07 g Clorg m–2 yr–1. An ongoing laboratory study using soil cores that were collected in a small catchment in southeast Sweden, incubated under controlled conditions in climate chambers and irrigated with artificial rain, gave a concentration of organic chlorine in the soil leachate of around 400 µg Clorg L–1 [6].Assuming that this is representative of the actual catchment, the annual amount of organic chlorine that is transported from the upper soil layers as soil leachate in the catchment can be roughly estimated to be about 0.09 g Clorg m–2 yr–1. The annual transport of water from land to the seas is about 47,000 km3. Assuming an average organic chlorine concentration of 400 µg Clorg L–1 renders a global transport of 18.8 million ton Clorg. However, the organic matter content in soil leachates in Scandinavia as well as in the rest of the temperate to boreal region is considerably higher than in the warmer regions of the Earth. If we instead assume an average carbon concentration of 50 mg L–1 in soil leachates around the world and an average organic chlorine-to-carbon ratio of 2 mg Clorg g–1 C, renders a concentration of 100 µg Clorg L–1 and a global transport of 4.7 million ton Clorg . 3.4.2 Chloride
Chloride ions easily follow the movement of water through soil. This is due to the fact that the major structures in the soil matrix, such as organic matter and clay, are negatively charged. Since the chloride ion also is negatively charged it is repelled by the solid structures and, as a consequence, easily transported through the soil by the movement of water. It has even been argued that chloride ought to move faster through soil than the water as a result of its negative charge.Whether this is the case or not, the movement of chloride is closely connected to the movement of water. To understand the movement of chloride ions in soil, it is thus necessary to understand the basic features of the hydrological cycle. In short, water evaporates from the oceans to the atmosphere and is deposited over land as rain or snow. Plants adsorb large amounts of the water that is deposited and a major part is returned to the atmosphere as evapotranspiration from the leaves. In cold, humid climates, the wet deposition is generally larger than the evapotranspiration and consequently, there is an excess of water in such regions. Ap-
The Biogeochemistry of Chlorine in Soil
57
proximately 70% of the wet deposition is for example lost as evapotranspiration in Scandinavia, which leads to an excess of approximately 30%. The excess of water causes a downward movement of water through the unsaturated soil. Eventually, the water reaches a depth where the soil is saturated (i.e. the ground water level). Hence, in areas where the wet deposition exceeds evapotranspiration, chloride ions that are present in precipitation are transported downwards in the soil profile. Based on the assumption that chloride does not participate in any biological processes, the concentration of chloride is considered to increase with depth in the root-zone, since an increasing fraction of water is lost through evapotranspiration. In dry and warm climates, evapotranspiration is larger than wet deposition, which occasionally causes a water deficit. There is no movement of water downwards in the soil profile in such areas and, as a consequence, chloride ions and under such circumstances other water-soluble compounds are enriched in the top-layers. In periods of drought, there may even be a transport of chloride upwards from lower layers in dry periods when the water moves in that direction. Eventually, such a movement will cause saltification of soil. Human activities, such as irrigation and the use of road salt, have locally caused an immense increase in the concentration of salt, occasionally making these soils more or less sterile. On a catchment scale, the dry deposition is generally calculated as the run-off minus the wet deposition, since soil is assumed to act neither as a sink nor a source of chloride. The assumption that the dry deposition on an average equals the wet deposition is based on this assumption. Hence, all analyses of available data follow this line of reasoning. On a global scale, transport from ancient salt deposits is often included as a source when the transport to the oceans is under consideration. Since such deposits are unlikely to influence the transport from the pedosphere to the saturated zone of the groundwater, this source is not included in the present budget. As no other model at present is at hand, the assumption that the run-off equals the deposition is used here as a basis for the estimate of the run-off, that is 22 million ton Cl– yr–1. 3.5 From Soil and Vegetation to the Atmosphere
It is well documented that considerable amounts of volatile inorganic and organic chlorine compounds are formed in the pedosphere and transported to the atmosphere through a combination of abiotic and biotic processes. The major known sources are biomass burning and biotic formation by soil microorganisms and vegetation. 3.5.1 Biomass Burning
Biomass burning is a major source of many atmospheric trace constituents [22]. Today, about 90% of the biomass burning is human induced and only a small part is caused by natural phenomena such as lightning and lava efflux. Lobert at al. [22] have conducted an inventory of global chlorine emissions from biomass
58
G. M. Öberg
burning as a part of Reactive Chlorine Emissions Inventory Activity (RCEI), which is an activity of the Global Emissions Inventory Activity (GEIA) conducted under the auspices of the International Global Atmospheric Chemistry (IGAC) project. Nine discrete classes of biomass burning were estimated on a 1° latitude ¥ 1° longitude grid based on a biomass burning inventory for carbon emissions. The estimated global emissions in the inventory are 640 ¥ 103 ton Clorg yr–1 for CH3Cl, 49 ¥ 103 ton Clorg yr–1 for CH2Cl2, 1.8 ¥ 103 ton Clorg yr–1 for CHCl3 and 13 ¥ 103 ton Clorg yr–1 for CH3CCl3, which gives a total emission of volatile organic chlorine of 0.7 million ton Clorg yr–1. In addition, the authors estimate the sum of volatile inorganic and particulate chlorine to be 6.35 million ton Cl yr–1. 3.5.2 In Situ Formation in Soil
During the past few years, a number of studies have revealed that large amounts of chlorinated volatiles are emitted from terrestrial sources [59–65]. Even though the information is still very scattered, there is evidence that chloromethane, chloroform and perhaps other chlorinated volatiles are formed in various ecosystems such as coniferous forest soils, peatlands, (coastal) wetlands and rice paddy fields. Various emission rates have been reported. For example, emissions of chloromethane from coastal salt marches in the US were in one report recorded in the span 0.2–1.2 g m–2 yr–1 [62], whereas a study of Irish salt marshes rendered fluxes of 0.001–0.004 g m–2 yr–1 [61]. The latter study also reports fluxes from coniferous forest floor of around 0.1 g m–2 yr–1. The fluxes do not only appear to vary strongly among ecosystems but also diurnally and seasonally [59, 61]. The studies conducted so far have not been designed to handle such variations and estimates made are consequently rather rough and, as pointed out by several authors, it is still not possible to reliably quantify the relative contribution from terrestrial processes to the atmospheric burden (e.g. [63]). The underlying processes in the formation of chlorinated volatiles in soil are far from being fully understood. For example, it appears as if there are different processing causing the formation of chloromethane and chloroform. A large number of wood-rotting fungi and plants have been shown to produce chloromethane through intracellular specific biochemical pathways [66–69]. In addition, a recent study suggests that an abiotic formation of chloromethane involving redox reactions with organic matter, iron and chloride may take place in soil [31]. Even though it has been shown that several natural sources form chloroform [60], it seems that fairly little is known about the biochemical pathways of chloroform formation. It is known that enzymes with chloroperoxidase activity may induce the formation of chloroform [70] and coniferous forest soil has been found to exhibit chloroperoxidase activity [71, 72].As a consequence, it has been suggested that the unspecific formation of chloroform in soil might be due to exo-enzymatic activity. In a review by Harper in this volume, the terrestrial formation (fungi, saltmarshes, wetland, forest ecosystems) is estimated to be approximately 0.3 million ton Clorg yr–1. Adding this to the known emissions from the oceans, biomass
The Biogeochemistry of Chlorine in Soil
59
burning and human sources, then counting backwards from the known concentrations in the troposphere, this leaves a shortfall of 2.5–3.6 million ton that must be attributed to unknown sources. The distribution pattern, with higher concentrations in the northern hemisphere and elevated concentrations over land relative to over oceans, suggests that the currently unidentified sources must be terrestrial and/or coastal in origin [61].
4 The Global, Terrestrial Chlorine Cycle The aim of this paper was to draw the rough outlines of the terrestrial chlorine cycle to more clearly elucidate and highlight those parts of the cycle that are fairly well known and those components that are more or less unknown. The estimates presented in this paper are summarised in Fig. 2. If only the topsoil down to 15 cm is taken into account, the storage of organic chlorine appears to be slightly larger or of the same order of magnitude as the chloride storage. However, the concentration of organic chlorine follows the organic matter content of the soil, which decreases with depth, while the concentration of chloride can be assumed to be more evenly distributed in soil horizons. The estimated storage of chloride is as a consequence found to be about eight times larger than the storage of organic chlorine when the upper 2 m of the pedosphere is taken into consideration. The estimates presented in this paper rendered a global storage of 3350 million ton organic chlorine and a storage of 24,000 million ton chloride. These calculations reveal that the organic chlorine storage in the pedosphere is of such size that even small changes will influence the transport of chloride in soil. The estimated storage in vegetation is considerably smaller than the storage in the pedosphere. The wet deposition of chloride is estimated to 11 million ton and it is assumed that the dry deposition is twice as large and that the run-off equals the sum of the dry and the wet deposition. This may appear as a paradox, since the underlying assumption for this line of reasoning is questioned in this paper, that is that soil neither works as a sink nor a source of chloride. However, since all available data is based on this line of reasoning, all chlorine budgets so far constructed inevitably suffer from this tautology: dry deposition estimates are based on run-off measurements and run-off estimates are based on assumptions about the size of the dry-deposition. Hence, this is the best estimate we can get as long as the other parts of the budget have not been more fully elaborated. The estimated loss of 6.35 million ton Clinorg yr–1 in the form of volatile inorganic and particulate chlorine as a result of biomass burning is based on laborious calculations by the global emissions in the inventory, and appears to be one of the most solid components of the budget. This can also be said for the estimated 0.7 million ton Clorg yr–1 from the same source. The remaining 3.3 million ton of organic chlorine that are assumed to be emitted from terrestrial sources is the sum of emissions from fungi, vegetation and unknown terrestrial sources as calculated backwards from the amounts present in the atmosphere minus the known sources [73]. The estimated loss of organic chlorine by soil leachate is of the same order of magnitude as the estimated loss caused by volatilisation.
60
G. M. Öberg
It is clear that an internal chlorine cycle takes place in the terrestrial system involving uptake and release of chloride and perhaps also an uptake of organic chlorine compounds by organisms; formation of organic chlorine compounds by soil organisms and plants; mineralisation of chlorinated organic compounds and a transport of both organic and inorganic chlorine compounds with detritus from the plant system to the soil system. The only components of this internal cycle that have been quantified here are the transport from vegetation to soil via the formation of litter and leaching by throughfall. The sum of these is estimated to approximately 8 million ton yr–1. From a catchment scale and upwards, none of the processes that comprise the internal terrestrial chlorine cycle will influence the transport of chloride in the system, as long as organic chlorine is not lost from the system by soil leachate or as volatiles, or the size of the organic chlorine storage is considerably changed. Hence, it is crucial to make more reliable estimates of the loss by leaching and volatilisation to get a better picture of the relationship between the geochemical cycling of chloride and the turnover of organic chlorine in soil. In addition, it is crucial to analyse the circumstances that cause the soil system to act as a sink or a source of chloride. Two conclusions can be drawn from the present chapter even though the data underlying many of the estimates are rather weak: i) The organic chlorine storage appears to be of such size that even small changes will influence the transport of chloride; and ii) The estimated loss of chlorine from the soil system via soil leachates and formation of volatile chlorinated organics indicates that the soil system in general acts as a sink of chloride. This in turn suggests that the dry deposition of chlorine in general is underestimated.
5 References 1. Asplund G, Grimvall A (1991) Environ Sci Technol 25:1346–1350 2. Hjelm O (1996) Organohalogens in coniferous forest soil. PhD thesis, Linköpings Universitet, Linköping 3. Johansson C (1996) Halogenated structures in natural organic matter. PhD thesis, Linköpings Universitet, Linköping 4. Johansson E (2000) Organic chlorine and chloride in soil. PhD thesis, Linköpings Universitet, Linköping 5. Öberg G, Grøn C (1998) Environ Sci Technol 32:1573–1579 6. Rodstedth M et al (2002) Chemosphere (in press) 7. Johansson E et al (2002) Chemosphere (in press) 8. Öberg G (1998) Acta Hydrochim Hydrobiol 26:137–144 9. Killops SD, Killops VJ (1993) An introduction to organic geochemistry. Longman Singapore Publishers, Singapore 10. Swift MJ, Heal OH,Anderson JM (1979) Decomposition in terrestrial environments. Blackwell, Oxford 11. Tate RL III (1987) Soil organic matter. Biological and ecological effects. Wiley, New York 12. Asplund G, Grimvall A, Pettersson C (1989) Sci Total Environ 81/82:239–248 13. Schlesinger WH (1997) Biogeochemistry. An analysis of global change. Academic Press, San Diego
The Biogeochemistry of Chlorine in Soil
61
14. Graedel TE, Keene WC (1996) The budget and cycle of Earth’s natural chlorine. Pure Appl Chem 68:1689–1697 15. Webb RS, Rosenzweig CE, Levine ER (1987) A gridded data set of soil particle size properties, NASA technical memorandum. p 34 16. Engvild KC (1986) Phytochemistry 25:781–791 17. Nkusi G, Müller G (1995) Naturally produced organohalogens: AOX-monitoring in plants and sediments. In: Grimvall A, Leer de EWB (eds) Naturally-produced organohalogens. Kluwer, Dordrecht, pp 261–268 18. Asplund G (1995) Origin and occurrence of halogenated organic matter in soil. In: Grimvall A, Leer de EWB (eds) Naturally-produced organohalogens. Kluwer, Dordrecht, pp 35–48 19. Houghton RA (1995) Changes in the storage of terrestrial carbon since 1850. In: Lal R et al (eds) Soils and global change. CRC Lewis, Boca Raton 20. Hind G, Nakatani HY, Izawa S (1969) Biochim Biophys Acta 172:277 21. Page AL (ed) (1982) Methods of soil analysis. Chemical and microbial properties, 2nd edn. Agronomy, vol 9. American Society of Agronomy, Madison 22. Lobert JM et al (1999) J Geophys Res 104:8373–8389 23. Öberg G, Börjesson I, Samuelsson B (1996) Water Air Soil Pollut 89:351– 361 24. Öberg G, Nordlund E, Berg B (1996) Canadian J Forest Res 26:1040–1048 25. Hjelm O, Johansson E, Öberg G (1999) Soil Biol Biochem 31:1509–1515 26. Hjelm O, Borén H, Asplund G (1996) Chemosphere 32:1719–1728 27. Hjelm O, Johansson MB, Öberg-Asplund G (1995) Chemosphere 30:2353–2364 28. Hoekstra E, Leer de EWB (1993) Natural production of chlorinated organic compounds in soil. In: Arendt F et al (eds) Contaminated Soil. Kluwer, pp 215–224 29. Jong de E, Field JA (1997) Ann Rev Mircrobiol 51:357–414 30. Gribble GW (1996) Naturally occurring organohalogen compounds – a comprehensive survey. In: Hera W et al (eds) Progress in the chemistry of organic natural products, vol 68. Springer, Berlin Heidelberg New York 31. Keppler F et al (2000) Nature 403:298–301 32. Maxe L (1995) Effects of acidification on groundwater in Sweden. Swedish Environmental Protection Agency, p 166 33. Keller M (1989) Vom Wasser 72:199–210 34. Häsänen E, Manninen PKG (1989) VDI Berichte 745:395–400 35. Enell M, Kaj L,Wennberg L (1989) Long-distance distribution of halogenated organic compounds (AOX). In: Laikari H (ed) River basin management. Pergamon, Oxford 36. Schleyer R, Renner I, Mühlhausen D (1991) Beeinflussung der Grundwasserqualität durch luftgetragene organische Schadstoffe. Institut für Wasser-, Boden- und Lufthygiene des Bundesgesundheitsamtes, Berlin 37. Grimvall A et al (1991) Long-term accumulation and degradation of bleach-plant effluents in receiving waters. In: Environmental fate and effects of bleached pulp mill effluents. Saltsjöbaden, Sweden 38. Öberg G, Johansen C, Grøn C (1998) Chemosphere 36:1689–1701 39. Atlas E, Giam CS (1981) Science 211:163–165 40. Paasivirta JHK et al (1985) Chemosphere 14:469–491 41. Frank H (1991) Ambio 20:13–18 42. Strachan WMJ (1988) Environ Toxicol Chem 7:871–877 43. Koester CJ, Hites RA (1992) Environ Sci Technol 26:1375–1382 44. Lijser de HJP et al (1991) Natural organochlorine in humic soils. GC and GC-MS studies of soil pyrolysates. In: Allard B, Borén H, Grimvall A (eds) Humic substances in the aquatic and terrestrial environment. Springer, Berlin Heidelberg New York, pp 485–494 45. Laniewski K et al (1995) Chemical characterization of adsorbable organic halogens (AOX) in precipitation. In: Grimvall A, Leer de EWB (eds) Naturally-produced organohalogens. Kluwer, Dordrecht, pp 113–130 46. Eriksson E (1959) The yearly circulation of chloride and sulfur in nature, meteorological, geochemical and pedological implications. Part I. Tellus 11:376–403
62
G. M. Öberg: The Biogeochemistry of Chlorine in Soil
47. 48. 49. 50. 51. 52. 53. 54. 55. 56. 57. 58. 59. 60. 61. 62. 63. 64.
Eriksson E (1960) Tellus 12:63–109 Vogt KA, Grier CC, Vogt DJ (1986) Adv Ecologi Res 15:303–377 Nadelhoffer KJ, Reich JW (1992) Ecology 73:1139–1147 Meentemeyer V, Box EO, Thompson R (1982) BioScience 32:125–128 Beier C et al (1995) Plant Soil 168–169:613–622 Gundersen P et al (1995) Plant Soil 168–169:601–611 Hansen K et al (1995) Plant Soil 168–169:623–632 Beier C, Gundersen P, Rasmussen L (1992) Atmos Environ 26A:1553–1559 Beier C, Hansen K, Gundersen P (1993) Environ Pollut 81:257–267 Collier KJ, Jackson RJ, Wintervourn MJ (1989) Arch Hydrobiol 117:21–38 Guggenberger G, Zech W (1994) Soil Biol Biochem 26:19–27 Qualls RG, Haines BL (1991) Soil Sci Soc Am J 55:1112–1123 Haselmann KF, Laturnus F, Grøn C (2002) Water Air Soil Pollut (in press) Laturnus F et al (2002) Biogeochemistry (in press) Dimmer CH et al (2001) Atmos Environ 35:321–330 Rhew RC, Miller BR, Weiss RF (2000) Nature 403:292–295 Khalil MAK et al (1999) J Geophys Res 104:8333–8346 Redeker KR et al (1999) Emissions of methyl halides from a California rice field. EOS Transactions American Geophysical Union (Suppl) 80:64 Hoekstra EJ et al (2001) Atmos Environ 35:61–70 Harper DB (1985) Nature 315:55–57 Harpery DB et al (1999) New Phytologist 142:5–17 Saini HS, Attieh JM, Hanson AD (1995) Plant Cell Environ 18:1027–1033 Gan J et al (1998) Geophys Res Lett 25:3595–3598 Walter B, Ballsmiter K (1992) Fresenius J Anal Chem 342:827–833 Asplund G et al (1991) Soil peroxidase-mediated chlorination of fulvic acid. In: Allard B, Borén H, Grimvall A (eds) Humic substances in the aquatic and terrestrial environment. Springer, Berlin Heidelberg New York, pp 475–484 Asplund G, Christiansen JV, Grimvall A (1993) Soil Biol Biochem 25:41–46 Khalil MAK, Rasmussen RA (2000) Environ Sci Pollut Res 7:79–82 Johansson E, Sandén P, Öberg G (2002) Geoderma (submitted) Johansson E et al (2001) Geoderma 10:1–13
65. 66. 67. 68. 69. 70. 71. 72. 73. 74. 75.