Switching from Imatinib to 2G TKI : When & how? Giuseppe Saglio, MD University of Turin Turin, Italy
Switching from Imatinib to 2G TKI : When & how ? Giuseppe Saglio, MD U n i v e r s i t y o f Tu r i n Tu r i n , I t a l y
Parameters to evaluate re...
Switching from Imatinib to 2G TKI : When & how ? Giuseppe Saglio, MD U n i v e r s i t y o f Tu r i n Tu r i n , I t a l y
Parameters to evaluate response to imatinib
• Degree of leukemic burden reduction • Time to achieve it
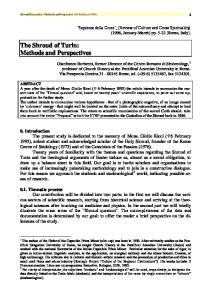
Monitoring Response in CML: Hierarchic Order Of Responses Leukemic Burden
BCR-ABL%
1013
Hematologic remission
1011
Overall survival More stable response Low risk of progression
CCyR
2 logs 1%
1010
MMR 109
MR4.5 CMR Possibility to discontinue therapy
100%
1012
1 log 2/3 logs
0,1%
108
0.0032% 107 106 105
Optimal Response to imatinib 400 mg per day
CHR within 3 months minor U n t i l t h e a c h i e v e m eWith n t oatf least MMR ( “ sCyR afe haven”)
also a patient with an optimal response c a n p r o g r e s s , b uPCyR t t h e rat i s k6i months s very low.
CCyR at 12 months MMR at 18 months
ELN reccomendations 2009; Baccarani et al. JCO 2009
Criteria for Failure and Suboptimal Response to Imatinib SWITCH Time (mo)
Failure
?? Suboptimal Response
Optimal
3
No CHR
No CG Response
95% Ph+
≥35% Ph+
≤35% Ph+
12
≥35% Ph+
1-35% Ph+
0% Ph+
18
≥5% Ph+
No MMR
MMR
Any
Loss of CHR Loss of CCyR Mutation CE
Loss of MMR Mutation
Stable or improving MMR
Baccarani et al. JCO 2009; 27: 6041-51
ELN recommendations in case of failure, intolerance, or suboptimal response to imatinib ● For patients who experience imatinib failure … drug therapy should be changed to dasatinib or nilotinib. (The detection of some mutations may help to decide between dasatinib and nilotinib.) ● For instances of intolerance, the choices are dasatinib and nilotinib. ● For instances of suboptimal response to imatinib...there is no solid, confirmed evidence that a change in treatment will improve the response, but there are at least two other options - namely an increase of imatinib dose or a change to a 2nd-generation TKI. ELN, Baccarani et al. J Clin Oncol. 2009; 27(35):6041-51.
Are all types of suboptimal response the same? Probably not! Cytogenetic and Molecular suboptimal responses are different
Cytogenetic Criteria for Suboptimal Responses to Imatinib 400 mg per day Time (mo)
Response Failure
Suboptimal
Optimal
3
No CHR
No CG Response
95% Ph+
≥35% Ph+
≤35% Ph+
12
≥35% Ph+
1-35% Ph+
0% Ph+
18
≥5% Ph+
No MMR
MMR
Any
Loss of CHR Loss of CCgR Mutation CE
Loss of MMR Mutation
Stable or improving MMR
Baccarani et al. JCO 2009; 27: 6041-51
Cytogenetic monitoring ELN 2006 Diagnosis
3 months (ELN 2009)
> 95% Ph-pos
6 months
< PCyR
12 months
PCyR
ELN reccomendations: Baccarani et al. Blood 2006 & JCO 2009
EFS by Response to Imatinib at 6 and 12 Months 281 pts; imatinib frontline (400 mg in 73, 800 mg in 208)
1.0
1.0
0.9
0.9
0.8
0.8
0.7
0.7
6 month response
0.6
12 month response
0.6
0.5
0.5
0.4
0.4
0.3
0.3 0.2
0.2 Failure Suboptimal Optimal
0.1
No. 9 10 240
Events (%) 6 (67) 5 (50) 14 (6)
Failure Suboptimal Optimal
0.1
p35%
124
87%
p-value 0.036
PFS According to BCR-ABL Level at 3 Monthsa Dasatinib 100 mg QD
Imatinib 400 mg QD
% Not Progressed
84% had ≤10% BCR-ABL
64% had ≤10% BCR-ABL
100
100
80
80
60
60
40 BCR-ABL at 3 months ≤1%
20
3-Year PFS ≤10% = 93.1% >10% = 68.2%
40
BCR-ABL at 3 months
20
≤1% >1–10% >10%
P=0.0003
>1–10%
3-Year PFS ≤10% = 95.9% >10% = 75.3%
P10%
0
0 0
6
12
18
24
30
36
42
0
6
≤1% 112 >1-10% 85 >10% 36
aCalculated
112 83 33
105 81 28
18
24
30
36
42
28 106 51
20 76 37
7 25 13
Months
Months Subjects at risk 98 93 81 79 22 19
12
89 75 16
60 52 11
24 21 6
≤1% 32 >1-10% 121 >10% 84
31 119 81
from total number of evaluable patients with PCR assessments at 3 months
30 116 71
Subjects at risk 30 29 112 108 59 56
OS According to BCR-ABL Level at 3 Monthsa Dasatinib 100 mg QD
Imatinib 400 mg QD
84% had ≤10% BCR-ABL
64% had ≤10% BCR-ABL 100
100
80
% Alive
80 60
60
40
40
3-year OS: ≤10% = 95.9% >10% = 85.9%
BCR-ABL at 3 months ≤1%
20
>1–10%
P=0.0348
0
6
20
>1–10%
>10%
0
18
24
30
36
42
0
6
Months ≤1% 112 >1-10% 86 >10% 37 aCalculated
112 85 37
Subjects at risk 110 109 106 84 83 83 35 34 33
P=0.0036
>10%
0 12
3-year OS: ≤10% = 96.0% >10% = 88.0%
BCR-ABL at 3 months ≤1%
12
18
24
30
36
42
30 116 70
28 96 55
11 33 20
Months
104 79 27
85 66 22
29 25 9
≤1% 32 >1-10% 122 >10% 85
32 121 85
from total number of evaluable patients with PCR assessments at 3 months
Subjects at risk 32 32 31 120 118 118 82 80 76
Molecular and Cytogenetic Response at 3 Monthsa P1-10%
40
CCyR
≤1%
20
CCyR ≤1%
0
n//N
198/235
154/239
≤10% BCR-ABL at 3 Months
171/210
148/221
PCyR/CCyR at 3 Months
BCR-ABL of 10% N=24
≤ 1% N=43
>1– ≤10% N=133
>10% N=88
MMR
n=120
n=89
n=24
n=41
n=133
n=88
by 1 year (%)
76
40
4
71
31
2
by 2 years (%)
89
67
29
78
52
20
n=144
n=89
n=24
n=43
n=133
n=88
by 2 years (%)
40
12
4
33
8
0
by 3 years (%)
50
18
4
53
14
1
CMR4.5
Evaluable patients (n) excluded patients with unevaluable/missing PCR assessments at 3 months, atypical transcripts at baseline, or patients who achieved response within 3 months