Aon Risk Solutions Construction Services Group
Surety Market Update and Forecast: 2015
Risk. Reinsurance. Human Resources.
Table of Contents
Introduction / Executive Summary. . . . . . . . . . . . . . . . . . . . . . . . . 1 Construction Industry Review: Improving Economic Results Leads to Demand for Talent. . . . . . . . . . . . . . . . . . . . . . . . 1 Margin Enhancement and Risk Management . . . . . . . . . . . . . . . . 2 Surety Industry Review: Ample Capacity, while Talent Demand Mirrors Contractor Issues. . . . . . . . . . . . . . . . . . . . . . . . . 3 Subcontractor Default Insurance (SDI) Market Performance . . . . 4 Critical Marketplace Dynamic: Public-Private Partnerships. . . . . . 4 Legal Implications of Industry Evolution . . . . . . . . . . . . . . . . . . . . 5 Summary: 2015 Construction and Contract Surety Market Outlook. . . . . . . . . . . . . . . . . . . . . . . . . . . . . . . . . . 5 About Aon Construction Services Group. . . . . . . . . . . . . . . . . . . . 5
Introduction / Executive Summary The surety market is stable and the construction economy is improving. We do not foresee a dramatic change in market behavior in 2015. However, there are a number of subtleties in market dynamics and emerging trends that are important to consider in formulating strategy and staying ahead of the field. Surety issues that dominate discussions with clients and underwriters include economic opportunities, joint ventures, alternative project delivery methods, subcontractor default risk management, talent acquisition, margin enhancement, surety capacity, surety rates, and global competition. We will explore each of those topics here in our 2015 Surety Outlook and Commentary.
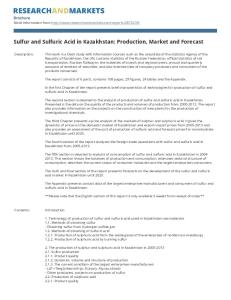
Construction Industry Review: Improving Economic Results Leads to Demand for Talent Economic activity in the construction segment has improved over the past 12 to 18 months. The US Census “Put in Place” construction factors are up 3.3% over last year and 11.3% over the last two years. Private spending is up 3.4% with office, healthcare, commercial, and manufacturing seeing double digit growth. Public spending is up only 1.7%, driven by education facilities up 9%, while street and road construction is down 1.7%. U.S. construction spending from 1993 to 2014, by sector (in billion U.S. dollars) 1000 912
Value of construction in billion U.S. dollars
870
863
771
800
759 698
675 621
588
535 453 401
578 501 502
478
409
358
200 127 130
0
627
575
600
400
638 634
140
147 153 155
169
181
202 213
234 216 220
255
289
309 315 304
286 279 271 273
1993 1994 1995 1996 1997 1998 1999 2000 2001 2002 2003 2004 2005 2006 2007 2008 2009 2010 2011 2012 2013 2014
Years Private Sector
Public Sector
Residential construction activity has been an important component of overall construction spending. It peaked in 2005 at $668 billion, when it was 59% of the overall construction economy. It bottomed out in 2010 at $229 billion, when it represented less than 30% of the construction spend. In 2014 it had rebounded to $359 billion, up 20% over two years and is now 37% of the construction annual spend. This includes both single family homes construction as well as multi-unit residential projects such as apartments and condominiums.
Aon Risk Solutions
1
Unemployment Rate – Construction Industry, Private Wage & Salary Workers
25
Unemployment rate
20
15
10
5
Jan '04
Jan '05
Jan '06
Jan '07
Jan '08
Jan '09
Jan '10
Jan '11
Jan '12
Jan '13
Jan '14
Year
As construction economic activity has improved, we often hear challenges to find good people at all levels in the construction and surety business. Organizations were forced to reduce overhead during the slowdown, and now need to rebuild their teams as activity picks up. Construction unemployment peaked in 2010 at 20.6%. In October 2014 construction unemployment had fallen to 6.4%, as outlined in the graph above. Recruiting experienced field labor and project management resources is a primary challenge in the fastest growing markets, such as general building in New York City, Boston, South Florida, California, and Texas. The large I-4 project in Orlando has increased costs for project labor in that market, as we have heard of salary increases at more than 25% compared to the time before the project was awarded. This dynamic also presents itself in several cities in Texas and Southern California due to major road projects. We are also seeing gaps in the executive management level at firms of all sizes. Some of these openings are driven by continuity, but others result from growth and investment from global companies in the American market.
Margin Enhancement and Risk Management Despite pressure from increased competition, margins are modestly up in the private general building
Recently, no fewer
market from 1%-2% to 3%-4%. Risk management products such as contractor controlled insurance
than 10 firms bid
programs (CCIP) and subcontractor default insurance (SDI) are an important margin enhancement tool that can be employed while mitigating risk for larger contractors. In the subcontractor market, margins are again moving into the low double digits in the more active geographic markets. The large road and heavy civil market margins remain under pressure. Contractors have capacity and public owners remain budget constrained. As a result, most of these firms are finding it difficult to raise margins. On jobs under $100 million, margins are in the mid-to-upper single digits. Finally, for the largest projects, particularly those with alternative financial models (e.g. P3 and Design Build Finance (DBF)), margins improve slightly to the low double-digit range. Specialty trade contractors are seeing a return to double-digit margins, particular in the “hot” private general building markets.
2
Surety Market Update and Forecast: 2015
on a complex, $300 million heavy civil infrastructure project in New York City.
Surety Industry Review: Ample Capacity, while Talent Demand Mirrors Contractor Issues The surety industry continues to report highly profitable results and modest top line growth, based on an
A recent project
increase in construction activity. The Surety and Fidelity Association of America (SFAA) results through the
with an estimated
third quarter of 2014 reflect the continued favorable loss trends seen in recent years, with an overall loss ratio of 15%. Market share is concentrated with the leading 10 carriers, which control close to 65% of all
$2 billion value
premium placements. For contractors with revenue in excess of $100 million, the market for contract surety
required a 100%
is even more concentrated in the five largest carriers.
payment bond and
In the “olden days” of the mid-2000s, single bond capacity was restricted around $250 million. Today the
a 50% performance
surety companies do not have issues with writing bonds in excess of $2 billion. As an example, a recent project
bond. Despite the
with an estimated $2 billion value required a 100% payment bond and a 50% performance bond. Despite the
project’s valuation,
project’s valuation, the surety industry responded without issue or concerns as to the value of this endeavor.
the surety industry
One key consideration for large bonds is a strong joint venture (JV) team. Sole ventures typically top out
responded
somewhere around $500 million, depending on project type: general construction (higher threshold –
without issue.
less self-performance), or heavy civil (lower threshold, more self-performance). Heavy civil projects tend towards JVs driven more by construction industry risk management practices (check estimate, share people and equipment resources, shared cash flow) than surety requirements. Fully integrated JVs are the norm, as opposed to line item JVs. As JVs have increased in size and have longer durations, there is a growing need and trend to allow for monthly or quarterly distributions to cover some portion (perhaps 50%) of the overhead costs of respective partners. We are seeing this being negotiated more often into JV agreements. Surety risk is materially lower in a JV, based on the joint and several obligations within the partners, yet the industry does not discount rates for JVs. Aon is advocating change in 2015, with stronger consideration given to the enhanced risk structure of JVs that should be reflected in pricing discounts. Reinsurance for the surety line is readily available on favorable terms, in part fueled by alternative capital
Contractor bond
flowing into reinsurance in search of a better return, and profitable surety results. We are seeing new
rates are not
participants (e.g. Berkshire Hathaway), and increased risk appetites from current carriers. Contract surety loss ratios are about 10 points higher than non-contract surety (commercial bond products). Our team
increasing – in fact,
is aware of contractor difficulties currently being managed by surety claim departments which may
we see pressure
ultimately result in a single significant loss. However, even with this looming issue, which has the potential
to lower rates and
to generate a loss in excess of $100 million, we do not foresee a dramatic change in market conditions.
expect that trend
Contractor bond rates are not increasing – in fact, we see pressure to lower rates and expect that trend to continue, simply based on supply and demand factors along with profitable results.
to continue.
The surety industry is also seeing competition for experienced talent at the underwriter and broker level. Many of the larger surety companies have reinvigorated their training programs in an effort to have the people resources to support their business opportunity. We have seen the entrance of new market participants to contract surety and their staff is coming from the top five surety carriers. We have also seen new surety agencies created by staff departing larger surety brokers. This makes it more challenging to have the experienced talent needed to manage more complex contractual risks, financial procurement models, and larger projects by the surety industry. Surety companies that benchmark client financial conditions continue to see strong balance sheets and significant cash positions, so there are a number of very healthy construction firms with plans for growth. This will keep pressure on retaining and attracting top talent.
Aon Risk Solutions
3
Subcontractor Default Insurance (SDI) Market Performance The Subcontractor Default Insurance (SDI) market traditionally provides a risk transfer mechanism for larger
Contractors have
($750 million and more in annual revenue) general contractors to protect against the peril of subcontractor
been investing over
default. In recent years, new providers have entered the market creating some competition. One area that has changed is that middle market contractors, (e.g. $200 - $500 million in annual revenue) have been able
the years in better
to find SDI product offerings available. The SDI market is geared towards building trade subcontractors
pre-qualification
with contracts generally under $3 million, although the product can handle larger subcontractors. It is not
practices and
designed to meet the needs of the heavy civil contractor business.
underwriters have
General contractors and underwriters of the product line are seeing an increase in loss frequency, particularly
intensified their
relative to contracts signed in 2010, one of the worst times in the recent construction economic cycle. The
requirements.
frequency of claims is related to performance, e.g. being behind schedule, poor quality, etc., rather than financial default. Contractors have been investing over the years in better pre-qualification practices and underwriters have intensified their requirements. However, terms and conditions for this product line remain stable, despite relatively high-profile defaults in the third quarter of 2014.
Critical Marketplace Dynamic: Public-Private Partnerships The public-private partnership (P3) procurement model resulted in five closed deals in the United States
The pipeline for
in 2014, with a combined value of $4 billion. The pipeline for 2015 P3 deals is robust with 15 deals in the
2015 P3 deals
procurement process, totaling $15 billion in construction and representing 6.4% of infrastructure project spending in the U.S. About half of the domestic P3 deals include long term Operations and Maintenance (O&M) contracts, reflecting the American trend towards the public entity retaining long term O&M
15 deals in the
responsibility. In other countries that have made use of the P3 model, the percent of O&M is much higher.
procurement
Several states, including Virginia, Texas, Florida and Indiana led the initial P3 charge. Given their positive
process, totaling
results, more states seeking public infrastructure financing solutions, e.g. Pennsylvania, Massachusetts, and North Carolina are getting into the game. The inability to find a bipartisan consensus on a long-term solution to the Highway Trust Fund increases the momentum of P3 procurement solutions. The gas tax has not been increased since 1993, so the Infrastructure Trust Fund requires emergency funding from the General Fund every two years. This
$15 billion in construction and representing 6.4% of infrastructure
prevents a longer term view of financing public infrastructure. We expect the trend towards P3 to continue
project spending
in the United States, forming a meaningful market share of larger projects.
in the U.S.
While the largest 2014 domestic P3, the $2.3 billion I-4 Ultimate Interchange project in Orlando, required a $750 million performance and payment (P&P) bond, not all P3 projects require traditional bonds. These projects are financed by private sources of capital. Lenders are more concerned about delay risk than default risk. It is often critical for projects to have a timely completion to initiate the flow of cash to re-pay debt. Examples include toll revenues and government availability payments. As a result, lenders insist on the performance security providing immediate liquidity to potentially meet debt payments during a delayed construction completion. The surety industry is engaged through their trade organization to promote the requirement for P&P bonds on P3 projects in the U.S. They emphasize the payment bond protection for labor and material, the total backlog perspective of the surety, and their experience of managing a contractor default. In addition,
4
is robust with
Surety Market Update and Forecast: 2015
they are engaged in product development to adjust their standard product to also address the delay risk concerns of lenders and the bond rating agencies. Bond forms that include an accelerated dispute resolution process for bond claims and liquidity sub-limits are being considered. The Canadian market has seen more activity on these new P3 products. In fact, a small number are being used on closed deals to meet the needs of the owner, lender, and contractor with increasing frequency. We expect this product evolution to continue in both the Canadian and US markets as alternative financing grows.
Legal Implications of Industry Evolution The owner’s legal community and contractor and surety legal departments have been engaged in longer
With some market
negotiations around contract terms, such as damages, delays, warranty, and maintenance obligations.
improvement
Bond forms are also being negotiated. We often see requests to modify the standard AIA bond forms. During the worst parts of the slowdown, owners and specialty law firms became more aggressive in
comes the
expanding contractor risk via warranties, damage clauses, delay clauses, and financial risk in contracts. With
contractor effort
some market improvement comes the contractor effort to swing back the legal pendulum. P3 contracts
to swing back the
have created some of the bigger challenges as the basic premise is for the developer special purpose
legal pendulum.
vehicle (SPV) is to push as much risk as possible to the design build construction joint venture (DBCJV), in order for the SPV to have an optimal risk profile. This facilitates borrowing construction funds at the lowest debt cost. This dynamic is distinctly different than in the past, when particularly public contracts were fairly standard. The US P3 and DBF market is slowly working itself to more standards after several years of working towards the optimal contractual and performance security solutions.
Summary: 2015 Construction and Contract Surety Market Outlook Our outlook for 2015 for the construction and contract surety marketplace calls for a continued uptick
We see the surety
in construction activity. We see the surety market remaining competitive and capacity and options for
market remaining
contractors to be favorable. Contract surety loss frequency and severity will develop negatively, but not suddenly or dramatically affecting availability. Attracting and retaining executive and field skill personnel
competitive
will be a high priority challenge for contractors, surety companies, and specialty surety brokers and
and capacity
agencies. Alternatively financed projects (P3, DBF) will also grow as a share of the construction market.
and options for
Global companies will continue to invest in the US market, and acquire US construction companies, particularly in “continuity” situations where there is a generational leadership transition. Construction
contractors to be favorable.
related insurance products such as SDI and CCIPs will be an important component of particularly the general contractor market. The heavy, civil, transportation segment will see modest margin improvement and backlog opportunities, primarily as a function of public infrastructure funding challenges. General contractors and specialty trades will experience better margin and backlog market conditions.
Aon Risk Solutions
5
About Aon Construction Services Group Aon’s Construction Services Group is the preeminent provider of risk and human resources solutions to general and specialty contractors, project owners, and industry stakeholders. As the segment leader, Aon provides an unparalleled platform to serve the risk management needs of global contractors, an expansive network of offices to support service delivery for specialty firms and infrastructure projects, and the risk management industry’s leading global capabilities, delivered through colleagues who specialize in risk management for construction. Our Surety team is the industry leader, with 145 North American colleagues developing solutions for contract and commercial bonding needs. Annually, we place in excess of $345 million in surety premium on behalf of our clients. For more information, contact your Aon account executive, visit us at aon.com/construction, or follow us on Twitter (@AonConstruction).
6
Surety Market Update and Forecast: 2015