AUA Working Paper Series No. 1 October 2012
Straw potential for energy purposes in Poland and optimal allocation to major co-firing power plants
S. Rozakis†, D. Kremmydas, Department of Agricultural Economics and Rural Development, Agricultural University of Athens, Iera Odos 75, Athens 11855, Greece R. Pudelko, M Borzęcka-Walker, A. Faber Department of Agrometeorology and Applied Informatics, Institute of Soil Sciences and Plant Cultivation (IUNG), State Research Institute, Czartoryskich 8, 24-100 Puławy, Poland
†
Corresponding author,
[email protected]
A newer version of this paper has been published on Biomass and Bioenergy (2013), 58, pp. 275-28
Agricultural University of Athens · Department of Agricultural Economics & Rural Development · http://www.aoa.aua.gr
Straw potential for energy purposes in Poland and optimal allocation to major co‐firing power plants S. Rozakis, D. Kremmydas, Department of Agricultural Economics and Rural Development, Agricultural University of Athens, Iera Odos 75, Athens 11855, Greece R. Pudelko, M Borzęcka‐Walker, A. Faber Department of Agrometeorology and Applied Informatics, Institute of Soil Sciences and Plant Cultivation (IUNG), State Research Institute, Czartoryskich 8, 24‐100 Puławy, Poland Abstract. Agricultural waste and especially straw can provide a significant share of biomass energy. However, due to the nature of agricultural production, the need for carbon sequestration in soils and other aspects of food production, only part of straw potential may be treated as waste and spent on energy production. Based on statistical data from Polish Central Statistical Office (CSU) was modelled on a scale of local districts (NUTS‐5) the actual production of straw, the needs of its local use and the possibility of redistribution of excessive quantities to regions with a deficit of straw. As a result the straw surplus that could be used in the energy sector was obtained along with its geographical distribution. Next a cost‐minimizing transport model is used to optimise straw allocation among main power plants all over the country taking into account capacities and technical constraints of co‐firing biomass with coal. Results are detailed at the municipal level indicating excess capacity for biomass co‐firing by plant and region to be satisfied by additional biomass sources such as biomass from forest or energy plantations. Keywords: Straw potential, Poland, GIS, co‐firing, transport models
1. Introduction Crop residues are considered a flexible biomass source for heat and electricity in rural areas. Energy production from crop residues depends on produced quantities and concentration, on available conversion technologies as well as on the regional characteristics concerning supply and demand. Straw for energy is included in the European policy of renewable energy sources use (Directive 2009/28/EC). Currently in Poland, industrial use of straw for energy purposes is regulated by the current legal status of biomass (Dz. U. 2010; Dz.U. 2012). As a matter of fact legal considerations play a significant role in shaping biomass for energy picture however effective biomass use will be determined by technical and economic efficiency. Indeed, among the documents relating to sustainable use of biomass, the European Commission (COM/2010/0011) clearly set the efficiency of biomass conversion to energy priority and technology to deliver an increased preference for reducing carbon dioxide emissions compared to conventional fuels. De and Assadi (2009) have analysed pilot plant tests in existing coal‐ 1
fuelled utility boilers concluding that cofiring of biomass with coals is an appropriate option for low investment CO2 reduction and that the economic feasibility of biomass co‐firing will mostly depend on relative cost of coal and biomass supply. Straw, as a waste of food production is an attractive source of biomass, which can effectively complement from perennial crops biomass (Allica et al. 2001; Pudelko R, et al. 2012), especially in the summer and autumn months. Estimates of straw potential in Europe were carried out by the JRC (Edwards et al. 2005) as well as during scientific projects such as ReNew, BEE, CEUBIOM and BioBoost. However, previous analyses of straw resources do not seem to be sufficiently completed because of scale inconsistencies or modelled types of assortments. This applies especially in case of studies conducted for large European countries as Germany, French and Poland which have a high theoretical potential of this source. Straw is also used to meet needs of agriculture and livestock breeding at the first place. Its technical potential is estimated as the difference between straw production (resulting from the production of cereals) and those quantities needed by other agricultural activities (animal feeding, mulching and improving the humus content in soil) as well as the necessary amount for the agricultural industry (e.g. mushroom). Preliminary analyses of straw potential in Poland showed large regional differences in the availability of this material (Kuś et al. 2006; Bal 2008; Harasim 2011). The larger regions with a significant deficit of straw were pointed out but also, some regions with high local (intra‐ regional) variability, which means the occurrence of local districts in the immediate vicinity with the surplus and deficit straw. Ghilardi et al. (2009) that analysed fuelwood supply/demand imbalances in Mexico pointed out that they must be calculated at the finest possible level (locality by locality basis) to avoid gross under or over‐estimations of biomass potential for energy purposes. Recent studies on straw use for energy are either site specific (Kuś et al. 2006) or aggregate at the country level (Scarlat 2010, Nilsson, 2006, Jasiulewicz 2010). Berggren et al (2008) have conducted comprehensive analysis on solid biomass for heat and electricity in Poland through mathematical programming using data on biomass supply at the regional level (NUTS‐2). In this track, taking benefit from original work undertaken in IUNG on straw surplus and deficit in the municipal level (NUTS‐5), the present study aims at estimating the share of straw in satisfying biomass demand by major power plants. As Ericsson (2007) points out co‐ firing in the large pulverized fuel boilers is technically and economically the most realistic option for Poland even if CHP plant present environmental advantage. First, optimal redistribution among neighbouring local districts is attempted minimizing distances travelled. Then once local use for energy in grate boilers is deducted, a cost‐minimizing model redirects remaining straw towards power plants in order to match supply to demand. The degree of coverage is estimated for each demand unit indicating requirements for other biomass sources such as wood and perennial plantations. 2
2. Materials and Methods 2.1 Estimating straw biomass potential for energy Poland has abundant bioenergy resources among them agricultural and food industry as well as forest timber waste. Cereal crops dominate arable agriculture producing straw at large quantities. The straw potentials have to be estimated for a wide range of plants: wheat, barley, triticale, rye, oats, mixed cereals, maize, rapeseed, turnip rape. This broad list takes into account all kinds of plants leaving the straw, potentially usable for energy purposes. Not all crop residues can be used for energy purposes, for instance root crops such as potatoes and sugarbeet produce a small amount of biomass. Estimates of the availability of straw must take into account its primary use in agriculture for soil fertilisation (Scarlat 2010; COGAP 2004), animal husbandry (Edwards et al. 2005; Scarlat 2010), and soil improvers in the carbon (Kuś et al. 2006; Borzęcka‐Walker et al. 2011, ), which is now seen as one of the processes of climate change mitigation (Kozyra et al. 2009). A significant proportion of the straw resources are also used for mound covering, bedding mats preparation in horticultural farms, insulation of buildings and food industry especially mushroom production. As Iglinski et al. (2011) mention since 1983 there is an overall straw surplus that varies in the order of magnitude of a few million tons countrywide amounting at a high of about 10 Mt during the period 1995‐2001. An effective way to manage this surplus had to be sought, one of the possible solutions could be for energy generation purposes. Taking into account that Polish energy plants are basically fuelled by coal and that its heating value ratio to straw biomass is roughly equal to 1.5 straw could not only heat houses and buildings in agricultural areas but also to be used in boiler at the community level or bigger power plants. The schematic modelling process of surplus and deficit of straw for each NUTS‐5 unit is shown on the Figure 1. 2.2 Surplus and deficit of straw in NUTS‐5 level in Poland The calculation was based on data coming from the Central Statistical Office (CSO) of Poland, which were collected during the Agricultural Census in 2002. In 2010, the census has been updated, but still data at the NUTS‐5 level is not available. However, a comparison of statistical data on agricultural production in 2002 and 2010 for NUTS‐2 shows no significant differences that would affect the result obtained in the performed modelling. The data about sowing area and feedstock were collected for NUTS‐5 and the average yield was collected for NUTS‐2 level. NUTS‐5 in Poland is the smallest administration unit called ‘gmina’ (municipality). In total there are 2489 gminas that belong to 16 regions. The regional administrative unit called ‘wojewodztwo’ (voivodship or region) is equivalent of NUTS‐2 in the European coding. Table 1
3
presents descriptive statistics of NUTS‐2 and NUTS‐5. All target statistical and spatial analysis were conducted for 2171 rural NUTS‐5 regions. Table 1. Spatial and statistical characteristic of NUTS‐2 and NUTS‐5 Indicator / Administrative Unit
NUTS-2
NUTS-5 (rural)
Units # Average area (1000 ha) and /SD*/ Average arable area (1000 ha) and /SD/
16 1948.4 /659.7 766.6 /349.6/
2171 13.4 /7.4/ 4.0 /2.8/
LHI (1000 units) and /SD/
459.6 /327.7/
3.4 /2.8/
*Standard deviation
Figure 1. Modeling process for straw biomass potential using GIS Yield of straw for each area and type of crop is estimated using data on cultivation area, cereals yield and the grain‐straw ratio in particular year. The ratio between grain and straw varies for different crops. It is assumed that the ratio for rye and oat equals 1.1; for triticale, spring triticale, maize for grain, oilseed rape and turnip rape plants to seeds 1.0, and for winter wheat, spring wheat, spring cereal mixtures 0.9 (Kuś et al. 2006). Then collection of straw is determined as result of multiplying of straw yield by sowing area. Those calculations are performed for each group of plants, and presented as the theoretical straw potential. 4
The theoretical straw potential cannot be used in total for energy purposes; a significant part of this bioenergy source is used for various other purposes. Some straw resources have to be used for animal feeding, animal bedding and some have to be returned to soil for conservation purposes. There are also other uses that are site or country specific and have to be taken under consideration. For example in Poland straw is used by agricultural factories for mushroom production. To assess the amount of straw needed for livestock purposes Large Heads Index (LHI) can be used. Large heads index is a standard measurement unit that allows the representation of the various types of livestock in order to enable them to be compared. For the calculations it is assumed that the use of straw for bedding in 1.5 tons, while for feed consumption of one LHI per year is 1.0 ton. A certain part of straw must also be allocated for the conservation of the soil organic matter (SOM) for the compensation of the resulting losses of SOM, from the crop cultivation; this can be achieved by fertilization with manure or other organic fertilizers as well as by incorporating straw to the soil. To calculate the amount of straw needed for soil quality conservation purposes we use assessment given by Kuś (2006) for NUTS‐2 regions. Straw demand for soil conservations was downscaled using CSO data by proportionally to saw areas redistribution. The last stage of calculation the technical straw potential is to reduce the potential of the available biomass, by the straw used for the production of substrates for mushroom production. The agricultural data was obtained from the CSO database. Values of NUTS‐2 were proportionally redistributed to arable area in each NUTS‐5. This is illustrated in Table 2 for one area NUTS‐5 (id: 0201022) . Table 3 summarised calculation of straw uses for NUTS‐2. 5
Table 2. Illustration of calculation of straw surplus/deficit at the NUTS‐5 level (id: 0201022) Crops
rye oat mixed cereals wheat barley triticale rape maize
LHI (heads)
Sown area
Yield
Ratio grain/straw
Straw yield
ha 837.4 582.0 378.5
t/ha 2.98 2.95 3.02
# 1.1 1.1 0.9
t 2741 1890 1028
3712.8 908.8 173.6 713.0 839.4
4.48 3.54 3.55 2.61 6.25
0.9 0.8 1 1 1
14976 2571 616 1863 5245
1472
t/LHI 1 1.5
animal feeding ratio animal bedding ratio
Straw required for SOM reproduction t 1789 1233
Straw (from fields)
671 9774 1678 402 1216 3423 total for 0201022
357 5202 893 214 647 1822 10744
animal feeding animal bedding mushroom production NET total for 0201022
1472 2208 1504
t 952 656
5560
Table 3. Straw potential and competitive uses in year 2002 (in 1000 tons). NUTS‐2 Straw Straw for animal Straw for Straw for Straw for 1 2 yield animal bedding soil conser‐ food energy feeding2 vation3 industry2 purposes dolnośląskie kujawsko‐pomorskie lubelskie lubuskie łódzkie małopolskie mazowieckie opolskie podkarpackie podlaskie pomorskie śląskie świętokrzyskie warmińsko‐mazurskie wielkopolskie zachodniopomorskie
2358 2328 2403 606 1586 729 2657 1592 734 1237 1447 602 682 1554 3800 1762
194 665 589 103 572 335 1063 209 244 695 325 162 254 458 1287 191
292 997 883 155 858 503 1595 314 367 1042 487 343 382 688 1931 286
1342 0 268 232 0 0 0 436 4 0 0 0 0 0 0 757
100 100 0 100 200 0 100 0 0 0 0 0 0 100 200 100
429 565 662 15 ‐44 ‐109 ‐102 631 119 ‐500 634 196 45 307 382 427
Source: 1 Central Statistical Office (CSO); 2 Calculated based on CSO; 3 Kuś et al. 2006 2.2 Redistribution and Transport model 6
The transportation of the biomass of the biomass available for energy to the intermediate or final locations is a significant part of the modelling process for any biomass to energy project. The transportation modelling is project‐specific and many different variations exist in the literature, for example Panichelli and Gnansounou (2008), Moller and Nielsen (2007) and Rogers and Brammer (2009). Generally transport cost is minimised subject to supply, flow and demand constraints. Four major types of costs can be distinguished, namely opportunity cost, collection, road‐siding and pre‐storage cost. In order to estimate cost of delivered biomass at the power plant gate, the transportation cost from the storage site to the conversion plant has to be added to the previous elements. The opportunity cost expresses payments required to make residues available for collection. This cost is one of the most uncertain items involved in the feasibility study of agricultural residues for energy purposes. It can identify to the value of willingness of the farmer to offer the straw residue and it is related to alternative uses and expected benefit from them. As explained in the previous section we consider that all other than energy straw uses pay a higher price and only spare straw can be available for energy. To avoid double counting we assume zero opportunity cost in this exercise. To estimate the cost of residues handling, it is assumed that a machine pool performs the required operations. Main features of the machinery costs are fixed costs (interest, purchase value, insurance and shelter) and operating costs (fuel and lubricants, maintenance, repairs and labour). Fixed cost reported to units (hectares or tons) is dependent on time available for handling operations. Material losses or benefits (decrease of wet matter in biomass) during pre‐ storage have to be taken into account. For a full account of pre‐treatment costs of biomass designated to energy and especially co‐firing see Maciejewska et al. (2006). Due to various factors (meteorological conditions etc.) available time varies across regions resulting in site specific costs for the residues (Kallivroussis et al. 1996). Typical cost structure calculated by these authors give the following image: baling 50%, road‐siding 25%, loading 5% and average transport 20%. Beside available time reported above that may cause up to 30% variation to baling cost, farm size can also cause baling cost variation. In Poland, straw is produced in various farms, sized between 10 ‐20 ha (average area in NUTS‐2) in Western Poland and 4 – 12 ha in Eastern Poland. The size of the farms affects the efficiency of collection and handling and consequently determines their price at the farm gate. Handling and collection costs are related to the farm size moving downwards for big farms up to 30% whereas transport cost is negatively related to the travelled distance. More recently the cost of production of straw has been assessed at 85€/t DM and miscanthus at about 90€/t DM by the French research Institute Arvalis [cited by Jacquet et al. 2008]. Transportation cost at 0.18€ per 7
kilometer per ton. Corn stover production cost has been estimated at 42€/t DM including collection, baling, wrapping, nutrient replacement, and storage. Details based on the US situation are analysed in Brechbill and Tyner (2008). Rogers and Brammer (2009) thoroughly analysing transport costs of biomass in the UK suggest a fixed component of about 0.70 pounds /GJ plus variable cost depending on distance varying within 0.15‐0.19 pounds per GJ per km. Having calibrated the previous figures to Polish conditions we assume an overall variable transport cost of 0.15 euro/t/km. Prices paid for solid biomass in Poland reported by Nillson et al. (2006) amount at about 10 PLN/GJ. Using an exchange rate of 4 PLN/EUR and considering that straw in Poland has a lower heating value (LHV) of around 14‐15MJ/kg, it corresponds to 35‐37.5 EUR/t thus around 40 EUR/t in current prices. For short distances, transportation can be carried out by existing tractor‐trailers. Its cost comprises loading to the engine and it is decisively affected by distances from the origin point to destination. The calculation of the transportation cost can be very analytical and a good example can be found at Rogers and Brammer (2009). Since the estimation of straw biomass potential results in some areas having positive and others having a negative potential, it is sensible to assume that neighbouring areas will balance their surpluses and deficits of straw biomass (phase 1). This balancing will take place by transporting straw quantities from surplus areas to nearby deficit areas. Afterwards the remaining straw biomass will be available for being transported to energy plants. We name these two phases as redistribution and transportation phase. The factories that can accept the surplus straw on the transportation phase are either small plants with grate boilers (phase 2.1) either nig coal or lignite powered power plants (phase 2.2). Both phases constitute stylized transportation problems. The algebraic representation of the transportation problem is typically presented in a format similar to the following:
8
min h Rj CHCi xij l vij cij dij xij j
j
i
j
CHCmin _ if _ areai areaceiling CHCi areai areamin CHCmax CHCmin _ if _ areai areaceiling CHC max areamax areamin s.t.
v q
Si , i
v q
Dj Rj , j
ij
ij
j
ij
ij
i
xij 0 , xij where i is the set of areas with a straw surplus and d the set of areas with a straw deficit h is a constant given a big number related to l. It expresses the cost (in €) of keeping quantity Rj (tn) to area j. CHCi collection and handling costs for each i Areai average arable area by farm for each i vij is a binary coefficient that is equal to 0 when the distance between areas i and j is reasonable enough for transportation, otherwise it is valued 1 cij is the cost per kilometre per t for transporting 1 kg from area i to area j (€ x km‐1 x tn‐ 1 ) dij is the distance between area i and area j (km) xij is the quantity transported from area i to area j (tn) We use the same formulation of the problem both for the redistribution and the transportation phase. For conducting spatial modelling Geographical Information Systems (GIS) were used to feed a database that supports the optimisation module of the Decision Support System (DSS) for bio‐energy decision‐making which was adapted to Polish conditions (Rozakis, 2010). 3. Results and discussion 3.1 Matching supply and demand of straw to determine straw‐to‐energy potential The technical potential of straw for Poland amounted at 3.7 M tons (Table 3). The good management of straw, ensuring its sustainable utilization for agriculture and non‐farm usage requires a redistribution of about 2.5 M tons between neighbouring NUTS‐5. Full redistribution of straw after providing cover for deficits in NUTS‐5 units provides the best utilization in agricultural practice. This applies mainly to the soil conservation. The benefits of straw 9
fertilisation include: enriching soil organic matter, increasing the nutrient content of the soil, increase soil microbial activity, reduce nitrate leaching, improving sorption capacity of the soil, beneficial impact on the structure of the soil and water management and reducing the risk of water erosion and wind (Harasim, 2011). For these reasons, attempts should be made to the headline straw use in agricultural production. Moreover, Poland is a country with a dominant share of the light and very light soil. The use of straw as a fertilizer in this case significantly increases the effects of improving the quality and fertility of the soil. In the last 15 years the balance of organic matter in Polish arable land has noticeably deteriorated and has a negative value. This is due to a decrease in both the surface of crops enrich the soil with organic matter (plants, legumes, grasses) and the volume of production (consumption) of manure. This condition is clearly visible in the surplus and deficit straw (Figure 2). The local districts with excess straw, correspond to regions dominated by crop production with little participation animal husbandry (wielkopolskie, kujawsko‐pomorskie, pomorskie, dolnośląskie). These regions are characterised by the large‐scale farms. This facilitates the straw logistics optimisation, which can be transported in bulk from each farm. Large surplus of straw is noted also in lubelskie. However, in this region, farms are much smaller. The map shows also high spatial variability of straw distribution. There are many NUTS‐5 with straw demand which is close to regions with great surplus of this feedstock. The total straw potential can be estimated as 3.7 M tons (net surplus), but there are 825 NUTS‐5 (out of 2171 countrywide) with deficit which should be covered by import 2.5 M tons of straw from neighbourhood (Table 3 and 5).
10
Figure 2. Surplus and deficit of straw at the NUTS‐5 level
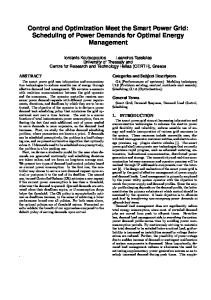
Figure 3. Relationship between quantity transported and maximum distance allowed At this stage we attempt to allocate surplus to deficit areas minimizing transport distance. The distance for this phase was calculated between NUTS‐5 areas centroids and were computed on a GIS system. In the following diagram the relation between the redistribution threshold distance and the quantity moved from surplus to deficit areas is depicted. Assuming that trailers are used for transport a distance of 30 km is a reasonable limit for transferring straw between farms in the redistribution phase. So in the process of redistribution 1.2 Mt was re‐ located to the closest NUTS‐5 with straw deficit. That is around 20% of the total quantity of 11
straw surplus. The average distance between the transportation areas was about 18 km. If maximum distance is raised to 40 km, quantity moved is increased to over 1.5 million tons of straw. We also make the assumption that for the current phase the unitary cost per km is constant, since the transportation is expected to take place with equipment that is already owned by the farm and used in various other activities. After solving a transport model minimizing total cost straw availability for energy purposes at the NUTS‐5 level is determined. The map in Figure 4 is generated based on values of surplus and deficit that were obtained after the transport model optimisation. The spatial differences in the availability of straw were found and it has allowed the identification of clusters, with straw available for energy purposes. Regions R2, R3, R4 and R5 are potential areas with favourable conditions for the location of power plants producing electricity and heat for the local needs. After the redistribution process there is still a stray surplus which can be transferred to energy plants for co‐firing and electricity generation. In this phase, five major concentrations of straw surplus (R1, .., R5) were determined as well as three smaller ones but still important because of its location (r1,..,r3).
Figure 4. Results of straw redistribution 3.3 Matching straw potential for energy purposes with demand for co‐firing R1 – this region is situated in the close neighbourhood of the Upper Silesian Industrial Region. Cause of this there is the great request for biomass by the power generation system and CHP 12
power plants. All surplus of straw from western NUTS‐5 of (opolskie) probably will tend to the eight power plants which are located in a radius up to 80 km. R2 ‐ almost whole area of ‘lubelskie’ voivodinship. This NUT2 is characterised with good soil conditions but farms are quite small (average 6.4 ha) and dispersed. In this region there are four medium size (50‐400 thousand people) cities (Lublin, Zamosc, Chelm, Biała Podlaska) which can be potentially interested in obtaining straw for heat and power production. R3 – wielkopolskie and kujawsko‐pomorskie are agricultural regions of Poland specialising in wheat, rape and potatoes production. R3, R4 and R5 regions are good for locating local power plants. The other three small regions (r1, r2, r3) are located in the immediate vicinity of important power plants. Therefore are the potential resource bases for them. Two options have been recognized for co‐firing the remaining straw for electricity generation primarily local small grate boilers and then large coal fuelled power plants (Ericsson, 2007). The total grate boiler capacity for burning biomass has been obtained from Berggren (2008) at a resolution of NUTS‐2 level. At this stage we allocate proportionally the surplus of each NUTS‐5 area to its NUTS‐2 local boilers. The results of this process are included in Table 4. The remaining straw will be sent to large coal or lignite power plants minimizing total cost of the biomass at the factory gate. This is the sum of two components. Firstly the cost of straw at the farm gate that increases with decreasing average arable area of the corresponding NUTS‐5 land unit It represents harvesting collection and handling costs and varies from 30 to 40 euro per ton. Then the transport cost to the factory that depends on the distance from the surplus area is calculated based on 0.15 euro per km per ton. The farm gate cost for NUTS‐5 areas that are more effective on producing straw results in higher ratios for selling straw even at longer distances. In the following Table 4 we can see the average farm gate and transport costs as well as marginal straw costs by power plant. We have computed the national road network distances from the surpluses areas to the 20 factories using ArcGIS network module. There is a strong evidence for using this kind of distance instead of the Euclidean distances. Distances up to 200 km has been calculated in Poland resulting in road distance on average 15% higher than the Euclidean distance. (Alexandri, 2012). It is obvious that there is a significant difference in the two methods of computing distances and the shortest path method using road network layer is the most accurate. The results after the solution of the transportation problem are shown below in Table 4. Capacity for burning straw (Pudełko and Faber 2010) effective quantity of straw quantity to be moved to each plant (source: model results) as well as capacity coverage in percentage (source: own calculations) are shown. One can observe that about half of the power plants are 13
fully exploiting capacity whereas six of them exploit 40‐70% and the rest remain practically with limited quantities of straw. Table 4. Straw supply to main electric power plants in Poland v3
Straw capacity (ktn)
Straw moved (ktn)
Marginal Cost Average Cost of % covered of straw (€/t) straw (€/t)
R1 region: Upper Silesian Industrial Region Elektrownia Opole Elektrownia Rybnik SA PKE SA Elektrownia Jaworzno III PKE SA Elektrownia μaziska PKE SA Elektrownia Sirsza PKE SA Elektrownia μagisza Elektrownia Skawina SA PKE SA Elektrownia Halemba PKE SA Elektrownia Jaworzno II PKE Elektrownia Blachownia SA
region subtotal R2 region: 'lubelskie' voivodinship Elektrownia Po│aniec SA Elektrownia Stalowa Wola SA region subtotal R3 region: Eielkopolska & Kujawy Elektrownia Pontn≤w SA Elektrownia Adam≤w SA Elektrownia Konin SA region subtotal Other plants Zesp≤│ Elektrowni Dolna Odra Elektrownia Be│chat≤w Elektrownia Tur≤w Elektrownia Kozienice SA Elektrownia Ostro│Άka SA All plants
84.3
84.3
293.7
167.0
151.2
0.0
159.9
36.97
36.66
100%
40.44
57%
31.5
40.65
20%
0%
93
6.6
40.41
7%
81.3
81.3
41.44
100%
69.9
48.7
17.4
17.4
41.61
70%
41.50
41.50
100%
41.56
17%
39.02
36.89
100%
29.1
5.0
14.4
14.4
994.2
456.1
145.2
83.6
32.1
32.1
177.3
115.7
197.1
197.1
39.36
102.9
93.3
40.00
91%
50.1
50.1
38.61
100%
350.1
340.5
125.1
125.1
867.6
23.1
42.08
3%
396.9
67.1
39.80
17%
340.2
84.0
42.20
25%
69.9
0.0
41.12
0%
3321.3
1211.6
46%
40.97
41.03
58%
40.19
100%
65%
100%
97%
36.26
33.05
100%
36%
Around 40% of the straw capacity of the energy plants is covered by the phase 2 available quantities. 11 out of 19 plants cover more than 50% of their capacity. The spatial properties of the coverage are shown in the following map in Figure 4. In the following Table 5 the comprehensive results of this exercise are aggregated to the NUTS‐ 2 level. About fifty percent of straw deficit is satisfied under the 30km maximum distance hypothesis. At phase 1 (redistribution) almost equal quantity of straw available for energy is moved to the power plants under the 100 km hypothesis. As we can see there is spatial variability between areas that is explained by straw concentration and also by plant location. 14
Five regions provide all straw surplus to power plants whereas about four of them provide few quantities, the rest belong to an intermediate situation.
Figure 5. Coverage of straw co‐firing capacity and remaining straw. Table 5. Surplus of straw by region (NUTS‐2) at different phases. initial straw quantity
NUTS2 regions dolnośląskie kujawsko‐pomorskie lubelskie lubuskie łódzkie małopolskie mazowieckie opolskie podkarpackie podlaskie pomorskie śląskie świętokrzyskie warmińsko‐mazurskie wielkopolskie zachodniopomorskie totals
after redistribution
transportation to Local small factories transportation to CHP factories
surplus (kt)
deficit (kt)
Sum of surplus_ph21
Sum of deficit_ph21
Grate Boilers Capacity (kt/yr)
547.5 618.1 706.1 120.3 142.5 133.6 344.5 646.1 174.6 65.4 688.6 231.6 94.7 476.8 712.9 507.1 6210.5
‐117.9 ‐52.2 ‐43.6 ‐105.0 ‐187.4 ‐242.8 ‐446.2 ‐14.4 ‐55.6 ‐565.8 ‐53.7 ‐35.2 ‐48.8 ‐169.4 ‐330.7 ‐79.6 ‐2548.4
434.5 558.3 675.4 32.1 24.9 73.7 145.0 630.4 139.8 21.5 635.1 210.1 69.2 340.8 504.7 434.6 4930.0
‐20.2 0.0 ‐10.8 ‐5.9 ‐10.7 ‐193.1 ‐275.7 0.0 ‐19.8 ‐502.2 0.0 ‐14.7 ‐8.0 ‐70.4 ‐135.4 ‐1.0 ‐1267.9
0.0 51.0 6.2 15.9 234.5 6.2 20.0 4.8 0.0 0.0 0.0 20.0 5.5 0.0 6.2 6.2 376.6
Straw moved (kt) # factories
0.0 ‐51.0 ‐6.2 ‐15.9 ‐24.9 ‐6.2 ‐20.0 ‐4.8 0.0 0.0 0.0 ‐20.0 ‐5.5 0.0 ‐6.2 ‐6.2 ‐166.9
1 0 0 0 1 2 2 2 1 0 0 6 1 0 3 1 20
Quantity moved to factories
% surplus left
‐67.1 ‐137.3 ‐56.0 0.0 0.0 ‐67.5 ‐67.0 ‐225.4 ‐15.3 0.0 0.0 ‐185.4 ‐62.3 0.0 ‐203.1 ‐125.1 ‐1211.6
67% 60% 87% 13% 0% 0% 17% 62% 71% 33% 92% 2% 1% 71% 41% 60% 57%
15
4. Conclusive remarks Agricultural waste represents an important source of biomass for energy as especially in large territories abundant quantities are observed to be available for energy purposes. This source of biomass will be fully exploited by second generation bio‐energy technologies thus overcoming the food‐energy controversy, nevertheless it is readily available for use in order to meet short or medium term goals and attain policy objectives. In this context estimation of straw potential for energy purposes has been undertaken in this study based on well known methods at the same time focusing on the spatial dimension in order to approach as much as possible to realistic numbers. Straw surplus and deficit that has been calculated at the NUTS‐5 detail in Poland, has allowed for using transport optimisation models keeping priority to all other uses beside energy. Models results show that assuming that straw trips will not go beyond 30km since transported by own means, about half of the deficit can be covered by areas exceeding their own demand. As a matter of fact in case of lack of straw, fertilisers can be used for soil improvement that concerns the major share of straw uses (Table 3). Once quantities of straw available for energy is determined at the municipal level, a second model allocated it among power plants after deducting straw directed to small grate boilers. This latter use concerns about 170 thousand tons countrywide though unequally distributed as one can observe in Table 5. Finally a quantity of about 1.2 Mt is transported to power plants for co‐firing with coal leaving about half of the gross straw potential unused, probably available for decentralised energy use to be developed in the future. This holds in particular for lubelskie and pomorskie voivodships and for a few other regions that because of actual location of power plants remain with most of harvested straw unused. Avoiding burning in the fields, cofiring of this straw would contribute to the reduction of gases emissions. For similar reasons, some power plants do not satisfy their needs in biomass, so that in order to respect quotas meaning paying environmental taxes, management has to search for other sources of biomass possibly from timberwood waste or perennial plantations. Thus in the Upper Silesian Industrial Region only 46% of the capacity earmarked for straw is satisfied because of high demand concentration (about 1 Mt). Model results minimizing straw cost at the plant gate show full (100%) coverage for 4 plants whereas the other six especially Jaworzno II and III as well as the one located in Sirsza fall short of straw (Table 4). Also plants in the East Poland (located in Ostroleka, Turow and Belchatow) and the South West (Kozienice) are not provided straw at considerable quantities mainly because of distant location from surplus regions. The latter could search for straw from neighbouring countries as it is practically located in the Polish western borderline, however the former three should attain quotas either from straw like sources such as miscanthus either from woody biomass from perennial crops. 16
Further research is needed to address the issue of supplying biomass to energy generation plants to fulfill national and European policy objectives. More specifically advanced model building is required to integrate all possible demand for solid biomass and also to select from various sources simultaneously maximising industry and farmers’ welfare as well as transportation costs. This task goes beyond the objectives of this paper. Nevertheless state‐of‐ the‐art partial equilibrium integrated models can be exploited (i.e. Simon et al., 2010) as well as methods assisted by GIS to bridge the gap between regional statistics and local spatial information. Available spatial and economic data on Poland as well as numerous published material can nourish such models. 5. References Allica J.H., Mitre A.J., Bustamante J.A.G., Itoizc C., Blancoa F., Alkortad I., Garbisu C., 2001: Straw quality for its combustion in a straw‐fired power plant, Biomass and Bioenergy 21, 249‐ 258. Alexandri S., 2012. Comparative transport cost calculation using Euclidean and Shortest Route Algorithms in Poland, BSc dissertation, Agricultural University of Athens. Bal R., 2008. Straw utilization and potential to use it for production of formed fuels on the example of warmińsko‐mazurskie voivodship (in Polish). Inżynieria Rolnicza 1(99): 17‐22 Berggren, M., Ljunggren, E., Johnsson, F., (2008). Biomass co‐firing potentials for electricity generation in Poland‐Matching supply and co‐firing opportunities, Biomass & Bioenergy, 32 (9): 865‐879. Borzęcka‐Walker M., Faber A., Mizak K., Pudełko R., Syp A., (2011). Soil Carbon Sequestration Under Bioenergy Crops in Poland, Principles, Application and Assessment in Soil Science, E. Burcu Özkaraova Güngör (Ed.), ISBN: 978‐953‐307‐740‐6, InTech, Brechbill S.C., W. E. Tyner, 2008. "The Economics Of Biomass Collection,Transportation, And Supply To Indiana Cellulosic And Electric Utility Facilities,"Working Papers 08‐03, Purdue University, College of Agriculture, Department of Agricultural Economics. COGAP: Code of Good Agricultural Practice(in Polish: Kodeks Dobrej Praktyki Rolniczej), Published by Ministry of Agriculture and Rural Development, Warsaw 2004, ISBN 83‐88010‐58‐1 De S., Assadi M, 2009, Impact of cofiring biomass with coal in power plants – A techno‐economic assessment in Biomass & Bioenergy 33, pp. 283‐293 Directive 2009/28/EC. The European Parliament and of The Council on the promotion of the use of energy from renewable sources amending and subsequently repealing Directives 2001/77/EC and 2003/30/EC. Duer I., Fotyma M., Madej A., 2002. Code of Good Agricultural Practice Ministry of Agriculture and Rural Development and Ministry of Environment. Warszawa. Dz. U. 34.182, 2010: Journal of Laws of the Republic of Poland, No 34, item 182 Dz.U. 1059, 2012: Journal of Laws of the Republic of Poland, The Act "Energy Law", Poz.1059 Edwards R. A. H., Suri M., Huld M. A., Dallemand J. F., 2005: GIS‐Based Assessment of Cereal Straw Energy Resource in the European Union. Proceedings of the 14th European Biomass Conference & Exhibition. Biomass for Energy, Industry and Climate Protection, October, Paris. Ericsson, K. 2007. Co‐firing‐A strategy for bioenergy in Poland? Energy, 32 (10), pp. 1838‐1847 Gauder M., Graeff‐Hoonninger S., Claupein W., 2011. Identifying the regional straw potential for energetic use on the basis of statistical information, Biomass & Bioenergy 35 (5): 1646–1654 17
Ghilardi, A., Guerrero, G., Masera, O., 2009. A GIS‐based methodology for highlighting fuelwood supply/demand imbalances at the local level: A case study for Central Mexico, Biomass and Bioenergy, 33 (6‐7), pp. 957‐972. Harasim A., 2011. Straw management. Institute of Soil Sciences and Plant Cultivation (IUNG), Puławy: pp. 77. Hernandez Allica J, Antonio J. Mitre, Jose A. Gonzalez Bustamante, Carlos Itoiz, Fernando Blanco, Itziar Alkorta, Carlos Garbisu; 2001. Straw quality for its combustion in a straw‐fired power plant. Biomass & Bioenergy 21: 249–258 Iglinski B., A. Iglinska, W. Kujawski, R. Buczkowski, M. Cichosz, 2011. Bioenergy in Poland, Renewable and Sustainable Energy Reviews 15: 2999‐3007 Jasiulewisz M., 2010. Possibility of liquid biofuels, electric and heat energy production from biomass in Polish Agriculture, Polish J. of Environmental Studies 19 (3): 479‐483 Kallivroussis L., Rozakis S., Vassilatos V., Petouni D., Kyritsis S., 1996. Crop residues as a source for decentralised heat and power production in rural areas: the case study of Thrace, Proceedings of the 9th European Biomass Conference, Copenhagen. Kozyra J., Doroszewski A., Nieróbca A. 2009: Climate change and their expected impact on agriculture in Poland. Studia i Raporty IUNG‐PIB, 14: 243‐257. (In polish) Kuś, J., Madej, A. & Kopiński, J. (2006). Balance of straw in the regional level. Studia i Raporty IUNG‐PIB, Pulawy, No 3, 211‐225. (In Polish) Maciejewska A., H. Veringa, J. Sanders, S.D. Peteves, 2006. Co‐Firing of Biomass with Coal: Constraints and role of biomass pre‐treatment, DG JRC. Institute for Energy. Mahr, D., 2010. Biomass attributes, handling, and processing issues for large power plants, Proceedings of ASME Power Conference, Chicago. Moller B, Nielsen P.S, 2007, Analysing transport costs of Danish forest wood chip resources by means of continuous cost surfaces, Biomass & Bioenergy 31: 291‐‐298 Nilsson, L.J., Pisarek, M., Buriak, J., Oniszk‐Popławska, A., Bućko, P., Ericsson, K., Jaworski, L., 2006. Energy policy and the role of bioenergy in Poland, Energy Policy, 34 (15): 2263‐2278 Panichelli L, Gnansounou E, 2008, GIS‐based approach for defining bioenergy facilities location: A case study in Northern Spain based on marginal delivery costs and resources competition between facilities Biomass & Bioenergy 32:289 ‐ 300 Pudełko R, Borzęcka‐Walker M, Faber A, Borek R, Jarosz Z, Syp A., 2012: The technical potential of perennial energy crops in Poland, J of Food Env Agriculture 10 (2): 781‐784. Pudełko R, Faber A, Borzęcka‐Walker M, 2008, The geographic Information system to determine resources of biomass and guidelines for the logistics in support of the power station "Dolna Odra", Logistyka 6 Pudełko R. and Faber A., 2010: Selection of energy crops adapted to cultivation in regions of the country (in Polish). Modern technology acquisition and energy use of biomass, Institute of Power Enginering, Warsaw, pp. 50‐68 Regulation of the Minister of Economy of 14 August 2008 on electricity produced from a renewable energy source. Journal of Laws of the Republic of Poland, 2010., No 34, item 182 Rogers J.G, Brammer J.G., 2009, Analysis of transport costs for energy crops for use in biomass pyrolysis plant networks,Biomass & Bioenergy, 33: 1367‐1375 Rozakis S., 2010. A Web‐based Spatial DSS for estimating biomass‐to‐energy supply in Thessaly, in Decision Support Systems in Agriculture, Food and the Environment, IGI Global: pp. 450‐465 Scarlat N., Martinov M., Dallemand J., 2010. Assessment of the availability of agricultural crop residues in the European Union: Potential and limitations for bioenergy use. Waste Management 30: 1889– 1897 18
Simon, D., Tyner, W.E., Jacquet, F. (2010). Economic analysis of the potential of cellulosic biomass available in France from agricultural residue and energy crops, Bioenergy Research 3(2): 183‐193.
19