Plant Physiol. (1983) 71, 789-796 0032-0889/83/7 1/0789/08/$00.50/0
Stomatal Sensitivity to Carbon Dioxide and Humidity A COMPARISON OF TWO C3 AND TWO C4 GRASS SPECIES Received for publication August 10, 1982
JAMES I. L. MORISON AND ROGER M. GIFFORD Commonwealth Scientific and Industrial Research Organization, Division of Plant Industry, P. 0. Box 1600, Canberra City, A. C. T. 2601, Australia
Ci/Ca is reported to be larger in C3 species than in C4 species (3,
ABSTRACT
The sensitivity of stomatal conductance to changes of CO2 concentration and leaf-air vapor pressure difference (VPD) was compared between two C3 and two C4 grass species. There was no evidence that stomata of the C4 species were more sensitive to CO2 than stomata of the C3 species. The sensitivity of stomatal conductance to CO2 change was linearly proportional to the magnitude of stomatal conductance, as determined by the VPD, the same slope fitting the data for all four species. Similarly, the sensitivity of stomatal conductance to VPD was linearly proportional to the magnitude of stomatal conductance. At small VPD, the ratio of intercellular to ambient CO2 concentration, CL/C., was similar in all species (0.8-0.9) but declined with increasing VPD, so that, at large VPD, CLJC. was 0.7 and 0.5 (approximately) in Cs and C4 species, respectively. Transpiration efficiency (net CO2 assimilation rate/transpiration rate) was larger in the C4 species than in the C3 species at current atmospheric CO2 concentrations, but the relative increase due to high CO2 was larger in the C3 than in the C4 species.
Atmospheric carbon dioxide concentration is rising as a result of the burning of fossil fuels (e.g. 8). This may increase the water use efficiency of vegetation through stomatal closure and the stimulation of net photosynthesis. However, plant species may not all respond to the same degree. It is a widely held view that stomata of C4 species are more C02-sensitive than are those of C3 species (e.g. 1, 15, 19, 21) but few data support this notion unequivocally. Early workers compared transpiration rates while the ambient CO2 concentration was changed in large steps and the humidity around the leaf varied with the transpiration rate, possibly affecting stomatal aperture directly (e.g. 1, 21). The most definitive comparison was that between the C4 species Zea mays and Amaranthus powelli and the C3 species Xanthium strumarium and Gossypium hirsutum (3). In that study, the two C4 species exhibited higher sensitivity of leaf conductance to intercellular CO2 concentration than did the C3 species, unless ABA was supplied when, surprisingly, the ranking was reversed. In making such comparisons, it is necessary to distinguish between the C.' and the C,, since Ci rather than C. is usually assumed to affect the guard cells. A difference in stomatal sensitivity to C. might not reflect a difference in the guard cell response to CO2 but rather a difference in the ratio of Ci to C. that is partly determined by net CO2 assimilation rate (A) (2, 12, 29). Though 'Abbreviations: C., ambient CO2 concentration; C,, intercellular CO2 concentration; A, net CO2 assimilation rate; VPD, leaf-air vapor pressure difference(s); A/E, transpiration efficiency; g., stomatal conductance; I, leaf water potential.
14, 24, 29), it has been shown to be independent of Ca and irradiance (17, 30), leaf age, and nutrient status (31). Therefore, Ci/C. has been used in models of crop photosynthesis and water use efficiency (e.g. 27). However, large decreases in Ci/Ca have been observed as leaf temperature increases (11) and Ci/Ca must alter when stomatal conductance is affected directly by VPD independently of bulk leaf water status (e.g. 2, 6, 26). In this study, we compared the sensitivity of stomatal conductance to Ca and Ci between two C3 and two C4 grasses and examined the effect of humidity (VPD) on the sensitivity of stomatal conductance to CO2. Further, we examined the responses of Ci/Ca and A/E to Ca and VPD in both C3 and C4 species.
MATERIALS AND METHODS Plant Material. Plants of maize (Zea mays L. cv XL399 [C4]), paspalum (Paspalum plicatulum Michx. cv Rudd's Bay [C4]), rice (Oryza sativa L. cv IR8 [C3]), and phalaris (Phalaris aquatica L. cv Sirosa [C3]) were grown in an artificially illuminated growth cabinet (LBH-type cabinet, Canberra phytotron [18]). Pregerminated seeds were planted into 3 dm3 of soil (a river loam, sand, vermiculite, fertilizer mixture) in 50-cm sections of 9-cm diameter drainage pipe lined with sealed polyethylene sleeving. Water was added to the soil surface as required to maintain a water table at a constant 10 cm from the base of the pot. Photosynthetic photon flux density at plant height was 630 ,umol (quanta) m-2 s-1 for a 16-h day, with a 25/20°C day/night cycle at constant 70%Yo RH, corresponding to a VPD cycle of 0.95/0.70 kPa. At the time of leaf gas exchange measurements, the maize plants were 3 weeks old and rice plants were 11 weeks old. Paspalum and phalaris, both forage species, had been subject to several cycles of defoliation and regrowth as part of another experiment, but leaves used were 2 weeks old and fully expanded. Leaf Gas Exchange Measurements. Measurements were made on single, attached leaves of two plants per species in another controlled environment cabinet. Eight cm2 of leaf lamina were clamped into an aluminum, brass, and glass leaf chamber. Parts of the plant outside the leaf chamber were shaded and covered in a plastic bag to minimize evaporation losses. The light sources were a l,000-w metal-halide lamp (HPLR, Philips, Holland) and a bank of fluorescent tubes. The photosynthetic photon flux density on the upper leaf surface was 670 ± 15 ttmol (quanta) m-2 s- , measured with a photocell calibrated in situ against a quantum sensor (model LI-190; Lambda Instruments Co. Inc.). The leaf temperature used to calculate the saturated vapor pressure in the intercellular spaces was the mean reading from three copperconstantan thermocouple junctions pressed to the abaxial surface of the leaf. Leaf temperature was kept constant at 25.3 + 0.15°C irrespective of transpiration rate. Boundary layer conductance for water vapor transfer was estimated from wet filter paper to be 2.1 mol m s'. The vapor pressures of airstreams leaving, and
789
35k 30
-
25 0
20
=-
C'.
E
15
zE
10
_a
Qu
5
C 0
Ipaspalum
0
35 E
30
mC/ 0
25
a) z
20 0
1510 -I
ice
600
800
~~~~~~~~phalaris 200
0
Ambient C02 concentration
400
600
800
(pi 1-1)
(b)
E
73 04 E
~ ~ ~
I0.40
.',20
2.0
C
,E°,01.6t
t
rice
\
phalaris
m
16 -1.6 -I 00
1.2
1.2
0.8
I0.8
0.4
0.4
0
200
400
600
800
0
-
200
400
600
800
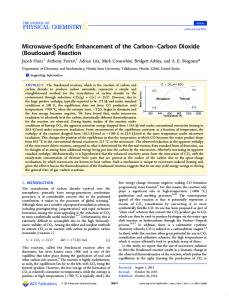
Ambient C02 concentration (pw I") FIG. 1. Response of (a) net CO2 assimilation rate and (b) stomatal conductance to ambient CO2 concentration at four levels of VPD in the C4 species maize and paspalum and the C3 species rice and phalaris. Leaf-air vapor pressure differences are 0.5 pKa (0), 0.9 kPa (0), 1.4 pKa (A), and 2.0 kPa (A). Vertical dashed lines indicate values of A and g& at Ca = 340 ,lI 1-'. The curves of gs versus Ca are fitted quadratic functions.
(a) aorL
35
'As
0i
30
0
@1 i1
30
&
/
25
25
-, 20
20
0
N
I/
E 15
E 10 -a
10
paspalum
maize
0)
5
5
.2 0 c 35
35
T, c
.E 0 0, 30
30
0 25
25 II I
° 20 z
20 0
-
.-
II
15~~~~~~
15
10
10
10 wA=
phalaris
rice
,,'
5
5
0
.-
O .-
200
400
600
800
0
200
400
600
800
Intercellular C02 concentration (Il Il
2.0
paspalum 16
1.2
-
0
0.8
0.44
2.0-
~~~~~phalaris
0 1.6-
12~~~~~~~~~~~~~~~~~~~~
0.4
0
200
400
600
800
Intercellular C02 concentration (PI 1-') FIG. 2. Response of (a) net assimilation rate and (b) stomatal conductance to intercellular CO2 concentration at four levels of VPD; data replotted from Figure 1. Dashed lines join values of g. versus Ci for C, = 340 pl 1-' as VPD varied. Horizontal arrows denote the range of A versus Ci at Ca = 340 !Ll r' as VPD varied. (*), calculated values of A and Ci at infinite stomatal conductance and Ca = 340 IL 1-1 (see "Discussion"). The curves of g. versus
Ci are fitted quadratic functions.
792
MORISON AND GIFFORD
bypassing the chamber were measured with two thin-film capacitance humidity sensors (model 6061HM; Vaisala OY, Helsinki, Finland) kept at a constant temperature of 35.2°C, and also with a dewpoint hygrometer (model 880; EG & G, MA). The vapor pressure of the air around the leaf was kept constant at any desired value (±0.02 kPa) by adjusting the mixture of wet and dry air streams entering the chamber. Accurately known CO2 concentrations were supplied by three gas mixing pumps in cascade (models SA18/3, M300/aF, G27/3F; WosthoffoHG, D463 Bochum, Germany). CO2 uptake in the chamber was measured by a differential IR gas analyzer (model 865; Beckman Instruments) fitted with interference filters to eliminate the cross-sensitivity to water vapor. Calculations of transpiration rate (E), net CO2 assimilation rate (A), stomatal conductance to water vapor (g8), Ca, and Ci included corrections due to atmospheric pressure (mean = 97 kPa), due to the counterflow of H20 on Ci, and due to the dilution of Ca by water vapor (as detailed in Ref. 28). All measurements are expressed on a projected leaf area basis. Procedure. The response of assimilation rate, transpiration rate, and stomatal conductance to four ambient CO2 concentrations were measured at four values of VPD over 2 d for each of two leaves per species. The CO2 concentration supplied by the pumps was changed in the sequence: 360, 600, 800, and 200 ,ul I-, with over 1 h equilibration at each concentration; the CO2 concentration in the chamber, Ca, was up to 25 ,Al I` lower. On the 1st d, the C02-response curves were measured at about 0.5 and 0.9 kPa VPD, and on the second at about 1.4 and 2.0 kPa VPD.
Plant Physiol. Vol. 71, 1983
_uuu00(.(a).
*A /
/
/
1o -2000
E E
/
O
/-
/0
(
10
0' -1000
g/
10
// 0
-1.6
(b)
/~~~
*//
/
-1.2
07
CL
*A
0-
RESULTS The Primary Data. The response of A and g8 to Ca is shown in Figure 1. As expected, net assimilation rate saturated at a lower Ca in the two C4 species maize and paspalum than in the two C3 species rice and phalaris. Net assimilation rate in all four species was largely unaffected by the VPD changing from 0.5 to 1.4 kPa, but the large VPD of 2 kPa (twice that prevailing during growth) caused a lower net assimilation rate in the two C3 species, possibly as a result of the onset of water stress at high evaporation rates
0
E
E 05 E
A
-0.8
li r~~~ / /O
/~~~~
a
C0
vO
0, ~0
/ O
-0.41
/ ./.
Am
0
Table I. Sensitivity of Stomatal Conductance to Changes in Ci and Ca 0 0.4 0.8 1.2 1.6 The sensitivity to Ca, dga/dCa, is the slope of ga versus Ca, derived from Stomatal conductance (mol m-n2 s1) the fitted quadratic function, at Ca = 340 ul I-'. The sensitivity to Ci, dg/ dCi, is the slope of g. versus C., derived from the fitted quadratic function, FIG. 3. Relationship between (a) stomatal sensitivity to Ci, dga/dCi, at Ci corresponding to Ca = 340 11-. Means of two replicates per species; and stomatal conductance and (b) stomatal sensitivity to VPD, dg./ n = 8. d(VPD), and stomatal conductance. (A), Paspalum (C4); (E), maize (C4); (3), rice (C3); and (0), phalaris (C3). a, Dashed line is a linear regression, VPD dga/dCa dga/dCi (r2 = 0.87); b, dashed line is a linear regression constrained through the kPa mol m-2 S-1 origin (r2 = 0.80). 0.50 Maize (C4) -1,990 -2,447 -949 0.95 -1,235 (but see "Discussion"). Stomatal conductance was reduced at all 1.41 -864 -1,093 VPD by Ca values that are higher than current atmospheric 1.94 -698 -865 concentrations and increased at lower concentrations in all species. Leaves of phalaris (C3) and paspalum (C4) had very high stomatal 0.46 Paspalum (C4) -2,637 -2,812 conductances at small vapor pressure differences; larger VPD 0.93 -1,130 -1,360 decreased ga at all ambient CO2 concentrations in each species. -822 1.41 -1,074 When the data are replotted as a function of Ci (Figure 2), it is -601 -844 1.94 apparent that, at a particular Ca, Ci declined with increasing VPD in all four species (i.e. dashed line, denoting ga at C, at Ca = 340 0.45 Rice (C3) -1,593 -1,878 I1 curves to lower Ci). This effect is more marked in the C4 ,ul -628 -809 0.93 species (C, changed by up to 80 p11-1 at Ca = 340 ,ul 1-) than in -662 -480 1.41 the C3 species, but had little effect on net assimilation rate in the -357 -506 2.01 C4 species as A versus Ci was close to the plateau region. Stomatal conductance showed large changes in response to both Ci and 0.44 Phalaris (C3) -2,447 -2,706 VPD; there was no unique relationship between ga and Ci for all 0.91 -1,265 -1,498 vapor pressure differences. -740 -594 1.40 Analysis of Stomatal Sensitivty to CO2 and VPD. Table I -740 -576 1.99 shows the sensitivity of stomatal conductance to Ca and to Ci,
STOMATA OF C3 AND C4 GRASSES79 793 Table II. Sensitivity of Stomatal Conductance to VPD expressed as the slopes dg8/dC. and dg./dCj at C,8 = 340 pl 1', derived from quadratic functions fitted to g8 versus C. and g. versus T'he sensitivity to VPD, dgd/d(VPD), is the slope of g. versus VPD Ci at each VPD. While the senisitivity of stomatal conductance to derived from the fitted quadratic function, at VPD Q0.9 kPa; means of C02, expressed either as C. or as C,, was lower with larger VPD, two replicates; n =8. there were little differences between C3 and C4 species. Only rice VPD C. dg./d(VPD) showed lower mean sensitivity to both C. and C, than the other kPa pIr'1 mol m-2s-'kPa-' species (P < 0.05, analysis of variance). However, stomatal conductance was lower in rice than in the other species (Figs. lb and Maize (C4) 0.95 190 -0.91 2b) suggesting that the stomatal sensitivity to CO2 may have been 340 -0.60 proportional to the absolute magnitude of g.. Figure 3a indicates 580 -0.38 that this was indeed the case; there is a single linear relationship 790 -0.34 between the stomatal sensitivity to Ci and stomatal conductance for all four species at diffTerent VPD. 0.93 190 -1.30 Paspalum (C4) Figure 4 shows the response of stomatal conductance to VPD 340 -0.61 at two ambient CO2 concentrations, 340 and 790 ILI 1'. The 580 -0.53 response in all four species was similar, but stomatal conductance 790 -0.45 in phalaris (C3) showed larger increases at small VPD. High ambient CO2 reduced stomatal conductance at each VPD (Fig. 4) Rice (C3) 0.93 190 -0.69 aLnd the stomatal sensitivity to VPD. In Table II, this sensitivity is 340 -0.40 580 expressed as the slope dg./d(VPD) at VPD = 0.9 kPa, derived -0.28 from quadratic functions fitted to g. versus VPD at each C.. The 790 -0.27 sensitivity decreased with increased C8 and varied between species but was linearly related to absolute stomatal conductance in all Phalaris (C3) 0.91 190 -1.35 four species and CO2 concentrations (Fig. 3b). 340 -1.1i2 Transpiration and Transpiration Efficiency. In the absence of 580 -0.66 any change in stomatal conductance, the rate of transpiration for 790 -0.61 a leaf held at constant temperature is directly proportional to VPD (e.g. 24). However, stomatal conductance responded markedly to VPD in the four species in this present study (Fig. 4), so much so that at VPD larger than 0.9 kPa there were only small increases in 1.61 (a) i transpiration, especially at high ambient CO2 concentrations (Fig. 5). In the two C3 species, transpiration even declined when VPD was increased from 1.4 to 2.0 kPa, this decline coinciding with the decline in net assimilation rate (Fig. 2a). Transpiration effitciency k (AE, mmol CO2 assimilation/mol H20 transpiration; Fig. 6) increased with higher atmospheric CO2 in all four species, but in the two C4 species was almost independent of VPD between 0.9 and 2.0 kPa because of the lack of effect of VPD on assimilation and transpiration (Figs. 1 and 5). In the two C3 species, A/E (a decreased with larger VPD. At a vapor pressure difference and ambient CO2 concentration similar to that in which the plants E were grown (VPD = 0.9 kPa and C. = 3 .d I-', arrowed points), C4 plants had a higher transpiration efficiency than the C3 plants (7.1 for maize [C4], 5.0 for paspalum [C4], 4.5 for rice [C3], and 3.1 mmol mol' for phalaris IC3]) as expected. However, the relative increase of A/E with increased ambient CO2 from 340 to 800 Al F'1 was larger for the C3 species than for the C4 species; ([AlE at 04 Ca = 800] - [AE at C8 = 340])/(A/E at C8 = 340 psl F'1) was 0.7 in maize, 0.4 in paspalum, 1.2 in rice, and 1.0 in phalaris (average of four VPD). (b) The Relationship between C, and C.. Figure 7 shows the relationship between Ci and C8 while VPD was maintained constant at 0.9 kPa-a humidity close to that at which the plants were grown. The relationships are all close to linear but the extrapolated regressions of the C4 species intersect the abscissa at C8 = 50 Ail I' and not near the origin. We conclude that the relationship was 0t not truly linear for maize and -paspalum, with C,/C. increasing slightly as C8 increases. However, there is no clear distinction between the values of Ci/C. for C3 and C4 species. At C8 = 340 I4 F'1, the value of Ci/C8 was largest in phalaris (C3; 0.85) and lowest in maize (C4; 0.67), but identical in paspalum (C4) and rice 1.2
0.8
c04
0
Cu
+0
08
0.4
0
0.4
0.8
1.2
1.6
2.0
Leaf-air vapor pressure difference
(kPa)
FIG.
4.
Response
of stomatal conductance to leaf-air vapor pressure
difference at two ambient CO2 concentrations
1l I-'.
Symbols
as
in
Figure
3.
(a) 340
ILI I-'
and
(b)
800
(C3; 0.78). However, Ci/C8 decreased with larger VPD (Fig. 8) in each species as a result of the reduced stomatal conductance. Only at large VPD (2.0 kPa) in rice and phalaris was net assimilation affected (Fig. 1) causing a higher C,/C8 than predicted by the linear relationship between Ci/C. and VPD. The slope of the relationship between Ci/C8 and VPD was largest in the C4 species,
Plant Physiol. Vol. 71, 1983
MORISON AND GIFFORD
794 maize
8
paspalum
I8 I6-
6
-eJa 4
.5 E E
4
A
0-11'-
E
-
2
2
-WG) co
c
J
8
rice
8
phalaris
._
co 6
6
4U
4
2
2
n C
0
0.4
0.8
1.2
1.6
Leaf-air
2.0
0
vapor pressure
0.4
0.8
1.2
1.6
FIG. 5. Response of transpiration rate to leaf-air vapor pressure difference at four ambient CO2 concentrations: 600 ,ul I-'; (v), 800 ,ul I-'
particularly maize, so that at 2.0 kPa Ci/Ca had declined to 0.45 (Fig. 8) in this species. DISCUSSION The results do not support the assumption that the stomata of C4 species are always more sensitive to CO2 than those of C3 species, whether the sensitivity is expressed with respect to ambient CO2 or to intercellular CO2 concentration. It might be argued that in these well-watered plants the levels of ABA were low, reducing the sensitivity of stomata to CO2 (e.g. 22, 23). However, we measured high sensitivity to C02, and the values of dg5/dCi (Table I) were at the upper end of the range reported by other workers (3, 5, 23). Furthermore, the values of stomatal conductance under conditions similar to those in which the plants were grown were large and similar in the C4 and C3 species, contrary to many reports that stomatal conductance is larger in C3 plants than C4 (2, 7). However, a recent review of many measurements of maximum stomatal conductance concluded that there is no indication of a generally lower maximum conductance in C4 grasses as compared with C3 grasses (13). The average values of maximum conductance for grasses was about 0.45 mol m-2 s-1 (Ref. 13; Fig. 2), this being lower than the values observed in this study at 0.9 kPa VPD and Ca = 340 Ml 11 (Fig. lb). Farquhar and Sharkey (4) have recently argued that stomata usually impose only a slight limitation on net assimilation, and further, that stomata do not limit assimilation in C4 species more than in C3 species. Figure 2a supports this argument as the net 340 I 11` in the C4 species occur, assimilation rates at Ca a range of VPD, near the saturated region of the response curve of assimilation to Ci where there is little or no stomatal limitation. In C3 species, there was only a small limitation shown in Figure 2a as the difference in assimilation rate in the region bounded by arrows to that at *, the point where stomatal conductance imposes no limitation and leaf conductance equals the boundary layer conductance, following Farquhar and Sharkey (4). Stomatal conductance was sensitive to humidity in all four species, and low CO2 increased the response to VPD and vice versa (Figs. lb and 2b); however, the relative response of g. to either CO2 or VPD was unaffected by the other variable: the over
2.0
difference (kPa) (v),
200 l I-'; (@), 340 IAI I-'; (W),
sensitivity of stomata to CO2 or VPD was proportional to the absolute g8 (Fig. 3, a and b). Similar results in Sesamum indicum (9) and Vigna unguiculata (10) support this conclusion. The similarity of the stomatal sensitivities to CO2 and to VPD among the four species examined is surprising in view of the different responses of stomata to environmental variables observed previously between closely related species and even clones (20). The linear relationship between the sensitivity of stomatal conductance to CO2 and absolute stomatal conductance as VPD decreased (Fig. 3a) contrasts with the effects of ABA and light on stomatal sensitivity to CO2 and stomatal conductance. Increased ABA supply reduces conductance but increases the sensitivity of stomata to CO2 (e.g. 3, 22, 23) and increasing light intensity increases conductance but reduces stomatal sensitivity to CO2 at low CO2 concentrations (17, 25). This interaction of light, ABA, and CO2 on stomata has previously suggested that these factors work at a common level in the stomatal mechanism (16, 17). The observation that VPD does not affect the CO2 response of stomata in the same direction as does ABA or light emphasizes therefore that VPD acts at a different level. In contrast to the stomatal response to humidity, assimilation by the mesophyll was largely unaffected by humidity. Presuming that mesophyll assimilation rate is sensitive to leaf water potential changes, the lack of any effect of VPD on net assimilation rate indicates a 'direct' effect of VPD on stomata, i.e. not mediated by The only exception to this, the decline of changes in bulk assimilation rate and transpiration rate at large VPD of 2.0 kPa in rice and phalaris (Figs. 2 and 5) is, however, difficult to understand. Assimilation rate is affected even at saturating Ci (Fig. 2), yet cannot be less than at 1.4 kPa VPD as the rate of transpiration is actually lower. It is possible that the change to 2.0 kPa VPD caused a transient decline in which reduced net assimilation rate and conductance. However, recovery from any such transient condition was not observed over the 5 h required for measuring the CO2 response curve at 2.0 kPa VPD; conditions appeared to be steady. We can only suggest some localid drying effect on the mesophyll tissue. The sensitivity of stomata to VPD caused changes in the ratio Cj/C,. In all four species, Ci/Ca was nearly independent of Ca, but was linearly related to VPD (Figs. 7 and 8). At the extreme of '.
795
STOMATA OF C3 AND C4 GRASSES -
14
paspalum
12F
-
-C 0
10 1
600 C
6) 0
,
/
6 0
8 400-
E
E
4
E
6) co
2
C._
rC._C
C
200-
0
12 _I
10
phalaris //
F
C-
600
400
200
0
Cu CO 0
Ambient CO2 concentration
8
800
(pi I-~)
FIG. 7. The relationship between intercellular CO2 concentration and ambient CO2 concentration at constant VPD (0.9 kPa). Symbols as in Figure 3. Linear regressions extrapolated to x axes (r2 = 1.00).
6h 4
1.0
(a) 2F I
0
200
400
0.8
II
600
800
0
200
400
600
044 0.22
pil-]. water-saturated air, Ci/Ca (by extrapolation) would be 0.8 to 0.9 for all species, C3 or C4. Only at the largest vapor pressure difference was Ci/Ca substantially different between the two C3 and C4 species, and comparable with 'typical' measurements in the literature. VPD may have a large effect on CC/Ca in other species. For example, in the C4 dicot, Amaranthus powelli Ci/Ca, measured at 0.7 kPa VPD, was 0.7 (3), similar to Ci/C8 in maize in the present study at the same VPD. However, the importance of the VPD effect on Ci/Ca in the field cannot be estimated, as the response of stomata to both humidity and CO2 varies with growing conditions (e.g. 3, 5, 20, 23). Many workers have reported that C4 plants have higher transpiration efficiencies (units CO2 gain/units H20 loss) than C3 plants (e.g. 24). At Ca = 340 pl 1` and VPD = 0.9 kPa, our results agree with such reports (Fig. 6). However, because the relative increase of A/E with increased C. was larger in the C3 plants than in the C4 plants, the transpiration efficiency of the two C3 species at Ca = 800 ftl 1` exceeded that of the C4 species paspalum. It remains to be seen whether such increases of transpiration efficiency of individual leaves are matched by similar increases in the water use efficiency of crops as the atmospheric CO2 concentration increases. Acknowledgment&-We thank Jen Price and the staff of the Canberra Phytotron for technical assistance. We are grateful to P. G. Jarvis, T. D. Sharkey, and G. D. Farquhar for helpful discussions and advice on the manuscript and to the Department of Environmental Biology, Research School of the Biological Sciences, Australian National University, for the loan of a gas mixing pump.
F
0.6
800
Ambient C02 concentration (pi I1) FIG. 6. Relationship between transpiration efficiency (mmol [CO2J m-2 s-'/mol [H201 m-2 s-1) and C. at four VPD levels; same symbols as Figure 1. Arrows indicate transpiration efficiencies at VPD = 0.9 kPa, Ca = 340 0
0
(b)
cn) Cu
1.0F
'~~~~~~
0.8 0.66 04[ 0.2
F
0
0.4
0.8
Leaf-air vapor
1.2 pressure
1.6
2.0
difference
(kPa) FIG. 8. The relationship between Ci/C. at C. = 340 tl I` and leaf-air vapor pressure difference for (a) maize and paspalum (C4) and (b) rice and phalaris (C3). Symbols as in Figure 3. Linear regressions extrapolated to y axes
(r2 = 0.90-0.97). LITERATURE CITED
1. AKITA S, DN Moss 1972 Differential stomatal response between C3 and C4 species to atmospheric CO2 concentration and light. Crop Sci 12: 789-793
796
MORISON AND GIFFORD
2. COWAN IR 1977 Stomatal behaviour and environment. Adv Bot Res 4: 117-228 3. DUBBE DR, GD FARQUHAR, K RASCHKE 1978 Effect of abscisic acid on the gain of the feedback loop involving carbon dioxide and stomata. Plant Physiol 62: 413-417 4. FARQUHAR GD, TD SHARKEY 1982 Stomatal conductance and photosynthesis. Annu Rev Plant Physiol 33: 317-345 5. FARQUHAR GD, DR DUBBE, K RASCHKE 1978 Gain of the feedback loop involving carbon dioxide and stomata. Theory and measurement. Plant Physiol 62: 406-412 6. FARQUHAR GD, E-D SCHULZE, M KUPPERS 1980 Responses to humidity by stomata of Nicotiana glauca L. and Corylus avellana L. are consistent with the optimisation of carbon dioxide uptake with respect to water loss. Aust J Plant Physiol 7: 315-327 7. GIFFORD RM 1974 A comparison of potential photosynthesis, productivity and yield of plant species with differing photosynthetic metabolism. Aust J Plant Physiol 1: 107-117 8. GIFFORD RM 1982 Global photosynthesis in relation to our food and energy needs. In Govindjee, ed, Photosynthesis, Vol. 2, Development, Carbon Metabolism, and Plant Production. Academic Press, New York, pp 459-495 9. HALL AE, MR KAUFMANN 1975 Stomatal response to environment with Sesamum indicum L. Plant Physiol 55: 455-459 10. HALL AE, E-D SCHULZE 1980 Stomatal response to environment and a possible interrelation between stomatal effects on transpiration and C02 assimilation. Plant Cell Environ 3: 467-474 11. HALLGREN J-E, E SUNDBOM, M STRAND 1982 Photosynthetic responses to low temperature in Betulapubescens and Betula tortuosa. Physiol Plant 54: 275-282 12. JARVIS PG, JIL MORISON 1981 The control of transpiration and photosynthesis by the stomata. In PG Jarvis, TA Mansfield, eds, Stomatal Physiology, SEB Seminar Series, No. 8. Cambridge University Press, Cambridge, pp 247-279 13. KORNER CH, JA SCHEEL, G BAUER 1979 Maximum leaf diffusive conductance in vascular plants. Photosynthetica 13: 45-82 14. LouWERSE W 1981 Effects of C02-concentration and irradiance on the stomatal behaviour of maize, barley and sunflower plants in the field. Plant Cell Environ 3: 391-398 15. LUDLOW MM, GL WILSON 1971 Photosynthesis of tropical pasture plants. I. Illuminance, carbon dioxide concentration, leaf temperature and leaf-air vapour pressure difference. Aust J Biol Sci 24: 449-470 16. MANSFIELD TA, AJ TRAVIS, RG JARVIS 1981 Responses to light and carbon
Plant Physiol. Vol. 71, 1983
dioxide. In PG Jarvis, TA Mansfield, eds, Stomatal Physiology, SEB Seminar Series, No. 8. Cambridge University Press, Cambridge, pp 119-135 17. MORISON JIL, PG JARvis 1983 Direct and indirect effects of light on stomata. II. In Commelina communis L. Plant Cell Environ. In press 18. MORSE RN, LT EVANS 1962 Design and development of CERES-an Australian Phytotron. J Agric Eng Res 7: 128-140 19. OSMOND CB, 0 BJORKMAN, DJ ANDERSON 1980 Physiological processes in plant ecology: toward a synthesis with Atriplex. Ecol Stud Anal Synth 36: 1-468 20. PALLARDY SG 1981 Closely related woody plants. In TT Kozlowski, ed, Water Deficits and Plant Growth, Vol 6. Academic Press, New York, pp 51 1-548 21. PALLAS JE JR 1965 Transpiration and stomatal opening with changes in carbon dioxide content of air. Science 147: 171-173 22. RADIN JW, RC ACKERSON 1981 Water relations of cotton plants under nitrogen deficiency. III. Stomatal conductance, photosynthesis, and abscisic acid accumulation during drought. Plant Physiol 67: 115-119 23. RASCHKE K 1979 Movements of stomata. In W Haupt, ME Feinleib, eds, Physiology of Movements, Encyclopedia of Plant Physiology, Vol 7. SpringerVerlag, Berlin, pp 383-344 24. RAWSON HM, JE BEGG, RG WOODWARD 1977 The effect of atmospheric humidity on photosynthesis, transpiration and water use efficiency of leaves of several plant species. Planta 134: 5-10 25. SHARKEY TD, K RASCHKE 1981 Separation and measurement of direct and indirect effects of light on stomata. Plant Physiol 68: 33-40 26. SHERIFF DW 1977 The effect of humidity on water uptake by, and viscous flow resistance of excised leaves of a number of species: physiological and anatomical observations. J Exp Bot 28: 1399-1407 27. TANNER CB 1981 Transpiration efficiency of potato. Agron J 73: 59-64 28. VON CAEMMERER S, GD FARQUHAR 1981 Some relationships between the biochemistry of photosynthesis and the gas exchange of leaves. Planta 153: 376-387 29. WHITEMAN PC, D KOLLER 1967 Interactions of carbon dioxide concentration, light intensity and temperature on plant resistances to water vapour and carbon dioxide diffusion. New Phytol 66: 463-473 30. WONG SC, IR COWAN, GD FARQUHAR 1978 Leaf conductance in relation to
assimilation in Eucalyptus pauciflora Sieb. ex Spreng. Plant Physiol 62: 670674 31. WONG SC, IR COWAN, GD FARQUHAR 1979 Stomatal conductance correlates with photosynthetic capacity. Nature 282: 424-426