State of Minnesota Office of the State Auditor
Rebecca Otto State Auditor
FINANCIAL and INVESTMENT REPORT of VOLUNTEER FIRE RELIEF ASSOCIATIONS For the Year Ended December 31, 2011
Description of the Office of the State Auditor The mission of the Office of the State Auditor is to oversee local government finances for Minnesota taxpayers by helping to ensure financial integrity and accountability in local governmental financial activities. Through financial, compliance, and special audits, the State Auditor oversees and ensures that local government funds are used for the purposes intended by law and that local governments hold themselves to the highest standards of financial accountability. The State Auditor performs approximately 150 financial and compliance audits per year and has oversight responsibilities for over 3,300 local units of government throughout the state. The office currently maintains five divisions: Audit Practice - conducts financial and legal compliance audits of local governments; Government Information - collects and analyzes financial information for cities, towns, counties, and special districts; Legal/Special Investigations - provides legal analysis and counsel to the Office and responds to outside inquiries about Minnesota local government law; as well as investigates allegations of misfeasance, malfeasance, and nonfeasance in local government; Pension - monitors investment, financial, and actuarial reporting for approximately 730 public pension funds; and Tax Increment Financing - promotes compliance and accountability in local governments’ use of tax increment financing through financial and compliance audits. The State Auditor serves on the State Executive Council, State Board of Investment, Land Exchange Board, Public Employees Retirement Association Board, Minnesota Housing Finance Agency, and the Rural Finance Authority Board. Office of the State Auditor 525 Park Street, Suite 500 Saint Paul, Minnesota 55103 (651) 296-2551
[email protected] www.auditor.state.mn.us This document can be made available in alternative formats upon request. Call 651-296-2551 [voice] or 1-800-627-3529 [relay service] for assistance; or visit the Office of the State Auditor’s web site: www.auditor.state.mn.us.
Financial and Investment Report of Volunteer Fire Relief Associations For the Year Ended December 31, 2011
March 14, 2013
Pension Division Office of the State Auditor State of Minnesota Pension Division Rose Hennessy Allen, Pension Director Aaron Dahl, Management Analyst Jim Jensen, Management Analyst Michael Johnson, Management Analyst Samantha Lee, Pension Intern Gail Richie, Office and Administrative Specialist
This page is intentionally left blank.
Table of Contents
Page Scope and Methodology
1
Executive Summary
3
Recommendations
4
Plan Types
5
Demographics
6
Revenues
8
Fire State Aid
9
Municipal Contributions
10
Investment Earnings
13
Current Trends
14
Benchmarks
15
Current Trends
16
Long-Term Trends
16
Expenditures
18
Benefit Payments
18
Administrative Expenses
19
Health of the Plan
21
Funding Ratios
21
Benefit Levels
22
Regional Analysis
24
Current Trends
24
Long-Term Trends
24
Figures Figure 1: Years of Service for Active Members – 2011 Figure 2: Age of Active Members – 2011 Figure 3: Relief Association Revenue Sources – 2011 Figure 4: Relief Association Primary Revenue Sources – 2007 to 2011 Figure 5: Relief Association Municipal Contributions – 2007 to 2011 Figure 6: Rates of Return – 2011 Figure 7: Annual Rates of Return – 2002 to 2011 Figure 8: Relief Association Expenditures – 2011 2011 Lump-Sum Benefit Level by Economic Development Region 2011 Average Rates of Return by Economic Development Region Ten-Year Average Rates of Return by Economic Development Region
6 7 8 9 11 14 17 18 26 27 28
Tables Table 1: Financial and Membership Summary
31
How to Read Tables 2-A Through 2-C Table 2-A: Financial and Investment Data for Lump-Sum Plans Table 2-B: Financial and Investment Data for Defined-Contribution Plans Table 2-C: Financial and Investment Data for Other Plan Types
33 35 51 55
How to Read Tables 3-A Through 3-C Table 3-A: Funding Status and Ratios for Lump-Sum Plans Table 3-B: Funding Status and Ratios for Defined-Contribution Plans Table 3-C: Funding Status and Ratios for Other Plan Types
57 59 71 73
How to Read Tables 4-A Through 4-C Table 4-A: Revenues and Expenditures for Lump-Sum Plans Table 4-B: Revenues and Expenditures for Defined-Contribution Plans Table 4-C: Revenues and Expenditures for Other Plan Types
75 77 97 101
How to Read Tables 5-A Through 5-C Table 5-A: Membership and Bylaw Provisions for Lump-Sum Plans Table 5-B: Membership and Bylaw Provisions for Defined-Contribution Plans Table 5-C: Membership and Bylaw Provisions for Other Plan Types
103 105 125 129
How to Read Tables 6-A Through 6-C Table 6-A: Benefit Amounts for Lump-Sum Plans Table 6-B: Benefit Amounts for Defined-Contribution Plans Table 6-C: Benefit Amounts for Other Plan Types
131 133 147 151
How to Read Table 7 Table 7: Rates of Return and Asset Allocation
153 155
Scope and Methodology This report summarizes and evaluates the finances, basic benefit structure, and investment performance of Minnesota’s volunteer fire relief associations (relief associations). Relief associations are governmental entities that receive and manage public money to provide retirement benefits for individuals providing the governmental services of firefighting and emergency first response. Relief associations are required under various Minnesota statutes to report annually financial, investment, and plan administration information to the Office of the State Auditor, and the State Auditor is required to provide a detailed report to the Legislature under Minnesota Statutes §§ 6.72 and 356.219. During 2011, 701 relief associations were in existence in Minnesota. This report includes information on 691 of the 701 relief associations. Ten relief associations are not included in this report because the accuracy of certain data could not be determined in time for inclusion.1 The report also provides investment information on three salaried police relief associations. To obtain analogous comparisons of investment performance, the Office of the State Auditor calculates rates of return for each relief association using a uniform calculation method. Minnesota Statutes, section 356.219, requires the Office of the State Auditor to compute and report total portfolio rates of return, net of all costs and fees. Using a uniform calculation method allows for a fair comparison of investment performance among relief associations. Custom benchmark rates of return calculated by the Office of the State Auditor for each relief association provide a standard against which investment performance may be measured for this group. This report can be used by relief association trustees and municipal officials to compare their associations to those relief associations with similar plan types. Comparisons can be made on rates of return, net assets, funding ratios, and other reporting information. Regional maps are included to assist relief associations in determining average benefit levels and rates of return for their specific regions. Data tables included in this report provide financial, membership, benefit, and investment information. Tables 2-A, 2-B, and 2-C show the key financial and investment indicators for each relief association, including net assets and rates of return. The funding ratios and financial requirement components for each relief association are provided in Tables 3-A, 3-B, and 3-C. Tables 4-A, 4-B, and 4-C show the revenues and expenditures for each relief association. Membership and bylaw information are provided in Tables 5-A, 5-B, and 5-C, while benefit amounts are provided in Tables 6-A, 6-B, and 6-C. Table 7 provides investment information for each relief association. 1
The relief associations excluded from this report consist of nine defined-benefit lump-sum plans and one defined-contribution plan.
1
This page is intentionally left blank.
Executive Summary
Relief associations held $428.4 million in net assets at the end of 2011, representing accrued benefits for 20,183 firefighters. (Pages 6 and 31)
Investment losses totaled $3.3 million in 2011, a significant change from the investment gains of $40.5 million earned in 2010. (Page 8)
In 2011, relief associations received $17.2 million in fire state aid, a 0.6 percent increase from the amount received in 2010. (Page 9)
Relief associations received $12.1 million in municipal contributions in 2011, an 8.3 percent decrease from the $13.2 million received in 2010. Of the $12.1 million received in municipal contributions, $8.2 million was required to be contributed by statute. This required municipal contribution amount was roughly $1.6 million less than was required in 2010. (Page 10)
In 2011, there were 1,453 benefit disbursements to members or their beneficiaries. These disbursements included lump-sum service pensions, monthly service pensions, survivor benefits, and long-term disability benefits. The 1,453 benefit disbursements were nearly identical to the 1,455 benefit disbursements that were made during 2010. (Page 6)
A total of $29.8 million in service pensions was paid out by 399 different relief associations in 2011. The $29.8 million paid out in 2011 represents a 7.2 percent increase from the $27.8 million paid in 2010. (Page 18)
In 2011, relief associations had an average rate of return of negative 0.5 percent. Investment returns decreased from the 8.7 percent average rate of return in 2010. (Page 14)
Rates of return for 220 relief associations, or 31.7 percent, matched or exceeded their calculated custom benchmark rates of return during 2011. This is down from the 69.5 percent of relief associations that matched or exceeded their benchmark return in 2010. (Page 16)
The average rate of return for relief associations over the past ten years was 3.4 percent, below the statutory interest rate assumption of five percent. There were 31 relief associations, or 4.6 percent, over the last ten years that had average rates of return of at least five percent. About 8.4 percent of relief associations had rates of return that were equal to or greater than the State Board of Investment’s Income Share Account for the ten-year period. (Page 16 and 17)
3
Recommendations
Relief associations should make sure that their investment policies include specific target asset allocations and accurately reflect the investment strategy of their plan. Relief associations should also periodically review their plans’ asset allocation to determine if it is appropriate given their investment goals, specific membership profile, and risk tolerance.
In general, relief associations should consider investing in balanced portfolios to avoid major investment losses in a single asset class. The investment policy should be crafted and maintained with a long-term investment perspective in mind. Relief associations must be able to withstand the significant losses that occasionally occur in particular asset classes, and trustees should take a long-term view of the performance of these assets. Moving out of certain investments after their value has declined eliminates the chance of benefiting from eventual market recoveries.
Relief association trustees should understand their fund managers’ investment strategies and hold investment advisors accountable for the performance of the assets being managed. Relief association trustees are not relieved of their fiduciary duties by hiring professional consultants or investment advisors. Trustees and members should regularly compare the investment performance of their advisors with the performance of passively-managed index funds and other benchmarks.
Relief association trustees are encouraged to work cooperatively with municipal officials, and municipal officials who serve as trustees on the association board are encouraged to be thoroughly familiar with the association’s finances and investment performance.
Relief association boards should have a goal of achieving full funding and maintaining a healthy funding ratio. Relief associations that are not fully funded must carefully balance the desire to maintain benefit levels with the duty to ensure that the association remains financially stable for the long term.
To ensure the long-term health of a plan, relief association trustees and municipal officials should be cautious when considering benefit changes. Relief association trustees, members, municipalities, and independent nonprofit firefighting corporation boards must understand the effects that benefit changes have on contribution requirements and the long-term health of the plan before approving new benefit levels. Implementing smaller, but more frequent, benefit changes may provide more stability to municipalities that are required to make contributions, and make benefit amounts more consistent over time.
4
Plan Types A relief association’s plan type is characterized by how the plan is funded. Relief associations can either be defined-benefit retirement plans or defined-contribution retirement plans. A defined-benefit retirement plan provides a retirement benefit that is predetermined based on a formula. The unknown variable for a defined-benefit retirement plan is the amount of funding needed to support the predetermined benefits. Benefits are primarily funded through a combination of fire state aid, municipal contributions, and investment earnings. When revenue from one of these funding sources decreases, pressure may be put on the other funding sources to make up the difference. If a relief association experiences investment losses, for example, a municipality may need to increase its contributions to the association so that benefits are sufficiently funded. A defined-contribution retirement plan provides a retirement benefit with a predetermined amount of funding. The unknown variable for a defined-contribution retirement plan is what a member’s benefit amount will be at retirement. The benefit amount is equal to the member’s individual account balance at the time of retirement. Members of defined-contribution plans receive equal shares of state and municipal contributions and prorated shares of investment earnings. Account balances vary from year to year based on the relief association’s investment performance, revenues, and expenses. Members of a defined-contribution plan receive a one-time lump-sum payment when they retire. Relief associations electing to administer defined-benefit retirement plans are further characterized by how benefits are payable. Defined-benefit retirement plans may either pay benefits as a one-time lump-sum payment or as a monthly payment made from the time of retirement until the member’s death. Nearly 84 percent of relief associations in Minnesota are lump-sum plans, meaning that they pay benefits as a one-time lump-sum payment to members upon their retirement. In lump-sum plans, benefits are paid to members based on an annual benefit level in effect at the time of the member’s separation from active service and membership. Lump-sum plans are the most common plan type because they are generally easier to administer and have fewer associated administrative costs. Only 23, or 3.3 percent, of relief associations offered monthly benefits to retirees. Of these relief associations, 18 provide their members with a choice at retirement of receiving a monthly benefit or a lump-sum benefit. Five relief associations provided only monthly benefits to their members. Monthly benefits are based on the member’s years of service and a monthly benefit amount, and are paid from the time of retirement until the member’s death. Monthly benefit plans are the least common type of plan due to their complexity and higher administrative costs. In fact, the majority of the 18 relief associations that offer their members a choice of receiving a monthly or a lump-sum benefit have discontinued the monthly benefit option for future members.
5
Demographics During 2011, there were 20,183 relief association members who were active, inactive, or deferred. Of the 20,183 relief association members, 16,839 were active members. In 2011, there were 1,453 benefit disbursements made to members or their beneficiaries. These disbursements included lump-sum service pensions, monthly service pensions, survivor benefits, and long-term disability benefits. The 1,453 benefit disbursements made in 2011 were nearly identical in number to the 1,455 benefit disbursements that were made during 2010. In 2011, 29.6 percent of active lump-sum and defined-contribution members had fewer than five years of active service.2 Slightly over half, or 52.6 percent, of the active members had fewer than ten years of service. Of the 668 lump-sum and definedcontribution plans included in this report, 516 had vesting requirements of ten years or more. Assuming a ten-year vesting requirement, over one-half of the active members in these plan types would not yet be eligible to receive pension benefits if they were to retire today. Figure 1 below shows years of service for the active lump-sum and defined-contribution plan members. Figure 1: Years of Service for Active Members – 2011
2
Lump-sum and defined-contribution plans submit reporting forms to the Office of the State Auditor that contain membership information. Monthly and monthly/lump-sum combination plans are not required to provide the same membership data.
6
A member’s age and length of time until retirement are important considerations when setting benefit levels and formulating investment strategies. The largest age demographic was between 35 and 49, which represented 45.1 percent of all active relief association members. In 2011, 18.6 percent of active members were between 50 and 59, and 4.1 percent were age 60 or over. Given that the minimum statutory age for retirement is 50 years, 22.7 percent of active members have already met this requirement. As the population of active members continues to age, relief associations could see an increase in the number and frequency of retirements. Therefore, recruitment and retention become important considerations for relief associations. Figure 2 below shows age ranges of the active lump-sum and defined-contribution plan members. Figure 2: Age of Active Members – 2011
Deferred members are members who have separated from active service and are vested, but have not yet met the minimum retirement age to receive a service pension or have not yet requested payment of a service pension. Of the deferred members, 23.9 percent have served for 20 or more years. Deferred members who are partially vested (have less than 20 years of service) receive a reduced benefit upon retirement based upon the relief association’s bylaws. The largest demographic of deferred members falls in the 35-to-49 age bracket, accounting for 63.6 percent of all deferred members.
7
Revenues For the purposes of this report, relief association revenues are summarized in five different categories. The primary sources of revenue for relief associations are fire state aid, municipal contributions, and investment earnings. Relief associations also receive revenue in the form of reimbursements for supplemental benefits paid and other income, such as donations and transfers. In 2011, total relief association revenues amounted to $27.1 million, down from $72.0 million in 2010. The significant drop in total revenues was primarily due to investment losses totaling $3.3 million in 2011, compared to $40.5 million in investment gains during 2010. Figure 3 below illustrates the revenue sources for relief associations during 2011. Figure 3: Relief Association Revenue Sources – 2011
Fire state aid accounted for $17.2 million of relief association revenue. Municipal contributions totaled $12.1 million. Relief associations also received $653,821 from supplemental benefit reimbursements and $476,828 from other sources of income. Figure 4 on the next page illustrates the primary revenue sources for relief associations from 2007 to 2011. Over this five-year period, fire state aid and municipal contributions remained fairly stable. Investment earnings fluctuated considerably over this time period
8
and had the greatest impact on relief association revenues. The drop in investment earnings during 2008 correlated to the downturn in the financial markets. Figure 4: Relief Association Primary Revenue Sources – 2007 to 2011
Tables 2-A, 2-B, and 2-C on pages 35 through 55 show the net asset value for each relief association at the end of 2011 and the ranking by net assets relative to other associations of the same plan type.
Fire State Aid Fire state aid is derived from a two-percent state tax on insurance premiums and is allocated based on the market value of real property in the fire district and on the population of each fire district. An additional allocation is given to relief associations with small numbers of active members to maintain a minimum amount of aid. When firefighters are covered by a pension plan, state law requires that fire state aid be used for pension purposes. Volunteer fire relief associations received a total of $17.2 million in fire state aid during 2011, a 0.6 percent increase from the $17.1 million received in 2010. Fire state aid amounts remained constant for the majority, or 55.0 percent, of relief associations, while 216 relief associations, or 31.3 percent, saw an increase in their fire state aid revenue during 2011. Relief associations each received an average of $24,865 in fire state aid, representing a 2.2 percent increase from the 2010 average of $24,327. Only 21.3 percent of relief associations received a fire state aid amount that was greater than the 2011 average. The average fire state aid amount for the 578 lump-sum plans included in this report was $20,126. The $11.6 million received by lump-sum plans made up 67.7 percent of the
9
total fire state aid disbursed to relief associations. Defined-contribution plans received a total of $2.9 million in fire state aid, with an average of $32,488. Monthly and monthly/lump-sum combination plans received $2.6 million in fire state aid and averaged $114,137 per plan. This higher average of fire state aid for the monthly and monthly/lump-sum combination plans is due to their concentration in the seven-county Metro Area (Metro Area). Many of these communities have relatively large populations and relatively high property values, the two factors on which the aid allocation is based. The largest single disbursement of fire state aid was made to the Plymouth Fire Relief Association, which received $304,862. The Eden Prairie and Spring Lake Park Fire Relief Associations received $286,728 and $275,312, respectively. Of the 11 relief associations that received over $200,000 in fire state aid, the only lump-sum plans were Lakeville and Woodbury. Fire state aid amounts varied by region due to variation in property values and the difference in population within the fire districts. The 88 relief associations in the Metro Area accounted for $7.7 million, or 45.0 percent, of the total fire state aid disbursed. The average amount received by these 88 relief associations was $87,829, an increase from the 2010 average of $84,952. The 116 relief associations in Greater Minnesota affiliated with municipalities having populations over 2,500 received $4.1 million in fire state aid. The relief associations received an average of $35,750 in fire state aid. Finally, the 487 relief associations in Greater Minnesota affiliated with municipalities having populations under 2,500 received a total of $5.3 million in fire state aid, with an average amount of $10,895. Tables 2-A, 2-B, and 2-C on pages 35 through 55 show the 2011 fire state aid received by each relief association and the ranking by amount of fire state aid relative to other associations of the same plan type.
Municipal Contributions Municipal contributions are contributions to relief associations from cities, towns, and independent nonprofit firefighting corporations. When a municipality approves a relief association’s benefit level, the municipality assumes responsibility for ensuring that the relief association Special Fund has sufficient assets to cover the approved benefit levels. Contributions may be required by law based, in part, on a relief association’s finances, or can be made voluntarily by a local municipality. Relief associations received $12.1 million in municipal contributions, an 8.3 percent decrease from the $13.2 million contributed in 2010. Of the $12.1 million received, $8.2 million, or 67.8 percent, was required by statute to be contributed. The $8.2 million in required municipal contributions is a decrease of 16.3 percent from the $9.8 million required for 2010.
10
Figure 5 below shows the total municipal contributions received by relief associations from 2007 to 2011, and illustrates the amounts required by statute to be contributed and the amounts voluntarily contributed. Figure 5: Relief Association Municipal Contributions – 2007 to 2011
The Eden Prairie Fire Relief Association received the largest municipal contribution, at $830,077. The Eagan Fire Relief Association received the next highest municipal contribution, at $405,546. The average municipal contribution for those relief associations that received one was $23,556. This is a 4.9 percent decrease from the 2010 average of $24,778. Municipal contributions as a percentage of a relief association’s assets varied significantly. The North Branch Fire Relief Association’s municipal contribution of $92,525 made up 28.1 percent of its net assets. North Branch had the lowest funding ratio of all relief associations in 2009, 2010, and 2011, which played a considerable role in the large contribution that was required. The Buhl Fire Relief Association’s required municipal contribution of $15,159 made up 23.7 percent of its net assets. Buhl had a funding ratio of 65.5 percent at the end of 2011. In contrast, the large municipal contribution that the Eden Prairie Fire Relief Association received accounted for only 4.9 percent of its net assets. Lump-sum plans received $7.6 million in municipal contributions, a 9.5 percent decrease from the $8.4 million received in 2010. Of the $7.6 million in municipal contributions
11
made to lump-sum plans, 78.9 percent was required to be contributed. During 2011, 77.0 percent of lump-sum relief associations received a contribution. The Shakopee Fire Relief Association received $351,976, the largest municipal contribution among lumpsum plans. The Farmington, Maplewood, and Rosemount Fire Relief Associations also received municipal contributions that exceeded $150,000. The average municipal contribution among lump-sum plans that received one was $17,007. Required municipal contributions for monthly and monthly/lump-sum combination plans are calculated by an actuary retained by the relief association, using a statutory formula that is different than the statutory formula that is used for lump-sum plans. Monthly and monthly/lump-sum plans received $3.1 million in municipal contributions, an 11.4 percent decrease from the $3.5 million received in 2010. Twenty of the 23 monthly and monthly/lump-sum combination plans received a municipal contribution during 2011, averaging $156,684 per contribution. Typically, monthly and monthly/lump-sum plans have higher municipal contribution amounts as these plans are impacted by the ongoing liabilities of their retired members. Defined-contribution plans by their nature are fully funded because their assets are always equal to their liabilities. All assets are divided among the plan members, and the value of each member’s account rises or falls based on revenues and expenditures to or from the plan. As a result, defined-contribution plans do not require contributions from their affiliated municipality, and any municipal contributions made to a definedcontribution plan are made on a voluntary basis by the municipality. Total municipal contributions made to defined-contribution plans were $1.4 million, a 7.7 percent increase from the $1.3 million received in 2010. During 2011, 53.3 percent of defined-contribution plans received a municipal contribution, with an average of $28,807 for those that received one. The overall average size of each municipal contribution was influenced by the larger municipal contributions to the Eagan, West Metro, and Maple Grove Fire Relief Associations, which were $405,546, $287,270, and $207,442, respectively. The largest municipal contribution for the remaining defined-contribution plans was $60,106 for the Mendota Heights Fire Relief Association. Municipal contribution amounts, like fire state aid amounts, varied by region. Relief associations in the Metro Area received $6.6 million in municipal contributions, which made up 54.2 percent of the total municipal contributions received. Metro Area relief associations accounted for over one-half of all municipal contributions received, even though they make up only 12.7 percent of relief associations included in this report. The average municipal contribution for Metro Area plans that received one was $88,540. Relief associations affiliated with Greater Minnesota municipalities having a population over 2,500 received $2.5 million in municipal contributions, accounting for 21.0 percent of all municipal contributions received. The average municipal contribution for these relief associations was $25,117. Relief associations affiliated with Greater Minnesota municipalities having a population under 2,500 received $3.0 million in municipal contributions, which is 24.8 percent of all
12
municipal contributions received. Of these relief associations, 69.4 percent received a municipal contribution, with the average contribution being $8,863. Tables 2-A, 2-B, and 2-C on pages 35 through 55 show the 2011 municipal contribution received by each relief association and the ranking by amount of municipal contributions received relative to other relief associations of the same plan type.
Investment Earnings Investment returns fluctuated in 2011, compared to steady gains in 2010. Bonds were the top-performing investments in 2011, while international stock performed poorly. The domestic stock asset class showed minimal growth during the year. For the year, domestic stock, as measured by the Russell 3000 Index, returned 1.0 percent. International stock returned negative 13.7 percent, as measured by the Morgan Stanley Capital International (MSCI) All-Country World Index excluding the United States (ACWI ex. U.S.). Bonds returned 7.8 percent, as measured by the Barclays Capital Aggregate Index. Cash returned 0.1 percent, as measured by the 90-Day U.S. Treasury Bill. Figure 6 on the next page shows the 2011 rates of return for domestic stock, international stock, bond, and cash markets. The 2011 rate of return for the State Board of Investment (SBI) Income Share Account, the relief association average rate of return, and the 2011 rate of return for the Voluntary Statewide Lump-Sum Volunteer Firefighter Retirement Plan are included for comparison purposes.
13
Figure 6: Rates of Return – 2011
Current Trends In 2011, relief associations averaged a negative 0.5 percent rate of return. Investment returns decreased from the 8.7 percent average rate of return in 2010. The Sleepy Eye Fire Relief Association had the highest rate of return, at 11.6 percent. Sleepy Eye held an investment portfolio consisting of 80.6 percent bonds and 19.4 percent cash at the end of the year. The Toivola Fire Relief Association returned 10.1 percent. Toivola’s portfolio consisted of 34.3 percent domestic stock, 6.9 percent international stock, 47.5 percent bonds, 10.0 percent cash, and 1.3 percent other investments. The Northland Fire Relief Association returned 8.0 percent. The Kenyon Fire Relief Association had the lowest rate of return, at negative 15.2 percent. Kenyon had a portfolio consisting of 28.2 percent domestic stock, 8.9 percent international stock, 12.7 percent bonds, 49.7 percent cash, and 0.5 percent other investments. The South Bend and Biwabik City Fire Relief Associations returned negative 10.0 percent and negative 9.9 percent, respectively. The average asset allocation for relief associations was 42.3 percent domestic stock, 9.4 percent international stock, 25.3 percent bonds, 21.4 percent cash, and 1.6 percent other investments. Compared to the averages from 2010, domestic stock allocations decreased by 2.5 percent and international stock decreased by 1.8 percent, while bonds increased by 2.5 percent, cash increased by 1.5 percent, and other investments increased by 0.3 percent. Of the relief associations included in this report, 18.7 percent held at least
14
one-half of their assets with the State Board of Investment (SBI). The average rate of return for these relief associations was 1.1 percent. Just over 10.6 percent of relief associations were solely invested in cash and had an average rate of return of 1.4 percent. Of the $3.3 million in investment losses, lump-sum plans accounted for $1.8 million, or 54.2 percent. Investment losses for the 90 defined-contribution plans totaled $577,652, which made up 17.4 percent of total investment losses. Monthly and monthly/lump-sum combination plans lost $940,069, accounting for 28.4 percent of total investment losses. Legislation passed by the 2009 Minnesota Legislature created the Voluntary Statewide Lump-Sum Volunteer Firefighter Retirement Plan (Plan). Seventeen relief associations transferred their assets to the Plan in December 2011 and joined the Plan on January 1, 2012. Since its existence, a total of 35 relief associations have joined the Plan as of January 1, 2012. Each entity in the Plan has its own separate account, but assets are pooled for investment purposes. The Plan investments are managed by the SBI and have a long-term expected return of six percent, but returned 1.2 percent for 2011. The 2011 asset allocation of the Plan is provided in Table 7 on page 155.
Benchmarks The Office of the State Auditor calculates a custom benchmark rate of return for each relief association. Benchmarks serve as a standard against which investment performance can be measured. The benchmark return is the return of a hypothetical portfolio of indices, invested in similar asset classes and in the same proportions as the relief association was invested in at the beginning of 2011. The actual asset allocations at the beginning of the year were used to calculate the custom benchmark rate of return since many relief associations do not have target asset allocations in their investment policies. The benchmark return is not a perfect measure of the plan’s performance, but it is a good indicator of the returns available to the relief association during the year. Table 7 of this report lists each relief association, its custom benchmark, and its 2011 rate of return. Although the indices used to calculate the benchmarks cannot be invested in directly, investments such as mutual funds and exchange traded funds that closely track most indices are widely available. These types of investments are a way for relief associations to invest in the markets as a whole. The indices used in the Table 7 benchmark and the respective returns are as follows: Asset Class Domestic Stock International Stock Bonds Cash Other
Benchmark Russell 3000 MSCI ACWI ex. U.S. Barclays Capital Aggregate 90-Day U.S. Treasury Bill Russell 3000
15
2011 Return 1.0% (13.7)% 7.8% 0.1% 1.0%
Current Trends The Toivola Fire Relief Association exceeded its custom benchmark by 9.0 percent, the highest margin among all relief associations. The Rose Creek Fire Relief Association exceeded its benchmark by 7.6 percent. Rates of return for 220 relief associations, or 31.7 percent, matched or exceeded their calculated custom benchmark rates of return. This is down from the 69.5 percent of relief associations that matched or exceeded their benchmark return in 2010. For 2011, 47.8 percent of relief associations missed their benchmark by one or more percent, an increase from the 18.7 percent that missed their benchmark by one or more percent in 2010. The Kenyon Fire Relief Association missed its respective benchmark by 9.9 percent, the largest deviation among all relief associations. The Golden Valley Fire Relief Association had the highest rate of return among the 88 relief associations in the Metro Area, returning 4.1 percent. The Bethel, Coon Rapids, and Hamburg Fire Relief Associations also had returns of 3.0 percent or higher. All of the plans that returned over 3.0 percent in the Metro Area had diversified portfolios. The Farmington and West Metro Fire Relief Associations both returned negative 5.2 percent for the year, the lowest returns of the Metro Area relief associations. Among the 116 relief associations affiliated with Greater Minnesota municipalities having a population over 2,500, the Sleepy Eye Fire Relief Association had the highest rate of return at 11.6 percent. The Wyoming Fire Relief Association was next in line, returning 4.9 percent. The Jackson and Sauk Centre Fire Relief Associations both returned 4.2 percent for the year. The Byron Fire Relief Association had the lowest rate of return among the relief associations affiliated with Greater Minnesota municipalities having a population over 2,500, returning negative 7.9 percent. The Toivola Fire Relief Association had the highest rate of return among the 487 relief associations affiliated with Greater Minnesota municipalities having a population under 2,500, with a return of 10.1 percent. The Kenyon Fire Relief Association had the lowest rate of return among the relief associations affiliated with Greater Minnesota municipalities having a population under 2,500, returning negative 15.2 percent.
Long-Term Trends The volatility of rates of return over the last ten years has resulted in portfolio values remaining fairly constant, and allows us to measure the performance of relief associations during a time of stagnant investment growth. The U.S. stock market, as measured by the Russell 3000 Index, returned 3.5 percent over the ten-year period. The average bond market return over the ten-year period was 5.8 percent, as measured by the Barclays Capital Aggregate Index. During this ten-year period, the average annual relief association return was 3.4 percent, below the statutory interest rate assumption of five percent. Only 31 of the 678 relief associations in existence for the full period and included in this report had a ten-year average annual rate of return of at least five percent. Not keeping up with interest rate assumptions may harm the financial health of the relief 16
association and could result in diminished benefit increases or larger required municipal contributions. The Saint Martin Fire Relief Association was the highest-returning relief association over the ten-year period, with an average annual return of 7.6 percent. The Ellendale Fire Relief Association had the lowest average annual rate of return over the ten-year period, at negative 1.9 percent. The SBI Income Share Account provides a good example of returns that were available over the ten-year period ending December 31, 2011 (see Table 7). This account had an average annual return over the ten-year period of 4.7 percent. For the relief associations in existence for the entire ten-year period, 57 plans had a rate of return that was equal to or greater than the SBI Income Share Account. The average annual return for the SBI Income Share Account ranked in the 92nd percentile for the ten-year period. Figure 7 below shows relief association weighted average rates of return from 2002 to 2011 and the annual rates of return of the SBI Income Share Account. Figure 7: Annual Rates of Return – 2002 to 2011
17
Expenditures The primary expenditures for relief associations are service pension (retirement) benefit payments, administrative expenses, and other benefit payments. Total expenditures for relief associations in 2011 were $32.5 million, which is a 1.8 percent decrease from the 2010 total of $33.1 million. Figure 8: Relief Association Expenditures – 2011
Benefit Payments Relief associations exist to pay retirement, survivor, and disability benefits to members and their beneficiaries. These benefits compensate volunteer firefighters for their service to the community and assist in the recruitment and retention of volunteers. A total of $29.8 million in service pensions was paid out by 399 different relief associations, a 7.2 percent increase from the $27.8 million paid in 2010. The Maple Grove Fire Relief Association paid $1,307,132 in service pensions during 2011, the largest total expenditure for service pensions among all relief associations. Nearly 84 percent of relief associations in Minnesota are lump-sum plans, meaning that they pay benefits as a one-time lump-sum payment to members upon their retirement. Lump-sum plans paid a total of $18.8 million in service pensions.
18
Defined-contribution plans are similar to lump-sum plans in that members receive a one-time lump-sum payment when they retire. The 90 defined-contribution plans paid a total of $5.0 million in service pensions. In 2011, only 23, or 3.3 percent, of relief associations offered monthly benefits to retirees. Of these relief associations, 18 provided their members with a choice at retirement of receiving a monthly benefit or a lump-sum benefit. Five relief associations provided only monthly benefits to their members. The monthly and monthly/lump-sum combination plans paid $6.0 million in service pensions. Other benefits, such as disability and survivor benefit payments, totaled $706,331, a 2.8 percent decrease from the 2010 total of $726,381. Other benefit payments were paid to members and their beneficiaries by 32 different relief associations. Lump-sum plans paid a total of $616,660 in other benefit payments. Defined-contribution plans paid a total of $26,521 in other benefit payments, while monthly and monthly/lump-sum combination plans paid a total of $63,150.
Administrative Expenses A relief association’s Special Fund is a restricted fund that receives fire state aid and municipal contributions and is used to pay for pensions and other benefits. Disbursements from a Special Fund may be made only for purposes expressly authorized under state law. Relief associations are authorized to use Special Fund assets to pay certain administrative expenses. Administrative expenses include audit, actuarial and legal fees, office expenses, fidelity bond expenses, officer salaries, and training fees. In 2011, administrative expenses totaled $2.0 million, a 9.1 percent decrease from the $2.2 million of administrative expenses in 2010. In 2011, there were 110 relief associations that did not use Special Fund assets to pay administrative expenses. Professional fees, which include audit, actuarial, and legal fees, accounted for the largest portion of administrative expenses. Professional fees totaled $1.3 million, or 65.3 percent, of all administrative expenses. The $1.3 million spent on professional fees is a 7.1 percent decrease from the $1.4 million spent in 2010. Relief associations spent $505,599 on officer salaries, which was a 0.9 percent decrease from the 2010 amount of $510,261. Only 299 relief associations, or 43.3 percent, paid officer salaries from the Special Fund. Five relief associations reported total salary disbursements from the Special Fund of more than $10,000. The average total salary disbursement for the 64 relief associations in the Metro Area that used Special Fund assets to pay officer salaries was $4,240. The Apple Valley Fire Relief Association had the largest total salary disbursement of relief associations in the Metro Area, at $26,360. Only 33.1 percent of relief associations affiliated with Greater Minnesota municipalities having a population under 2,500 used Special Fund assets to pay officer salaries, with an
19
average total disbursement of $716. The Pierz Fire Relief Association had the largest salary disbursement for relief associations in this category, at $3,525. Nearly 63.8 percent of relief associations affiliated with Greater Minnesota municipalities having a population over 2,500 paid officer salaries from the Special Fund, with the average total disbursement at $1,607. The New Ulm Fire Relief Association had the largest salary disbursement of these relief associations, at $6,100. Tables 4-A, 4-B, and 4-C on pages 77 through 101 show the 2011 administrative expenses for each relief association.
20
Health of the Plan Funding Ratios Funding ratios are an important measure in assessing the financial health of a relief association. Funding ratios show the relationship between a relief association’s assets and its liabilities. The average funding ratio for lump-sum plans was 177.5 percent, down from the 2010 average of 250.1 percent. The lump-sum average is skewed by a few exceptionally high funding ratios for recently-incorporated relief associations. The median presents a more accurate picture of the funding of lump-sum plans. The median funding ratio was 102.2 percent, compared to 105.0 percent in 2010. This means that one-half of the lumpsum plans had a funding ratio above 102.2 percent, while one-half of the plans were below 102.2 percent. Monthly and monthly/lump-sum combination plans had an average funding ratio of 84.2 percent. Defined-contribution plans are always 100.0 percent funded, as the liabilities are limited to the total plan assets. Relief association funding ratios decreased as asset values decreased due to investment losses. The effect was an increase in the number of relief associations that had deficits (funding ratios below 100.0 percent). At the end of 2011, 278 relief associations, or 40.2 percent, had a deficit. By contrast, at the end of 2010, 245 relief associations had a deficit. Although the number of relief associations with a deficit increased in 2011, the number of relief associations with funding ratios below 75.0 percent decreased from 29 in 2010 to 26 in 2011. The North Branch Fire Relief Association had the lowest funding ratio, at 45.6 percent. Numerous benefit payments, investment losses, and benefit level increases over the past several years have contributed to North Branch’s low funding ratio. While low funding ratios often trigger greater required municipal contributions, extremely high funding ratios can pose problems as well. Relief associations with excessively high funding ratios may be shortchanging current retiring members. Extremely high funding ratios signal that a relief association’s assets are significantly higher than its liabilities. Because a relief association’s benefit level has a direct impact on its accrued liability, a high funding ratio suggests that the benefit level is low compared to the relief association’s assets. Sixteen relief associations had funding ratios above 200.0 percent. This was a decrease from the 18 relief associations that had funding ratios above 200.0 percent in 2010. The Hollandale Fire Relief Association had the highest funding ratio, at 32,456.8 percent. This relief association, which incorporated in 2006, had a benefit level of $1 per year of service. Another plan with an exceptionally high funding ratio was the Morse-Fall Lake Fire Relief Association, at 5,113.9 percent. This relief association was also recently
21
incorporated. It is normal for funding ratios of recently-incorporated relief associations to be high. Funding ratios of less than 100.0 percent or greater than 200.0 percent may be hard to maintain consistently over time. For under-funded relief associations, continued large required municipal contributions may cause municipalities to become less willing to approve future benefit increase requests. In the case of over-funded relief associations, future benefit increases may be viewed as unfair to retired members who provided service for years when the plan was over-funded. Maintaining a steady funding ratio over time ensures that all retiring members of the relief association receive an equitable pension benefit. Tables 3-A, 3-B, and 3-C on pages 59 through 73 show funding ratios for each relief association.
Benefit Levels Benefit levels vary greatly among relief associations in Minnesota. Typically, relief associations with more assets are able to offer higher benefits to their members. The average benefit level for lump-sum plans was $1,380, a 1.0 percent increase from the 2010 average of $1,366. Only 34.3 percent of lump-sum plans offered a benefit level higher than the 2011 average of $1,380. The maximum lump-sum benefit level allowed under state law for 2011 was $10,000 per year of service. Both the Northfield and Shakopee Fire Relief Associations offered a $7,500 benefit level. A member who retired after serving for 20 years with either of these relief associations would receive a $150,000 lump-sum benefit. The Rosemount Fire Relief Association offered a benefit level of $6,900 per year of service. The Hollandale Fire Relief Association, a newer plan, had a benefit level of $1 per year of service. As this plan builds its assets, corresponding benefit increases should be considered to ensure equitable retirement benefits to its members. Other relief associations offering a benefit level less than $100 per year of service included Brownsville, Kerrick, Morse-Fall Lake, and Nerstrand. For monthly/lump-sum combination plans, the average lump-sum benefit level was $4,527, a 4.2 percent decrease from the 2010 average of $4,725. The Brooklyn Center, Plymouth, and Robbinsdale Fire Relief Associations offered the largest lump-sum benefits of the combination plans, all at $7,500 per year of service. The monthly component of the monthly/lump-sum combination plans had an average benefit of $25. The Eden Prairie and Minnetonka Fire Relief Associations offered the highest monthly benefit levels of the combination plans, at $56 and about $53 per year of service, respectively. A 20-year retiring member from the Eden Prairie Fire Relief Association who chooses the monthly option would receive $1,120 every month after retirement, for the remainder of the member’s life.
22
The average monthly benefit for the five relief associations that offer only monthly benefits was $22 per year of service. The Spring Lake Park Fire Relief Association offered the highest monthly benefit of this group, at $34. The lowest monthly benefit was offered by the Pine City Fire Relief Association, at just over $8 per year of service. During 2011, 15.9 percent of the defined-benefit plans that offer a yearly benefit increased their benefit level. Of the 95 plans that increased their benefit level, 54 were fully funded. The Annandale and Inver Grove Heights Fire Relief Associations had the largest benefit increases, with both increasing their benefit levels by $800 per year of service. The Red Wing Fire Relief Association increased its benefit level by $500. The Saint Augusta Fire Relief Association had the largest percentage benefit increase at 49,900.0 percent, increasing its benefit level from $1 to $500 per year of service. Saint Augusta was 105.3 percent funded after implementing the increase. The Colvill, Culver, Hovland Area, and McKinley Fire Relief Associations each increased their benefit levels by 100.0 percent or more. Of the relief associations that increased their benefit level, 49, or 51.6 percent, had a percentage increase of ten percent or less. Two relief associations decreased their benefit levels during 2011. The McGregor Fire Relief Association decreased its benefit level from $1,700 to $1,600 per year of service, ending the year with an 89.4 percent funding ratio. The Redwood Falls Fire Relief Association lowered its benefit level from $2,975 to $2,775 per year of service, finishing the year with an 86.0 percent funding ratio.
23
Regional Analysis Thirteen economic development regions were established by the Minnesota Legislature. For the reader’s convenience, relief association data is summarized by economic development region and analyzed for regional trends.
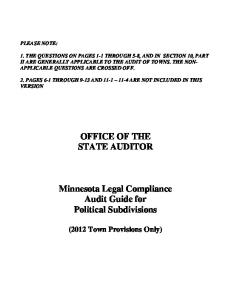
Current Trends In 2011, the Metro Area region continued to have the highest average lump-sum benefit level, at $3,788 per year of service, an increase of 1.4 percent over the 2010 average of $3,734 per year of service. The Central and North Central regions followed, with average benefit levels of $1,754 and $1,538 per year of service, respectively. The Northwest region had the lowest average benefit level, at $759 per year of service. The Northwest region’s average of $759 per year of service was a 0.3 percent increase from the 2010 average of $757 per year of service. The Upper Southwest region had an average benefit level of $834 per year of service, which was a 4.8 percent increase over the 2010 average benefit level of $796 per year of service, the highest percentage increase of the regions. The Southeast region had the highest average funding ratio for defined-benefit plans, at 532.5 percent. This was a decrease from the 2010 average funding ratio of 546.8 percent for the Southeast region. The region’s funding ratio is skewed by the Hollandale Fire Relief Association’s high funding ratio. The relief association was recently incorporated and had a benefit level of $1. The Arrowhead region had an average funding ratio of 171.7 percent. The Southwest Central region had the lowest average funding ratio, at 97.0 percent. Only three regions had average funding ratios below 100.0 percent. Ten regions had negative average rates of return for 2011. The Southwest region had the highest average rate of return, at 0.1 percent. The South Central and Upper Southwest regions were both close behind with average rates of return of 0.0 percent. The Central region had the lowest average rate of return, at negative 1.8 percent. The Metro Area region had an average rate of return of negative 1.2 percent.
Long-Term Trends Relief associations in the Metro Area and Upper Southwest regions had the highest tenyear average rates of return, at 3.4 percent. The West Central and South Central regions had ten-year average rates of return of 3.3 percent and 3.1 percent, respectively. Statutory guidelines assume a rate of five-percent growth for relief associations. All 13 regions saw increases in their ten-year average rates of return in 2011 when compared to 24
2010. However, none of the 13 regions had ten-year average rates of return above five percent. The Northwest and Southwest Central regions had the lowest average rates of return over the ten-year period, at 2.8 percent.
25
2011 Lump-Sum Benefit Level by Economic Development Region
Region 1 $759
Region 2 $1,257 Region 3 $1,059
Economic Regions Region 4 $1,041
Region 5 $1,538 Region 7E $1,455
Region 7W $1,754 Region 6W $834
Region 8 $918
Region 6E $1,136
Region 11 $3,788
Region 9 $1,198
1 2 3 4 5 6E 6W 7E 7W 8 9 10 11
... Northwest ... Headwaters ... Arrowhead ... West Central ... North Central ... Southwest Central ... Upper Southwest ... East Central ... Central ... Southwest ... South Central ... Southeast ... 7-County Metro Area
Region 10 $1,181
Legend $1,200 to $1,500 Greater than $1,500
Less than $900 $900 to $1,199
26
2011 Average Rates of Return by Economic Development Region
Region 1 (0.2)%
Region 2 (0.5)%
Region 3 (0.1)%
Economic Regions Region 5 Region 4
(0.9)%
(0.1)% Region 7E (0.9)%
Region 7W (1.8)% Region 6W 0.0%
Region 8 0.1%
Region 6E (0.6)%
Region 11 (1.2)%
Region 9 0.0%
1 2 3 4 5 6E 6W 7E 7W 8 9 10 11
... Northwest ... Headwaters ... Arrowhead ... West Central ... North Central ... Southwest Central ... Upper Southwest ... East Central ... Central ... Southwest ... South Central ... Southeast ... 7-County Metro Area
Region 10 (0.9)%
Legend (0.4)% to (0.1)% 0.0% and Greater
(1.8)% to (1.2)% (1.1)% to (0.5)%
27
Ten-Year Average Rates of Return by Economic Development Region
Region 1
Region 2 3.0%
2.8%
Region 3 3.1%
Economic Regions Region 4 3.3%
Region 5 3.0% Region 7E 3.1%
Region 7W 3.0% Region 6W Region 6E 2.8% 3.4%
Region 8 3.0%
Region 11 3.4%
Region 9
Region 10
3.1%
3.1%
1 2 3 4 5 6E 6W 7E 7W 8 9 10 11
... Northwest ... Headwaters ... Arrowhead ... West Central ... North Central ... Southwest Central ... Upper Southwest ... East Central ... Central ... Southwest ... South Central ... Southeast ... 7-County Metro Area
Legend 3.1% to 3.2% 3.3% to 3.4%
2.7% to 2.8% 2.9% to 3.0%
28
Data Tables
This page is intentionally left blank.
31 $
Normal Cost
1,069
Total Membership (for 691 reporting)
482
237
Number of Deferred/Inactive Members
Number of Benefit Recipients
832
18
5,212,487
63,150
4,851,598
297,739
3,829,836
-
304,491
1,281,255
2,244,090
3,604,844
Number of Active Members
Relief Associations Reporting
Total Expenses
Other Benefit Expenditures $
$
Administrative Expenses
Service Pension Benefit Expenditures
$
Total Financial Requirements
LESS: 10% of Surplus
Estimated Administrative Expenses
Deficit Amortization Payment
$
Total Revenues
17,050
(919,371)
Investment Earnings
Other
2,397,498
34,500
Municipal Contributions
Supplemental Benefit Reimbursements
$
$
$
$
$
$
$
Fire State Aid
2,075,167
(11,234,732) $
$
$
Surplus or (Deficit)
72,544,764 83,779,496
$
633
15,794
2,234
13,560
578
20,781,272
616,660
18,768,338
1,396,274
23,846,441
2,221,559
1,516,253
2,384,433
22,167,314
18,354,162
425,859
(1,798,216)
7,567,939
525,654
11,632,926
116,245
255,624,623
255,740,868
Lump-Sum Service Pension
Accrued Liabilties
Net Assets
Monthly/Lump-Sum Service Pension Combination
$
$
$
$
$
$
$
$
$
234
206
33
173
5
1,240,106
-
1,174,697
65,409
821,866
-
66,610
370,562
384,694
1,265,488
-
(20,698)
736,191
-
549,995
$
$
$
$
$
$
104
3,114
840
2,274
90
5,280,795
26,521
4,984,883
269,391
-
-
-
-
-
3,856,588
33,919
(577,652)
1,382,736
93,667
2,923,918
-
79,371,244
79,371,244
Defined-Contribution Service Pension
(1,880,279) $
22,628,587
20,748,308
Monthly Service Pension
Table 1 Financial and Membership Summary For the Year Ended December 31, 2011
$
$
$
$
$
$
$
$
1,453
20,183
3,344
16,839
691
32,514,660
706,331
29,779,516
2,028,813
28,498,143
2,221,559
1,887,354
4,036,250
24,796,098
27,081,082
476,828
(3,315,937)
12,084,364
653,821
17,182,006
(12,998,766)
441,403,950
428,405,184
Total All Volunteer Fire Plan Types
32
16 -
8 Years
10 Years
12 Years
13 Years
2 16 -
5 Years
7 Years
8 Years
9 Years
10 Years
12 Years
13 Years
15 Years
19 Years 20 Years
-
-
7 Years
15 Years 20 Years Minimum Years Active Membership in Relief Association
2
5 Years
-
1
Age 60 Age 65 Minimum Years Active Service in Fire Department
17
Age 55
18
Age 50
Minimum Retirement Age
Relief Associations Reporting
Monthly/Lump-Sum Service Pension Combination
4
2
-
1
441
1
1
2
126
4 12
-
1
438
1
2
120
1 1
21
555
578
Lump-Sum Service Pension
Monthly Service Pension
Table 1 Financial and Membership Summary For the Year Ended December 31, 2011
1 1
1
-
-
2
-
-
-
-
1 2
-
-
2
-
-
-
-
-
5
5
1
1
1
-
54
-
-
1
32
1 2
1
-
57
-
1
28
1 -
3
86
90
Defined-Contribution Service Pension
1 6
4
1
1
513
1
1
3
160
6 16
1
1
513
1
3
150
2 1
25
663
691
Total All Volunteer Fire Plan Types
How to Read Tables 2-A Through 2-C
Tables 2-A, 2-B, and 2-C provide relief association financial and investment data. Active Members – Active relief association members as of December 31, 2011. Net Assets – The value of the relief association’s Special Fund assets as of the end of 2011. The net assets include any accounts payable or receivable that were outstanding as of December 31, 2011. The net asset value may therefore differ from the market value of the relief association’s investments. Rank (%-ile) – For Net Assets, and for each of the following categories, the relief association is ranked relative to the other associations of the same benefit type. A rank of 0 percent is the lowest, 100 percent the highest. For example, a fire state aid rank of 87 percent means that the relief association received a fire state aid amount higher than 87 percent of the associations of the same benefit type. State Aid – The amount of fire state aid the relief association received during 2011, or payable for 2011 if not yet received. Municipal Contributions – The amount of city, town, or independent nonprofit firefighting corporation contributions received by the relief association during 2011, or payable for 2011 if not yet received. Pension Amount – For lump-sum plans, the amount per year of service in effect at the end of 2011. A retiring firefighter from a lump-sum plan would receive a benefit equal to the pension amount multiplied by the completed years of active service. Benefits for members of a defined-contribution plan are equal to the member’s account balance. Because the benefits for defined-contribution plan members are not based upon a per-year-of-service amount, there is no applicable pension amount. Table 2-C provides both yearly and monthly benefit amounts. Members for most of the relief associations included in this table have the option of receiving either a lump-sum or a monthly benefit upon retirement. Benefits for members receiving a monthly pension are based on a monthly benefit amount which, when multiplied by the years of service, is the amount a retiring member would receive each month for the rest of his or her life. The yearly benefit amount is the amount per year of service in effect at the end of 2011 for members electing to receive their pension in a lump-sum payment. All pension amounts are subject to reductions if the member had not served the required years of service for full vesting.
33
ROR 2011 – The rate of return earned on the relief association’s investments during 2011. Funding Ratio – The relief association’s December 31, 2011 net assets divided by its accrued liabilities. Over 100 percent means the relief association has more assets than liabilities, while less than 100 percent means it has more projected liabilities than assets.
34
35
Relief Association Ada Adams Adrian Aitkin Albany Albert Lea Township Albertville Almelund Alpha Altura Amboy Annandale Argyle Arlington Arrowhead Askov Atwater Audubon Aurora Avon Babbitt Backus Badger Bagley Balaton Baldwin Balsam Barnesville Barnum Barrett Battle Lake Baudette Bayport Beardsley Beaver Bay Beaver Creek Becker Belgrade
Active Members 34 24 25 29 24 15 30 32 17 23 21 27 25 28 12 18 27 23 23 25 29 16 18 24 25 26 27 26 24 14 20 23 23 20 12 18 28 25
Net Assets $ 285,919 190,110 330,917 500,955 418,548 135,171 510,857 331,718 107,416 112,373 156,689 642,387 114,031 400,841 86,117 175,562 258,748 282,520 222,020 364,581 316,490 294,823 95,242 299,519 157,050 325,107 186,478 185,232 200,478 110,282 407,588 448,858 1,453,043 159,591 123,557 128,913 872,819 296,105
Rank (%-ile) 53 % 34 61 77 71 17 78 61 8 8 24 84 9 70 4 30 49 53 41 67 59 55 6 56 24 60 33 32 36 8 70 73 95 26 13 15 89 55
State Aid $ 11,346 10,037 10,910 39,528 16,120 6,546 39,914 11,346 6,546 9,164 9,164 31,567 10,910 14,520 6,109 7,855 10,705 14,602 9,600 20,395 10,910 15,125 7,855 16,069 11,346 22,985 9,370 15,454 10,910 6,982 20,468 12,608 62,863 8,728 6,109 6,982 51,225 10,910
Rank (%-ile) 51 % 35 43 89 69 5 90 51 5 27 27 85 43 66 3 13 42 66 31 76 43 67 13 69 51 78 30 68 43 8 76 57 94 19 3 8 92 43
Municipal Contributions $ 4,867 7,763 10,000 24,250 29,037 4,000 6,155 3,000 18,863 1,826 2,736 16,243 24,833 10,500 11,800 22,000 7,047 1,158 15,000 8,000 2,329 2,000 253 3,355 10,000 10,084
Rank (%-ile) 46 % 0 57 61 84 88 0 41 0 0 52 36 0 79 30 35 76 0 85 64 67 83 0 55 0 28 73 57 33 31 0 0 0 23 0 37 61 63
Pension Amount $ 790 700 1,000 2,000 1,400 2,000 1,740 700 600 400 800 2,000 465 1,150 600 800 1,000 1,100 1,300 1,700 1,100 1,400 500 1,150 500 1,600 1,100 700 700 475 1,500 1,150 5,400 500 500 500 2,900 850
Table 2-A Financial and Investment Data for Lump-Sum Plans For the Year Ended December 31, 2011 Rank (%-ile) 36 % 30 46 80 65 80 76 30 21 4 36 80 11 56 21 36 46 53 62 74 53 65 12 56 12 71 53 30 30 11 68 56 97 12 12 12 90 41
ROR Rank Funding Rank 2011 (%-ile) Ratio (%-ile) (2.8) % 20 % 92 % 23 % 1.4 73 104 52 3.5 95 119 76 (4.2) 9 87 15 (4.0) 10 108 61 (1.1) 39 69 0 (2.9) 19 98 39 1.4 73 99 42 5.1 98 104 52 (2.3) 25 116 72 2.0 82 92 23 (2.4) 24 133 86 (1.6) 32 99 42 (5.5) 2 95 31 2.5 87 142 89 0.7 62 105 54 (1.5) 33 93 26 3.6 95 104 52 (2.4) 24 70 1 (0.8) 43 94 28 4.3 97 106 57 (6.9) 0 130 84 (0.7) 44 127 82 3.4 94 106 57 1.1 68 107 59 (3.1) 16 174 95 2.2 84 91 22 (4.0) 10 98 39 1.7 77 138 89 (1.8) 31 117 74 0.6 61 121 78 (0.8) 43 129 84 (0.5) 47 112 67 (1.1) 39 129 84 3.0 91 247 98 1.7 77 96 34 (2.9) 19 106 57 (3.1) 16 96 34
36
Relief Association Belle Plaine Bellingham Belview Bemidji Bertha Bethel Big Lake Bigelow Bigfork Bird Island Biwabik City Blackduck Blackhoof Blooming Prairie Blue Earth Bluffton Bovey Bowlus Boyd Braham Brainerd Brandon Breckenridge Breitung Brevator Bricelyn Brimson Brook Park Brooten Browerville Browns Valley Brownsdale Brownsville Brownton Buffalo Buffalo Lake Buhl Butterfield
Active Members 30 20 22 40 16 13 33 24 17 24 17 22 23 28 26 15 13 23 23 19 37 17 27 22 14 21 11 15 24 21 17 21 16 29 29 21 17 22
Net Rank Assets (%-ile) 480,560 75 166,802 28 214,634 40 2,204,195 96 132,992 16 85,765 4 1,052,952 92 136,164 17 176,015 30 180,839 31 209,791 38 160,512 27 104,383 7 341,757 64 818,989 89 139,161 18 118,457 11 122,215 12 158,331 25 268,008 50 2,294,641 97 * * 377,998 68 * * 143,768 20 234,125 44 82,166 3 133,166 16 226,917 42 274,383 52 139,058 18 270,168 51 94,116 6 305,319 57 1,081,631 92 353,222 65 64,025 2 205,631 38
State Aid 36,167 8,728 10,473 124,688 8,728 0 63,428 8,291 10,806 10,910 9,600 14,760 8,728 20,225 17,397 6,982 8,728 9,164 8,291 20,785 145,914 10,910 17,282 9,164 8,728 9,600 6,982 7,418 9,164 11,147 9,164 8,728 8,291 9,600 74,968 10,473 7,855 10,473
Rank (%-ile) 88 19 38 98 19 0 94 15 43 43 31 67 19 76 72 8 19 27 15 77 99 43 71 27 19 31 8 11 27 50 27 19 15 31 96 38 13 38
Municipal Contributions 39,999 154 9,326 2,205 865 8,000 16,100 10,591 10,000 14,113 3,895 4,000 12,000 12,320 750 65,993 10,170 20,899 14,000 1,500 2,600 4,307 1,000 29,242 77,448 7,448 15,159 5,500
Rank (%-ile) 93 0 23 60 32 26 57 0 75 64 61 71 40 41 67 0 68 0 0 25 97 64 81 71 28 0 0 0 0 34 44 0 26 89 98 56 73 50
Pension Amount 2,100 700 700 5,100 800 488 2,800 200 2,100 950 1,400 900 500 1,225 1,700 350 1,100 400 320 1,245 6,825 875 1,200 750 600 700 450 400 700 750 750 800 50 1,000 4,000 1,000 1,000 650
Table 2-A Financial and Investment Data for Lump-Sum Plans For the Year Ended December 31, 2011 Rank (%-ile) 83 30 30 97 36 11 90 1 83 45 65 43 12 60 74 4 53 4 3 61 99 42 57 33 21 30 8 4 30 33 33 36 0 46 95 46 46 27
ROR 2011 (4.6) (3.6) 0.5 (2.6) 1.6 3.0 (0.3) (1.2) (0.1) 1.3 (9.9) (4.9) (1.3) 0.4 (3.6) (2.9) 5.7 (0.1) (0.1) (1.0) (4.8) (3.5) 0.7 0.1 (0.4) 3.0 1.2 3.6 0.4 1.3 (0.7) (3.1) 0.0 (1.2) (5.4) 1.1 (6.2) 1.1
Rank (%-ile) 6 12 61 22 76 91 49 38 53 72 0 5 36 59 12 19 99 53 53 40 6 14 62 56 48 91 71 95 59 72 44 16 55 38 3 68 1 68
Funding Ratio 79 95 102 100 135 135 98 218 76 92 98 81 103 100 116 183 93 100 137 108 92 * 82 * 111 117 207 199 111 167 95 163 914 87 80 100 66 95
Rank (%-ile) 5 31 48 44 87 87 39 98 3 23 39 8 50 44 72 95 26 44 88 61 23 * 9 * 66 74 97 96 66 94 31 94 99 15 6 44 0 31
37
Relief Association Byron Caledonia Calumet Cambridge Campbell Canby Cannon Falls Canosia Canton Carlos Carlton Carsonville Carver Cass Lake Centennial Center City Ceylon Chandler Chatfield Cherry Chisago Chisholm Chokio Clara City Claremont Clarissa Clarkfield Clarks Grove Clear Lake Clearbrook Clearwater Clements Cleveland Clifton Climax Clinton (Big Stone) Cohasset Cokato
Active Members 30 31 13 25 20 24 30 19 20 26 15 24 32 20 40 24 17 15 24 15 22 22 20 20 14 19 27 21 28 21 29 19 27 17 28 23 22 24
Net Rank Assets (%-ile) 341,531 64 373,483 68 255,416 48 355,069 65 201,134 37 334,728 62 548,003 80 324,757 60 72,118 2 728,603 86 197,429 36 * * 523,490 79 415,895 70 2,308,764 97 325,294 60 181,541 31 170,235 28 336,830 62 145,706 21 706,586 86 576,619 81 164,973 27 309,558 57 83,150 3 142,156 19 272,536 51 137,358 17 480,195 75 157,603 25 338,325 63 129,892 15 428,807 71 265,489 50 109,130 8 88,869 5 608,596 83 526,840 79
State Aid 27,606 18,336 9,164 52,734 11,346 13,007 32,866 8,728 8,291 12,219 15,606 11,973 20,170 28,687 103,828 9,279 9,164 7,418 19,592 8,728 23,603 18,070 9,600 10,213 6,912 10,473 12,219 7,200 19,571 11,541 17,934 9,600 11,836 8,728 7,418 9,164 20,524 19,951
Rank (%-ile) 82 74 27 92 51 59 86 19 15 55 68 55 75 83 97 30 27 11 75 19 80 73 31 37 8 38 55 11 75 53 73 31 54 19 11 27 76 75
Municipal Contributions 18,628 2,400 763 10,000 3,000 10,000 33,700 13,372 28,000 10,850 25,500 7,500 775 20,459 100 14,677 34,641 9,305 3,500 5,594 9,254 4,000 12,659 15,388 1,943 13,600 7,252 7,035 15,631 31,156
Rank (%-ile) 79 33 25 61 0 36 0 61 0 92 70 0 87 66 86 56 0 25 81 23 72 92 0 60 38 50 60 0 41 69 74 30 70 55 0 55 74 90
Pension Amount 1,150 1,050 1,450 2,400 500 1,050 1,700 1,000 400 1,750 1,750 500 1,957 2,500 4,000 1,250 550 650 1,300 600 2,700 2,400 500 1,000 700 700 800 450 1,200 950 1,300 650 1,200 1,100 150 600 2,150 1,600
Table 2-A Financial and Investment Data for Lump-Sum Plans For the Year Ended December 31, 2011 Rank (%-ile) 56 52 68 86 12 52 74 46 4 76 76 12 80 87 95 61 19 27 62 21 89 86 12 46 30 30 36 8 57 45 62 27 57 53 1 21 84 71
ROR 2011 (7.9) (1.0) (5.7) (4.2) 5.0 (0.3) (5.6) 1.3 (0.1) 1.5 0.3 0.1 (0.9) (3.2) (1.9) 1.0 (0.3) 1.8 (1.9) 2.2 0.7 (2.9) 2.5 (2.2) (3.6) 1.9 3.2 (2.1) 1.9 2.1 (3.1) (3.5) (0.7) 0.7 0.7 (1.4) (1.9) (3.0)
Rank (%-ile) 0 40 2 9 98 49 2 72 53 75 58 56 41 15 29 67 49 78 29 84 62 19 87 26 12 80 93 27 80 83 16 14 44 62 62 35 29 17
Funding Ratio 81 98 88 84 97 136 90 115 101 116 172 * 93 147 108 109 117 108 95 181 105 88 157 100 99 79 103 115 124 117 94 90 108 127 268 77 101 83
Rank (%-ile) 8 39 16 12 37 88 21 71 46 72 94 * 26 91 61 64 74 61 31 95 54 16 93 44 42 5 50 71 80 74 28 21 61 82 98 4 46 10
38
Relief Association Cold Spring Coleraine Colvill Colvin Comfrey Cook Cosmos Cottage Grove Cotton Cottonwood Courtland Cromwell Crooked Lake Crookston Crosby Culver Currie Cuyuna Cyrus Dalton Danube Danvers Darfur Dassel Dawson Dayton Deer Creek Deer River Deerwood Delano Delavan Dent Detroit Lakes Dexter Dodge Center Dover Dovray Dumont
Active Members 28 14 12 10 23 16 14 50 18 26 21 22 16 26 26 9 17 20 19 24 25 11 18 26 25 29 17 20 20 28 18 24 29 19 22 20 22 22
Net Rank Assets (%-ile) 900,019 90 197,379 36 * * 62,387 1 209,730 38 338,756 63 194,561 35 1,780,252 96 160,172 26 338,506 63 312,288 58 344,972 65 142,110 19 494,217 76 356,459 66 46,075 0 121,463 12 165,775 27 129,330 15 244,770 46 157,078 25 83,733 4 185,583 33 805,743 88 326,070 60 510,211 77 155,970 24 339,292 63 276,972 52 685,462 85 171,160 28 236,713 45 1,740,637 95 151,649 22 527,892 79 217,876 41 40,065 0 117,931 10
State Aid 29,494 7,930 5,673 6,546 10,037 14,398 6,981 120,470 13,091 12,219 9,600 11,782 8,291 14,908 17,267 2,766 9,600 10,472 7,855 10,473 7,855 6,982 6,982 23,431 12,561 21,358 8,728 24,295 16,692 34,625 8,291 12,637 61,190 6,982 12,292 9,164 5,673 8,728
Rank (%-ile) 84 15 2 5 35 65 8 98 59 55 31 53 15 67 71 0 31 38 13 38 13 8 8 79 56 77 19 80 70 88 15 57 94 8 55 27 2 19
Municipal Contributions 15,500 17,321 3,300 5,350 4,000 1,500 4,200 15,998 1,044 2,400 15,000 45,708 4,225 5,565 21,236 4,500 33,601 32,856 20,641 14,238 14,236 26,500 1,600 15,496 8,180 12,623 2,000 175 -
Rank (%-ile) 74 77 37 50 41 28 0 43 0 0 75 27 33 73 95 43 50 82 0 0 0 0 44 91 91 81 72 72 0 87 29 0 74 58 69 31 23 0
Pension Amount 1,900 1,250 500 800 625 1,500 850 3,600 400 600 1,200 1,300 550 1,700 2,050 400 600 850 400 600 550 750 400 2,300 1,800 1,500 625 1,750 1,100 2,525 750 700 4,700 400 1,700 850 160 300
Table 2-A Financial and Investment Data for Lump-Sum Plans For the Year Ended December 31, 2011 Rank (%-ile) 79 61 12 36 27 68 41 94 4 21 57 62 19 74 82 4 21 41 4 21 19 33 4 85 77 68 27 76 53 88 33 30 96 4 74 41 1 2
ROR 2011 (2.3) (0.3) (0.1) (1.3) 1.0 1.0 (2.8) (1.7) (0.8) 1.3 1.5 (4.2) 3.0 (0.8) (1.9) (2.1) 2.4 0.8 1.4 2.0 (0.7) 1.3 1.4 (0.7) 2.0 0.3 0.7 (4.9) (1.4) (0.8) 0.2 (5.3) 1.9 2.0 (2.3) 0.0 (1.1) 1.1
Rank (%-ile) 25 49 53 36 67 67 20 31 43 72 75 9 91 43 29 27 86 65 73 82 44 72 73 44 82 58 62 5 35 43 57 3 80 82 25 55 39 68
Funding Ratio 100 97 * 103 102 95 160 114 191 163 88 92 127 93 71 81 91 72 160 117 121 102 120 107 82 88 116 92 113 76 115 94 111 120 128 108 99 129
Rank (%-ile) 44 37 * 50 48 31 93 69 96 94 16 23 82 26 1 8 22 2 93 74 78 48 77 59 9 16 72 23 68 3 71 28 66 77 83 61 42 84
39
Relief Association Dunnell Eagle Bend Eagle Lake East Bethel East Grand Forks Eastern Hubbard Easton Echo Eden Valley Edgerton Eitzen Elizabeth Elk River Elko New Market Ellendale Ellsworth Elmer Elmore Elrosa Ely Elysian Emily Evansville Eveleth Excelsior Eyota Fairfax Farmington Fayal Federal Dam Fergus Falls Fertile Fifty Lakes Finland Finlayson Flensburg Floodwood Foley
Active Members 16 20 19 34 27 21 26 18 25 22 27 21 38 25 19 25 11 15 23 27 26 24 23 20 46 25 21 45 23 8 39 25 17 22 21 22 22 23
Net Assets 120,513 257,155 296,586 1,118,122 772,892 253,665 142,932 191,019 431,211 256,696 151,953 154,207 2,260,830 1,314,545 142,384 252,059 88,759 214,242 315,916 554,521 312,043 181,908 157,703 389,597 3,571,611 293,249 266,816 1,562,690 339,232 86,682 2,092,319 257,307 87,037 224,257 172,576 121,658 236,654 747,685
Rank (%-ile) 11 49 56 93 87 48 20 34 72 49 23 23 97 94 20 47 5 40 58 80 58 31 25 69 99 55 50 95 63 4 96 49 5 41 29 12 44 87
State Aid 6,546 10,910 12,766 39,383 36,203 8,323 10,037 9,164 13,883 10,562 10,910 9,164 116,902 34,533 8,291 10,910 6,982 10,473 13,091 17,781 9,471 9,694 13,090 10,473 92,866 12,495 11,782 87,709 9,600 4,031 58,411 11,027 5,673 14,593 13,091 6,720 11,782 34,068
Rank (%-ile) 5 43 57 89 88 19 35 27 64 42 43 27 98 87 15 43 8 38 59 72 30 35 59 38 97 56 53 96 31 0 93 50 2 66 59 8 53 87
Municipal Contributions 6,607 24,794 28,315 6,000 2,495 950 3,500 4,281 3,650 6,573 38,500 78,467 3,000 3,781 9,000 20,344 12,202 5,000 24,204 88,124 4,025 11,401 187,713 15,632 24,632 300 7,500
Rank (%-ile) 0 53 85 88 0 51 34 26 38 44 39 53 93 98 36 0 0 40 59 0 81 68 46 84 98 42 67 99 75 0 85 0 0 0 0 24 0 56
Pension Amount 450 900 1,700 3,400 2,100 1,100 450 600 1,000 850 450 600 5,091 3,500 500 500 250 1,100 700 1,600 900 750 480 1,900 6,250 1,200 1,700 4,575 1,500 100 3,900 800 600 650 600 575 1,000 2,100
Table 2-A Financial and Investment Data for Lump-Sum Plans For the Year Ended December 31, 2011 Rank (%-ile) 8 43 74 93 83 53 8 21 46 41 8 21 97 94 12 12 2 53 30 71 43 33 11 79 98 57 74 96 68 0 95 36 21 27 21 21 46 83
ROR 2011 1.3 0.8 1.0 (4.1) 3.0 0.9 (4.3) (0.6) (5.8) 2.3 2.3 0.9 (2.6) (0.2) (3.0) 1.8 6.3 0.6 (1.5) (1.9) 1.5 (7.1) (2.0) (4.5) (1.9) 3.1 1.8 (5.2) 3.7 (5.3) 3.4 (2.3) 0.8 1.2 1.9 (0.9) (3.8) (2.4)
Rank (%-ile) 72 65 67 10 91 66 8 46 1 85 85 66 22 51 17 78 99 61 33 29 75 0 28 7 29 92 78 4 96 3 94 25 65 71 80 41 11 24
Funding Ratio 135 95 89 108 107 144 92 121 104 112 109 83 89 116 92 108 183 95 96 92 94 79 124 88 97 111 88 71 108 577 103 99 123 102 114 94 127 112
Rank (%-ile) 87 31 19 61 59 90 23 78 52 67 64 10 19 72 23 61 95 31 34 23 28 5 80 16 37 66 16 1 61 99 50 42 80 48 69 28 82 67
40
Relief Association Forada Forest Lake Foreston Franklin Frazee Fredenberg French Township Frost Fulda Garfield Garrison Garvin Gaylord Geneva Ghent Gilbert Glenwood Glyndon Gnesen Golden Valley Gonvick Good Thunder Goodland Goodview Graceville Granada Grand Lake Grand Meadow Grand Rapids Granite Falls Green Isle Greenbush Greenwood Grey Eagle Grove City Grygla Hackensack Hallock
Active Members 24 34 15 19 25 14 27 18 21 24 23 12 25 22 22 21 28 23 27 48 19 23 16 31 25 13 27 25 31 31 20 33 14 18 18 19 31 28
Net Assets 251,913 1,642,939 229,674 288,689 211,705 210,383 143,964 175,414 286,680 319,376 633,195 108,303 430,112 126,995 128,985 185,129 370,942 355,091 228,230 4,012,194 200,985 272,956 95,860 312,672 189,703 56,600 301,579 339,052 1,763,048 365,782 185,484 212,569 391,782 241,604 181,413 129,214 595,214 161,731
Rank (%-ile) 47 95 43 54 39 39 20 30 54 59 84 8 72 14 15 32 67 66 43 99 36 51 6 58 34 1 56 63 95 67 32 39 69 46 31 15 82 27
State Aid 10,473 89,503 10,037 8,728 17,835 6,546 10,910 9,600 12,901 11,500 25,721 6,546 13,791 6,218 6,982 8,728 22,264 11,346 10,910 97,286 8,728 9,544 7,855 13,091 10,910 7,418 13,091 13,356 86,016 16,635 10,473 13,091 13,282 10,141 8,728 8,728 16,946 12,219
Rank (%-ile) 38 96 35 19 73 5 43 31 58 53 81 5 64 5 8 19 78 51 43 97 19 30 13 59 43 11 59 62 96 70 38 59 62 37 19 19 71 55
Municipal Contributions 13,650 18,500 10,000 8,728 10,960 6,500 3,194 2,500 4,000 15,558 13,600 34,165 10,624 34,165 12,800 97,604 4,176 6,900 10,763 2,500 3,757 25,993 5,000 26,795 10,082 3,913 30,000 5,600 290 5,000 24,350 -
Rank (%-ile) 71 79 61 59 66 52 37 34 41 74 70 0 92 0 0 65 92 0 70 98 43 54 0 65 34 0 40 87 46 87 63 40 89 50 24 46 84 0
Pension Amount 800 4,500 1,000 1,000 1,200 800 500 550 1,000 1,000 3,100 450 1,350 200 525 1,100 1,600 900 1,000 6,700 650 975 550 1,400 550 500 1,375 1,100 5,000 1,350 775 500 1,500 750 1,000 250 1,800 500
Table 2-A Financial and Investment Data for Lump-Sum Plans For the Year Ended December 31, 2011 Rank (%-ile) 36 96 46 46 57 36 12 19 46 46 92 8 65 1 18 53 71 43 46 99 27 45 19 65 19 12 65 53 97 65 35 12 68 33 46 2 77 12
ROR 2011 (3.1) (3.6) (1.0) 1.4 (2.9) (1.6) (1.3) 1.1 2.7 0.3 (4.0) (1.1) (0.1) (2.8) (0.1) (1.8) 3.0 0.6 0.1 4.1 0.4 0.2 2.3 (1.8) 3.3 (5.6) (0.3) (3.0) (1.9) (1.7) (2.3) (1.5) 2.6 (0.2) 1.1 (0.9) 1.1 (4.0)
Rank (%-ile) 16 12 40 73 19 32 36 68 88 58 10 39 53 20 53 31 91 61 56 97 59 57 85 31 93 2 49 17 29 31 25 33 88 51 68 41 68 10
Funding Ratio 144 97 96 124 78 109 93 104 122 110 98 106 89 153 111 90 85 105 85 106 114 104 161 88 131 106 107 94 110 84 114 86 114 105 92 182 92 98
Rank (%-ile) 90 37 34 80 4 64 26 52 79 65 39 57 19 92 66 21 12 54 12 57 69 52 93 16 85 57 59 28 65 12 69 14 69 54 23 95 23 39
41
Relief Association Halstad Ham Lake Hamburg Hamel Hancock Hanley Falls Hanska Harmony Harris Hartland Hastings Hayfield Hayward Hector Henderson Hendricks Hendrum Henning Herman Hermantown Heron Lake Hewitt Hibbing Hill City Hills Hinckley Hitterdal Hoffman Hokah Holdingford Holland Hollandale Hopkins Houston Hovland Area Howard Lake Hoyt Lakes Hugo
Active Members 25 30 28 26 24 24 27 27 18 17 46 21 23 24 25 29 21 25 21 25 16 15 16 23 20 21 19 22 24 28 21 17 33 25 13 27 19 28
Net Assets 212,686 1,228,896 518,333 1,174,503 204,907 115,211 183,975 267,029 148,359 141,347 3,215,829 295,272 287,709 443,372 196,504 180,623 141,993 285,679 121,915 909,736 156,621 112,823 343,664 140,361 112,484 497,522 145,034 149,566 106,307 203,075 181,619 76,598 1,935,986 269,020 125,532 402,290 252,106 704,605
Rank (%-ile) 39 94 78 93 37 9 32 50 22 19 98 55 54 73 35 30 19 53 12 90 24 9 64 19 9 77 21 22 7 37 31 3 96 51 14 70 47 86
State Aid 10,473 56,655 11,781 30,230 10,037 10,037 10,910 10,910 8,291 9,164 112,798 15,607 9,600 11,815 10,473 10,910 8,291 10,937 10,910 33,935 8,728 6,109 15,621 10,037 11,346 21,088 6,546 10,473 13,091 10,473 8,728 8,728 65,039 10,910 5,701 15,227 10,910 50,335
Rank (%-ile) 38 93 53 85 35 35 43 43 15 27 98 68 31 54 38 43 15 50 43 86 19 3 68 35 51 77 5 38 59 38 19 19 94 43 3 68 43 91
Municipal Contributions 2,000 14,796 46,725 44,344 1,500 5,000 1,800 18,481 4,500 22,906 14,185 12,734 3,263 36,650 900 4,954 11,111 5,000 3,102 77 3,167 4,600 32,166 3,427 8,000 31,107 18,650 17,344
Rank (%-ile) 31 72 95 94 0 0 28 46 30 0 0 78 44 0 83 71 0 70 37 93 26 0 46 66 46 36 23 36 0 45 0 0 91 38 57 90 79 77
Pension Amount 600 3,200 1,450 2,300 600 400 510 750 1,100 425 4,500 1,500 800 1,200 1,000 700 600 1,000 650 2,900 600 500 1,200 615 750 1,300 500 650 475 900 250 1 5,300 925 800 1,400 1,500 2,700
Table 2-A Financial and Investment Data for Lump-Sum Plans For the Year Ended December 31, 2011 Rank (%-ile) 21 93 68 85 21 4 18 33 53 7 96 68 36 57 46 30 21 46 27 90 21 12 57 26 33 62 12 27 11 43 2 0 97 44 36 65 68 89
ROR 2011 1.9 (2.0) 3.1 (1.0) 4.2 0.4 0.0 (0.9) (1.3) (1.0) (0.3) (5.9) 0.6 3.0 0.6 (0.2) 0.7 (0.5) (0.1) 3.0 (2.4) 1.2 (2.6) (4.4) (6.6) (0.8) 2.0 1.4 (0.3) (0.3) (3.2) (5.3) (2.3) (0.1) (1.1) (2.0) (5.1) (1.5)
Rank (%-ile) 80 28 92 40 97 59 55 41 36 40 49 1 61 91 61 51 62 47 53 91 24 71 22 7 1 43 82 73 49 49 15 3 25 53 39 28 5 33
Funding Ratio 115 93 90 125 111 119 124 99 99 231 105 83 150 118 77 83 120 85 100 118 107 126 103 80 104 132 107 86 93 87 199 32457 107 101 184 80 82 106
Rank (%-ile) 71 26 21 81 66 76 80 42 42 98 54 10 92 75 4 10 77 12 44 75 59 81 50 6 52 85 59 14 26 15 96 100 59 46 96 6 9 57
42
Relief Association Ideal Industrial International Falls Inver Grove Heights Iona Isanti Isle Jackson Jacobson Janesville Jasper Jeffers Jordan Kandiyohi Karlstad Kasota Kasson Keewatin Kelliher Kellogg Kennedy Kensington Kerrick Kettle River Kilkenny Kimball Kinney La Crescent La Salle Lafayette Lake Benton Lake Bronson Lake City Lake Crystal Lake Elmo Lake Henry Lake Kabetogama Lake Lillian
Active Members 30 15 26 60 16 20 24 27 25 26 24 22 39 18 31 22 20 18 20 29 13 25 20 17 20 27 16 27 15 28 19 19 20 23 23 22 12 15
Net Assets 596,854 260,179 573,440 3,377,280 76,755 1,094,977 360,932 557,390 118,753 240,809 156,477 134,573 604,116 286,878 148,281 323,463 343,387 116,089 165,765 316,827 119,781 221,139 19,596 116,093 249,570 269,782 185,898 427,780 54,916 323,962 205,871 87,133 778,310 434,786 887,064 135,140 151,556 119,767
Rank (%-ile) 82 50 81 98 3 93 66 80 11 45 24 17 83 54 21 60 64 10 27 59 11 41 0 10 47 51 33 71 1 60 38 5 88 72 89 17 22 11
State Aid 20,449 7,418 41,958 124,167 3,927 51,206 21,798 20,586 6,982 13,963 9,600 8,728 30,150 8,728 13,091 13,993 26,616 9,164 10,037 10,037 6,546 10,473 6,109 8,291 9,600 12,843 8,291 22,834 5,673 9,600 10,929 6,109 33,676 18,808 37,692 6,677 8,291 6,546
Rank (%-ile) 76 11 90 98 0 92 77 76 8 64 31 19 84 19 59 64 82 27 35 35 5 38 3 15 31 58 15 78 2 31 49 3 86 74 88 8 15 5
Municipal Contributions 35,916 5,000 13,867 59,976 5,000 409 24,256 4,360 3,529 42,350 7,017 8,500 26,928 21,569 2,473 4,000 300 5,031 3,436 7,000 5,000 5,484 4,000 1,000 28,690 31,380 9,807 1,500 2,788
Rank (%-ile) 92 46 71 0 0 96 46 0 24 84 44 39 94 54 0 59 87 82 33 41 24 49 0 38 54 46 0 50 0 41 26 0 88 90 61 28 0 35
Pension Amount 2,100 700 2,750 5,800 300 3,800 967 1,700 400 1,400 650 500 1,900 1,100 350 1,300 2,000 1,600 560 680 350 750 50 600 800 825 650 1,600 400 1,025 700 400 3,250 2,000 3,100 425 750 700
Table 2-A Financial and Investment Data for Lump-Sum Plans For the Year Ended December 31, 2011 Rank (%-ile) 83 30 89 98 2 94 45 74 4 65 27 12 79 53 4 62 80 71 21 30 4 33 0 21 36 40 27 71 4 51 30 4 93 80 92 7 33 30
ROR 2011 (3.0) 3.9 (1.5) (0.2) (2.0) (5.1) (5.5) 4.2 (2.8) 1.9 (1.5) (1.4) 1.5 2.7 1.1 (1.3) (5.8) (4.5) 3.7 (1.5) (1.3) 3.4 0.3 1.1 (1.4) 1.1 (1.4) 1.7 3.4 1.9 0.7 0.9 2.7 (2.8) (0.2) (2.6) 0.2 1.7
Rank (%-ile) 17 96 33 51 28 5 2 97 20 80 33 35 75 88 68 36 1 7 96 33 36 94 58 68 35 68 35 77 94 80 62 66 88 20 51 22 57 77
Funding Ratio 83 120 95 113 110 79 105 98 114 80 89 86 84 96 152 122 82 72 104 100 207 106 124 110 105 104 122 94 109 127 134 148 96 81 116 118 120 91
Rank (%-ile) 10 77 31 68 65 5 54 39 69 6 19 14 12 34 92 79 9 2 52 44 97 57 80 65 54 52 79 28 64 82 87 91 34 8 72 75 77 22
43
Relief Association Lake Park Lake Wilson Lakefield Lakeville Lakewood Lamberton Lancaster Lanesboro Le Sueur Leaf Valley LeRoy Lester Prairie Lewiston Lewisville Lindstrom Linwood Lismore Litchfield Little Canada Little Falls Littlefork Long Lake Long Prairie Lonsdale Loretto Lower Saint Croix Valley Lowry Lucan Luverne Lynd Mabel Madelia Madison Madison Lake Mahnomen Mahtowa Makinen Mantorville
Active Members 21 21 24 85 22 19 24 22 23 16 24 30 32 17 26 28 28 28 33 34 26 41 22 26 27 26 24 23 33 11 20 26 26 24 25 22 13 30
Net Rank Assets (%-ile) 175,011 29 159,189 26 337,195 62 5,619,763 99 255,315 48 158,290 25 125,764 14 276,444 52 671,828 85 206,974 38 153,675 23 * * 417,636 71 222,426 41 642,562 85 470,977 74 135,388 17 526,546 79 1,687,941 95 959,239 91 217,116 40 1,384,617 94 434,679 72 555,974 80 1,273,449 94 1,130,563 93 334,288 61 98,780 7 712,458 86 81,439 3 104,993 7 229,996 43 138,311 18 261,542 50 302,559 57 118,356 10 84,821 4 287,111 54
State Aid 14,118 7,418 14,754 213,067 10,910 8,728 8,291 9,600 25,249 8,291 10,473 13,091 18,252 7,855 26,290 18,049 10,037 40,001 37,917 52,420 11,346 74,962 23,461 31,514 21,915 31,250 10,037 9,600 23,110 6,546 8,728 13,327 10,910 10,473 10,910 6,982 0 9,130
Rank (%-ile) 65 11 66 99 43 19 15 31 81 15 38 59 73 13 81 73 35 90 89 92 51 95 79 85 77 85 35 31 79 5 19 62 43 38 43 8 0 27
Municipal Contributions 287 2,435 44,804 11,103 3,500 18,000 5,800 16,000 11,557 18,891 28,365 24,489 36,952 30,696 5,910 6,000 20,000 70,000 21,226 5,000 12,078 3,340 16,204 10,931 6,689 800 4,122 7,212 3,500
Rank (%-ile) 0 24 33 94 0 66 0 38 78 51 0 75 67 0 80 88 0 85 93 90 51 0 51 80 97 82 46 0 68 0 37 75 66 53 25 42 55 38
Pension Amount 875 600 1,000 6,230 650 950 500 1,100 2,600 900 450 925 1,250 700 2,295 2,000 300 2,000 3,150 3,000 875 2,889 1,750 1,900 4,200 3,100 800 450 2,000 450 525 1,200 1,000 1,100 1,100 500 500 800
Table 2-A Financial and Investment Data for Lump-Sum Plans For the Year Ended December 31, 2011 Rank (%-ile) 42 21 46 98 27 45 12 53 88 43 8 44 61 30 85 80 2 80 93 91 42 90 76 79 95 92 36 8 80 8 18 57 46 53 53 12 12 36
ROR 2011 (3.4) 1.2 (2.5) (2.0) (0.7) (0.5) 1.8 (2.2) (4.1) (0.7) 2.6 (3.7) 0.8 2.1 (3.5) 2.3 0.8 (3.2) (4.1) (3.6) 1.7 (4.0) (1.4) (4.4) (2.9) (3.4) (0.8) (0.9) (2.1) (2.8) (0.3) 3.2 1.0 (4.3) (2.2) (2.1) 0.4 (1.0)
Rank (%-ile) 14 71 23 28 44 47 78 26 10 44 88 12 65 83 14 85 65 15 10 12 77 10 35 7 19 14 43 41 27 20 49 93 67 8 26 27 59 40
Funding Ratio 100 101 114 103 113 85 131 93 108 80 119 * 106 120 95 94 114 83 93 86 125 103 90 113 88 97 108 102 100 129 99 68 75 112 101 121 80 109
Rank (%-ile) 44 46 69 50 68 12 85 26 61 6 76 * 57 77 31 28 69 10 26 14 81 50 21 68 16 37 61 48 44 84 42 0 3 67 46 78 6 64
44
Relief Association Maple Hill Maple Lake Maple Plain Mapleton Mapleview Maplewood Marble Marshall Mayer Maynard McDavitt McGrath McGregor McIntosh McKinley Meadowlands Medford Melrose Menahga Middle River Miesville Milaca Milan Miltona Minneota Minnesota Lake Mission Montevideo Montgomery Monticello Montrose Moose Lake Mora Morgan Morris Morristown Morse-Fall Lake Morton
Active Members 12 30 25 23 12 41 13 44 27 22 17 16 24 20 15 10 27 25 20 23 33 20 20 22 29 23 19 28 30 26 27 26 28 20 27 23 22 20
Net Rank Assets (%-ile) 193,635 35 907,322 90 925,123 90 400,397 69 171,083 28 4,477,821 99 229,081 43 2,551,916 97 511,813 78 252,207 47 105,506 7 157,342 25 477,614 75 125,462 14 * * 64,305 2 240,197 45 337,047 62 277,920 52 159,151 26 252,589 48 669,976 85 186,507 33 227,090 42 283,706 53 225,623 42 276,450 52 439,384 72 443,183 73 1,127,049 93 505,860 77 226,839 42 575,199 81 424,322 71 589,558 82 509,033 77 57,787 1 183,939 32
State Aid 7,418 32,881 16,861 13,109 0 152,528 8,291 59,026 10,473 10,037 7,855 8,728 27,034 7,418 4,800 5,673 10,910 20,040 9,089 8,291 13,091 29,686 8,728 10,910 13,221 10,910 13,962 24,445 18,386 72,647 13,359 22,823 38,168 10,563 23,927 14,126 30,204 8,728
Rank (%-ile) 11 86 70 61 0 99 15 94 38 35 13 19 82 11 1 2 43 75 26 15 59 84 19 43 62 43 64 80 74 95 62 78 89 42 80 65 84 19
Municipal Contributions 8,000 13,000 25,750 4,950 222,110 8,000 134,649 32,101 9,683 27,360 2,251 15,000 4,929 2,000 3,495 8,617 3,474 2,000 10,594 6,767 17,034 42,000 12,074 17,340 23,484 2,400 6,734
Rank (%-ile) 57 70 86 46 0 99 57 99 90 0 61 0 87 32 0 0 73 46 31 0 38 0 0 59 38 31 64 54 77 0 94 68 0 77 0 84 33 53
Pension Amount 1,000 1,700 2,100 1,800 500 5,500 1,450 4,700 1,600 650 1,000 500 1,600 600 600 300 725 1,250 1,100 400 500 2,400 500 1,000 1,000 800 1,500 1,700 1,800 2,750 1,500 1,000 1,700 1,600 1,700 1,700 10 800
Table 2-A Financial and Investment Data for Lump-Sum Plans For the Year Ended December 31, 2011 Rank (%-ile) 46 74 83 77 12 98 68 96 71 27 46 12 71 21 21 2 33 61 53 4 12 86 12 46 46 36 68 74 77 89 68 46 74 71 74 74 0 36
ROR 2011 3.2 (1.0) 1.9 3.5 0.9 0.4 (1.9) (0.9) 1.5 (1.1) 0.6 1.2 (4.3) 0.7 1.3 5.9 (4.5) 3.4 5.5 1.7 (0.9) (2.0) 1.6 (1.4) (1.0) (0.4) 3.6 (0.3) (3.4) (0.5) (5.3) (5.3) (0.7) (3.1) (3.1) 0.8 (0.1) (2.5)
Rank (%-ile) 93 40 80 95 66 59 29 41 75 39 61 71 8 62 72 99 7 94 98 77 41 28 76 35 40 48 95 49 14 47 3 3 44 16 16 65 53 23
Funding Ratio 136 91 97 119 278 105 118 91 101 108 99 137 89 96 * 206 96 96 108 192 95 99 136 93 110 105 90 96 103 91 101 95 100 102 97 98 5114 91
Rank (%-ile) 88 22 37 76 99 54 75 22 46 61 42 88 19 34 * 97 34 34 61 96 31 42 88 26 65 54 21 34 50 22 46 31 44 48 37 39 99 22
45
Relief Association Motley Mountain Iron Mountain Lake Nashwauk Nerstrand Nevis New Auburn New Brighton New Germany New London New Munich New Prague New Richland New York Mills Newfolden Newport Nicollet Nisswa Normanna North Branch North Mankato North Saint Paul Northfield Northland Northome Norwood Young America Oak Grove Oakdale Odin Ogilvie Okabena Olivia Onamia Ormsby Oronoco Orr Ortonville Osakis
Active Members 17 17 25 26 17 17 18 40 22 24 19 30 22 19 15 26 24 24 9 25 35 39 31 11 18 31 32 42 14 25 17 24 20 19 22 14 30 20
Net Rank Assets (%-ile) 191,824 34 222,954 41 195,391 35 301,235 56 47,923 0 231,899 44 139,537 18 2,848,076 98 445,472 73 251,006 47 115,259 10 550,733 80 231,255 44 172,596 29 138,848 18 847,735 89 277,182 52 597,264 83 * * 329,742 61 1,299,077 94 1,091,613 92 3,315,338 98 84,329 4 131,413 16 481,487 75 976,084 91 1,976,753 96 120,346 11 186,067 33 168,298 28 280,970 53 248,501 46 174,727 29 197,531 36 143,395 20 357,810 66 461,081 74
State Aid 11,193 9,231 12,837 11,782 4,390 16,971 9,600 81,509 11,782 27,994 7,418 50,591 12,901 12,835 6,546 13,091 16,904 37,528 5,237 44,726 43,896 38,782 98,731 4,364 8,728 17,348 29,117 98,657 5,673 12,404 8,728 14,338 15,287 6,546 9,600 6,305 12,655 17,818
Rank (%-ile) 50 30 58 53 1 71 31 96 53 83 11 92 58 58 5 59 70 88 1 91 91 89 97 1 19 72 83 97 2 56 19 65 68 5 31 5 57 72
Municipal Contributions 18,505 10,800 4,130 17,358 6,250 16,007 46,200 7,500 8,400 2,500 60,739 1,609 7,329 71,816 5,000 10,000 92,525 32,686 55,207 77,374 5,000 38,700 61,275 16,850 16,681 11,055 4,563 3,177 49,879
Rank (%-ile) 79 65 42 78 0 52 75 95 56 59 34 96 29 56 0 97 46 61 0 98 91 96 97 46 0 93 0 97 0 76 0 76 66 0 45 0 36 96
Pension Amount 1,600 1,800 1,200 1,300 50 1,050 1,000 5,600 1,300 1,525 475 3,050 1,000 1,250 600 3,000 1,300 2,400 100 3,200 3,000 3,400 7,500 250 550 1,575 2,300 4,900 575 1,250 450 1,100 1,100 525 1,200 650 1,000 2,600
Table 2-A Financial and Investment Data for Lump-Sum Plans For the Year Ended December 31, 2011 Rank (%-ile) 71 77 57 62 0 52 46 98 62 71 11 92 46 61 21 91 62 86 0 93 91 93 99 2 19 71 85 96 21 61 8 53 53 18 57 27 46 88
ROR 2011 (4.0) (3.4) 2.0 (1.5) 0.2 2.2 (4.4) 2.8 (0.9) 3.3 0.0 (4.5) 1.0 3.0 0.5 (3.5) (1.7) (3.7) (2.2) (3.6) (3.0) 0.7 1.1 8.0 0.4 2.5 (3.0) (4.4) 2.4 0.8 2.6 (1.9) (0.4) 2.4 2.0 (0.2) (0.4) (0.1)
Rank (%-ile) 10 14 82 33 57 84 7 90 41 93 55 7 67 91 61 14 31 12 26 12 17 62 68 99 59 87 17 7 86 65 88 29 48 86 82 51 48 53
Funding Ratio 97 102 96 89 441 133 70 101 98 78 128 69 114 88 137 79 96 89 * 46 94 98 94 217 104 76 105 96 116 68 162 75 86 126 128 122 101 81
Rank (%-ile) 37 48 34 19 99 86 1 46 39 4 83 0 69 16 88 5 34 19 * 0 28 39 28 98 52 3 54 34 72 0 93 3 14 81 83 79 46 8
46
Relief Association Osseo Ostrander Owatonna Palisade Palo Park Rapids Parkers Prairie Paynesville Pelican Rapids Pemberton Pennock Pequaywan Pequot Lakes Perham Pierz Pillager Pine Island Pine River Plato Porter Preston Princeton Prinsburg Prior Lake Proctor Randall Randolph Raymond Red Wing Redwood Falls Remer Renville Rice Rice Lake Richmond Rockford Rockville Rogers
Active Members 29 9 30 24 16 27 26 26 24 18 20 12 29 28 26 25 29 22 29 24 23 33 18 41 24 24 33 26 26 28 21 24 24 27 21 29 24 34
Net Rank Assets (%-ile) 411,575 70 72,622 2 1,840,201 96 128,592 15 * * 949,853 91 232,579 44 562,316 81 377,197 68 120,667 12 * * * * 1,030,654 91 577,983 82 365,755 67 488,947 76 384,505 68 647,849 85 465,830 74 299,208 56 246,227 46 1,076,982 92 209,766 38 2,548,946 97 316,287 59 348,929 65 492,408 76 225,360 42 892,070 90 651,002 85 523,061 79 309,535 57 346,268 65 491,856 76 389,921 69 452,855 73 396,192 69 739,332 87
State Aid 10,473 6,109 102,837 8,414 10,910 56,804 10,910 24,838 39,294 7,418 8,789 6,109 34,540 26,815 29,829 23,510 31,519 16,930 11,346 10,473 11,536 41,436 8,728 140,411 15,080 10,910 15,976 9,600 69,531 25,994 13,355 10,910 14,549 13,381 17,249 21,857 11,000 58,829
Rank (%-ile) 38 3 97 19 43 93 43 81 89 11 26 3 87 82 84 79 85 71 51 38 53 90 19 99 67 43 69 31 95 81 62 43 66 63 71 77 50 93
Municipal Contributions 6,267 1,086 45,655 6,812 6,500 2,600 19,359 8,372 1,000 4,413 4,290 44,124 31,538 14,940 25,000 29,352 25,738 6,500 5,000 17,282 17,000 100,175 5,000 19,000 29,605 5,302 47,460 10,389 30,215 5,000 10,700 10,107 20,850 24,762 34,509
Rank (%-ile) 52 27 95 54 52 34 80 58 0 26 44 44 94 90 72 86 89 86 52 46 77 76 0 98 46 80 89 49 0 95 64 89 46 65 63 81 85 92
Pension Amount 1,600 435 4,450 600 950 3,000 1,100 2,000 1,800 550 900 500 2,900 1,900 1,400 2,200 2,500 1,950 1,084 325 1,300 2,875 500 6,500 1,100 1,200 1,000 800 2,500 2,775 1,500 1,300 900 1,400 1,250 1,750 1,500 2,600
Table 2-A Financial and Investment Data for Lump-Sum Plans For the Year Ended December 31, 2011 Rank (%-ile) 71 8 95 21 45 91 53 80 77 19 43 12 90 79 65 84 87 80 52 3 62 90 12 98 53 57 46 36 87 89 68 62 43 65 61 76 68 88
ROR 2011 (2.7) 0.7 0.1 (2.7) (0.8) (1.5) (1.4) (6.7) (4.3) 2.1 2.8 (5.7) 1.6 (3.4) (4.3) (1.4) 1.4 1.0 (5.3) 1.6 (0.7) (3.8) 2.6 (0.4) (1.2) (0.6) (0.1) (0.1) 2.3 (1.0) 3.8 2.2 (4.6) 5.0 (2.1) 0.9 (4.9) (3.0)
Rank (%-ile) 21 62 56 21 43 33 35 0 8 83 90 2 76 14 8 35 73 67 3 76 44 11 88 48 38 46 53 53 85 40 96 84 6 98 27 66 5 17
Funding Ratio 107 144 94 96 * 100 73 87 101 135 * * 118 83 90 86 85 100 103 184 81 103 143 95 151 160 99 96 144 86 113 81 107 133 116 92 75 83
Rank (%-ile) 59 90 28 34 * 44 2 15 46 87 * * 75 10 21 14 12 44 50 96 8 50 90 31 92 93 42 34 90 14 68 8 59 86 72 23 3 10
47
Relief Association Rollingstone Rose Creek Roseau Rosemount Rothsay Royalton Rush City Ruthton Sabin-Elmwood Sacred Heart Saint Anthony Saint Augusta Saint Bonifacius Saint Charles Saint Clair Saint Francis Saint James Saint Joseph Saint Leo Saint Martin Saint Michael Saint Paul Park Saint Peter Saint Stephen Sanborn Sandstone Sartell Sauk Centre Sauk Rapids Scandia Valley Schroeder Sebeka Sedan Shafer Shakopee Shelly Sherburn Shevlin
Active Members 22 21 27 47 22 21 28 17 23 25 29 30 26 28 26 28 33 28 19 22 30 25 29 25 19 16 29 27 30 19 14 20 16 24 42 14 23 14
Net Rank Assets (%-ile) 87,269 5 98,598 6 578,287 82 2,783,038 98 307,550 57 152,245 23 459,288 74 213,233 39 228,461 43 147,895 21 889,001 90 42,237 0 453,465 73 574,646 81 638,993 84 618,972 84 625,546 84 493,020 76 158,375 26 427,667 71 760,819 87 560,763 80 753,629 87 367,332 67 122,445 12 203,253 37 775,921 88 528,126 79 1,127,579 93 * * 112,999 9 397,834 69 60,556 1 211,750 39 3,974,012 99 142,669 20 512,501 78 182,304 31
State Aid 9,600 9,164 23,949 85,718 10,738 9,600 23,228 7,855 9,164 10,910 31,574 12,937 27,719 20,053 15,212 23,308 22,261 34,452 10,473 10,473 59,000 18,414 41,596 15,048 8,291 16,626 60,267 29,827 67,748 11,393 4,800 13,753 6,109 9,600 155,577 7,026 10,910 8,728
Rank (%-ile) 31 27 80 96 43 31 79 13 27 43 86 58 83 75 67 79 78 87 38 38 93 74 90 67 15 70 94 84 95 52 1 63 3 31 99 11 43 19
Municipal Contributions 3,867 10,000 166,000 12,459 37,429 425 16,289 6,000 33,000 7,000 10,000 22,079 9,806 24,100 28,000 20,996 28,512 21,648 2,000 17,453 7,800 17,071 12,000 16,549 1,867 2,000 3,709 351,976 4,108 7,097 10,000
Rank (%-ile) 0 40 61 99 0 69 93 24 0 76 51 0 91 54 61 0 83 61 0 84 87 82 88 83 31 78 57 77 67 76 30 31 0 39 100 42 55 61
Pension Amount 395 400 1,600 6,900 800 975 1,700 750 800 760 2,800 500 2,519 1,650 1,200 2,100 1,775 1,800 500 1,200 2,100 2,200 2,400 1,200 550 1,750 2,530 1,550 3,500 1,250 800 1,500 150 825 7,500 300 1,250 600
Table 2-A Financial and Investment Data for Lump-Sum Plans For the Year Ended December 31, 2011 Rank (%-ile) 4 4 71 99 36 45 74 33 36 35 90 12 88 74 57 83 77 77 12 57 83 84 86 57 19 76 88 71 94 61 36 68 1 40 99 2 61 21
ROR 2011 2.4 0.8 (0.6) 0.7 (2.8) (3.0) 0.3 1.4 2.7 1.2 (5.1) (1.2) (1.5) (4.6) 1.4 (2.5) (0.4) (3.8) 1.8 (7.4) (3.2) (0.9) (1.7) (2.2) 1.7 0.4 0.6 4.2 (2.7) 2.8 0.1 2.8 0.2 1.2 0.7 (0.2) 2.1 (2.5)
Rank (%-ile) 86 65 46 62 20 17 58 73 88 71 5 38 33 6 73 23 48 11 78 0 15 41 31 26 77 59 61 97 21 90 56 90 57 71 62 51 83 23
Funding Ratio 96 78 144 93 104 73 77 116 130 79 98 105 108 101 155 117 96 81 121 102 96 98 83 85 106 92 96 88 95 * 142 94 266 105 89 196 103 130
Rank (%-ile) 34 4 90 26 52 2 4 72 84 5 39 54 61 46 92 74 34 8 78 48 34 39 10 12 57 23 34 16 31 * 89 28 98 54 19 96 50 84
48
Relief Association Silica Silver Bay Silver Lake Slayton Sleepy Eye Solway Solway Rural South Haven Spicer Spring Grove Spring Valley Springfield Squaw Lake Stacy-Lent Area Staples Starbuck Stephen Stewart Stewartville Stillwater Storden Sturgeon Lake Sunburg Taconite Taunton Taylors Falls Thief River Falls Thomson Tofte Tower Tracy Trimont Truman Twin Lakes (City) Twin Lakes (VFD) Two Harbors Tyler Upsala
Active Members 13 23 26 28 32 20 17 25 24 28 23 24 20 33 25 24 28 19 36 32 23 16 23 15 14 20 26 21 12 15 24 24 24 15 10 23 24 20
Net Rank Assets (%-ile) 123,191 13 457,400 74 234,412 44 350,050 65 815,478 88 189,176 34 67,271 2 254,050 48 259,594 49 145,219 21 496,975 77 243,576 46 186,966 33 520,245 78 314,345 58 171,614 29 194,158 35 244,935 46 1,061,011 92 2,971,899 98 175,549 30 89,639 6 * * 95,496 6 74,774 3 330,168 61 846,127 89 473,951 74 125,186 13 * * 303,052 57 377,071 68 226,624 42 214,232 40 39,743 0 601,974 83 196,744 36 150,625 22
State Aid 6,982 12,608 11,782 13,384 24,107 13,091 8,291 12,534 16,155 10,910 13,993 13,975 9,600 17,545 16,551 13,654 12,655 10,473 34,436 106,348 9,600 6,109 8,291 6,109 6,109 10,910 39,922 17,430 5,084 8,291 14,724 9,600 10,910 7,462 6,109 34,202 8,902 7,418
Rank (%-ile) 8 57 53 63 80 59 15 56 69 43 64 64 31 72 69 63 57 38 87 98 31 3 15 3 3 43 90 72 1 15 66 31 43 13 3 87 26 11
Municipal Contributions 5,000 19,534 25,057 9,662 1,646 11,344 20,512 10,769 11,791 30,586 9,999 10,295 7,184 1,000 10,000 15,000 3,883 2,792 4,846 22,900 14,564 9,132 3,308 12,511 2,300 4,652 7,305 2,000 1,500
Rank (%-ile) 46 0 80 86 60 0 29 67 81 65 67 89 0 61 64 55 26 61 73 0 40 0 35 45 0 83 0 72 59 37 69 32 45 0 56 0 31 28
Pension Amount 675 1,100 850 1,500 1,900 1,150 500 1,000 1,300 700 1,410 1,250 400 1,100 1,400 850 500 1,000 2,200 5,000 600 525 450 850 300 1,400 3,000 1,600 1,015 600 1,300 1,050 800 450 450 2,400 500 450
Table 2-A Financial and Investment Data for Lump-Sum Plans For the Year Ended December 31, 2011 Rank (%-ile) 29 53 41 68 79 56 12 46 62 30 68 61 4 53 65 41 12 46 84 97 21 18 8 41 2 65 91 71 51 21 62 52 36 8 8 86 12 8
ROR 2011 2.3 (1.2) 1.9 0.7 11.6 5.6 (5.3) (3.0) (5.8) (0.7) (1.7) (2.5) 1.9 (4.8) (2.5) (0.3) 1.9 1.6 (2.0) (2.6) (2.7) 1.6 0.0 2.9 2.8 (5.4) 2.0 3.6 1.9 0.7 (0.6) 2.7 1.9 6.7 (2.7) (0.3) 2.7 0.7
Rank (%-ile) 85 38 80 62 100 98 3 17 1 44 31 23 80 6 23 49 80 76 28 22 21 76 55 91 90 3 82 95 80 62 46 88 80 99 21 49 88 62
Funding Ratio 105 118 83 76 96 131 94 88 79 86 100 67 210 100 86 87 156 132 120 109 97 124 * 77 114 85 103 91 89 * 92 108 95 174 71 107 107 135
Rank (%-ile) 54 75 10 3 34 85 28 16 5 14 44 0 97 44 14 15 92 85 77 64 37 80 * 4 69 12 50 22 19 * 23 61 31 95 1 59 59 87
49
Relief Association Vadnais Heights Vergas Verndale Vernon Center Vesta Victoria Vining Wabasha Waconia Wadena Waite Park Waldorf Walker Walnut Grove Walters Warren Warroad Waseca Watertown Waterville Watkins Watson Waubun Waverly Welcome Wendell West Concord Westbrook Wheaton Willmar Willow River Wilmont Wilson Windom Winnebago Winsted Wolf Lake Wood Lake
Active Members 35 20 21 20 19 28 17 24 34 20 29 25 24 20 18 25 27 31 28 21 24 15 16 21 23 23 25 24 23 36 19 18 25 31 21 26 20 17
Net Rank Assets (%-ile) 1,014,217 91 155,503 23 358,020 66 126,767 14 114,333 9 780,853 88 61,535 1 333,241 61 802,285 88 591,661 82 701,469 86 178,089 30 618,775 83 131,745 16 101,172 7 200,996 37 336,744 62 1,094,907 92 636,478 84 341,955 64 317,917 59 152,577 23 159,916 26 241,106 45 258,753 49 171,089 28 314,268 58 141,945 19 474,468 75 * * 130,436 16 192,451 34 387,076 68 755,075 87 282,720 53 361,811 66 217,750 40 123,904 13
State Aid 51,454 13,605 10,473 8,728 7,418 37,498 6,546 16,611 53,120 18,347 26,437 10,037 30,990 8,728 7,418 12,454 18,593 43,215 27,788 11,381 10,910 8,728 8,728 11,240 10,910 8,728 10,754 8,291 13,563 66,394 6,982 10,473 13,091 25,849 11,163 13,091 9,164 8,728
Rank (%-ile) 92 63 38 19 11 88 5 70 93 74 82 35 85 19 11 56 74 91 83 52 43 19 19 51 43 19 43 15 63 95 8 38 59 81 50 59 27 19
Municipal Contributions 66,128 1,335 1,200 1,963 180 44,089 19,585 15,459 900 5,000 4,193 18,498 1,000 472 50,370 21,996 5,616 7,664 4,211 13,200 6,000 8,118 1,250 12,464 24,463 2,680 9,502 5,000 4,000 18,398 1,896 552
Rank (%-ile) 97 28 28 31 23 94 0 80 74 26 46 43 79 26 25 0 0 96 83 51 57 43 0 70 51 58 0 28 69 85 35 0 60 46 41 78 30 25
Pension Amount 3,600 820 1,400 500 500 2,000 400 1,400 2,500 1,970 2,050 500 2,500 550 400 625 800 3,100 2,100 1,300 930 1,025 600 1,400 875 600 1,000 650 1,800 2,400 600 450 600 2,300 800 1,500 800 500
Table 2-A Financial and Investment Data for Lump-Sum Plans For the Year Ended December 31, 2011 Rank (%-ile) 94 40 65 12 12 80 4 65 87 80 82 12 87 19 4 27 36 92 83 62 44 51 21 65 42 21 46 27 77 86 21 8 21 85 36 68 36 12
ROR 2011 (1.2) (0.4) (1.5) (0.1) 1.8 0.9 (3.2) 1.1 (1.5) (1.6) (0.5) (2.7) (1.3) 1.9 (0.5) (5.2) 3.3 2.2 (4.0) 4.7 (2.5) (3.6) 2.7 (0.3) 2.7 3.3 1.4 2.2 (4.5) (6.1) 1.8 0.3 0.0 (1.6) (0.3) (3.9) 2.3 (3.1)
Rank (%-ile) 38 48 33 53 78 66 15 68 33 32 47 21 36 80 47 4 93 84 10 97 23 12 88 49 88 93 73 84 7 1 78 58 55 32 49 11 85 16
Funding Ratio 87 92 114 98 109 94 98 72 94 105 88 142 115 107 94 114 126 87 82 95 105 89 136 104 108 104 140 143 121 * 104 133 170 106 138 79 94 125
Rank (%-ile) 15 23 69 39 64 28 39 2 28 54 16 89 71 59 28 69 81 15 9 31 54 19 88 52 61 52 89 90 78 * 52 86 94 57 89 5 28 81
50
Active Members 70 12 26 12 15 26 25 17
Net Assets 6,365,953 123,335 150,183 127,179 295,510 289,034 489,246 238,962
Rank (%-ile) 100 13 22 14 55 55 76 45
State Aid 244,674 6,546 8,291 7,855 8,728 28,279 47,498 10,422
Rank (%-ile) 100 5 15 13 19 83 91 38
Municipal Contributions 143,189 12,000 2,700 4,600 55,586 21,396
Rank (%-ile) 99 0 0 67 35 45 96 82
Pension Amount 6,720 625 500 825 1,200 1,150 3,600 1,200
Rank (%-ile) 99 27 12 40 57 56 94 57
ROR 2011 (1.2) 1.7 1.5 2.5 (2.5) 4.9 (0.2) 1.2
Rank (%-ile) 38 77 75 87 23 98 51 71
Funding Ratio 98 126 105 126 89 115 80 88
Rank (%-ile) 39 81 54 81 19 71 6 16
* These relief associations joined the Voluntary Statewide Lump-Sum Volunteer Firefighter Retrirement Plan on January 1, 2012. The assets of these relief associations were transferred to the State Board of Investment at the end of 2011, so there were no net assets or funding ratios for these associations.
Relief Association Woodbury Woodstock Wrenshall Wright Wykoff Wyoming Zimmerman Zumbro Falls
Table 2-A Financial and Investment Data for Lump-Sum Plans For the Year Ended December 31, 2011
51
Relief Association Alaska Andover Anoka-Champlin Ashby Austin Brewster Brooklyn Park Callaway Cloquet Area Fire District Cologne Columbia Heights Coon Rapids Crosslake Dakota Dalbo Dilworth Donnelly Eagan Edina Elbow Lake Elgin Ellsburg Embarrass Erskine Falcon Heights Fisher Fosston Fountain Freeport Fridley Gary
Active Members 17 50 44 23 18 21 74 15 30 30 21 51 27 12 18 28 22 102 42 25 25 7 16 20 20 16 24 19 21 35 21
Net Rank Assets (%-ile) $ 123,211 19 % 3,030,312 90 3,159,624 91 276,187 54 782,960 82 261,081 51 6,791,458 96 126,796 20 114,995 18 367,037 69 1,371,840 86 6,129,012 95 898,580 83 104,072 13 333,225 65 610,578 77 160,162 32 8,394,024 98 6,943,991 97 264,393 52 293,304 60 * * * * 151,143 29 1,196,405 84 154,656 31 379,660 70 107,273 15 277,925 55 3,286,663 93 97,239 12
State Rank Aid (%-ile) $ 6,546 7% 106,170 92 140,348 93 10,473 50 49,500 86 10,327 48 258,052 97 7,855 20 46,959 85 13,011 65 63,554 88 208,097 95 29,224 82 6,982 11 10,037 44 22,361 78 11,782 60 255,982 96 260,705 98 11,782 60 13,075 66 4,364 1 8,291 25 8,291 25 40,264 83 11,346 59 13,627 67 8,728 34 10,349 49 99,320 89 6,982 11
Municipal Rank Pension Contributions (%-ile) Amount $ 0% Bal 50,000 95 Bal 10,920 80 Bal 5,585 69 Bal 0 Bal 0 Bal 26,181 93 Bal 0 Bal 0 Bal 9,200 78 Bal 0 Bal 0 Bal 16,521 86 Bal 1,050 51 Bal 484 48 Bal 8,251 76 Bal 0 Bal 405,546 100 Bal 0 Bal 9,000 77 Bal 0 Bal 4,780 67 Bal 0 Bal 2,750 60 Bal 0 Bal 0 Bal 1,000 50 Bal 0 Bal 5,223 68 Bal 0 Bal 0 Bal
Table 2-B Financial and Investment Data for Defined-Contribution Plans For the Year Ended December 31, 2011 ROR Rank Funding 2011 (%-ile) Ratio 1.8 % 79 % 100 % (1.7) 29 100 (3.0) 13 100 0.6 59 100 1.2 71 100 (0.3) 48 100 1.2 71 100 2.4 88 100 3.3 95 100 (3.7) 11 100 1.8 79 100 3.3 95 100 (2.1) 28 100 3.9 98 100 (3.0) 13 100 (2.2) 25 100 (4.3) 6 100 (2.9) 15 100 (1.0) 39 100 1.8 79 100 0.5 58 100 0.9 67 * (1.2) 34 * (2.7) 16 100 (4.2) 7 100 (1.2) 34 100 0.8 65 100 (0.2) 50 100 3.2 94 100 0.6 59 100 0.8 65 100
52
Relief Association Gibbon Glenville Goodhue Gunflint Trail Hardwick Hawley Ivanhoe Kelsey Kenyon Kerkhoven Kiester Lake George Lakeport Le Center London Longville Lyle Magnolia Maple Grove Marietta Marine-On-Saint Croix Mazeppa Medicine Lake Mendota Heights Mentor Millerville Milroy Murdock Myrtle Nassau Nodine
Active Members 25 25 23 22 19 21 32 12 30 23 21 10 17 24 22 20 18 9 90 16 32 21 20 37 16 29 27 21 21 16 13
Net Rank Assets (%-ile) 296,841 61 161,917 33 664,261 79 259,927 50 * * 397,947 72 285,641 56 37,554 1 351,146 66 207,281 46 144,980 25 140,594 23 226,001 48 355,654 68 73,940 4 748,707 81 108,191 17 63,077 3 9,208,235 100 80,213 6 437,866 74 203,662 45 688,214 80 2,141,988 89 85,617 8 351,576 67 141,625 24 176,681 37 194,311 41 150,660 27 177,237 38
State Rank Aid (%-ile) 10,910 56 11,782 60 24,210 79 10,473 50 7,855 20 15,045 71 11,782 60 6,982 11 17,694 75 9,600 41 9,164 39 7,418 16 11,233 58 15,320 73 6,109 5 26,320 80 7,855 20 5,237 3 264,226 100 8,291 25 10,473 50 10,473 50 8,291 25 63,267 87 4,800 2 7,418 16 6,546 7 6,982 11 10,910 56 8,728 34 7,418 16
Municipal Rank Contributions (%-ile) 2,500 59 0 0 10,000 79 0 7,700 74 4,000 64 0 4,000 64 1,370 55 0 8,000 75 11,408 82 6,408 71 0 25,000 92 0 0 207,442 97 0 13,000 83 2,202 57 21,000 91 60,106 96 0 14,000 85 0 2,865 61 0 0 1,400 56
Pension Amount Bal Bal Bal Bal Bal Bal Bal Bal Bal Bal Bal Bal Bal Bal Bal Bal Bal Bal Bal Bal Bal Bal Bal Bal Bal Bal Bal Bal Bal Bal Bal
Table 2-B Financial and Investment Data for Defined-Contribution Plans For the Year Ended December 31, 2011 ROR 2011 0.0 (0.9) (2.7) 0.7 1.1 (2.4) (0.8) (2.2) (15.2) 3.4 (0.8) (4.2) (1.3) 0.6 (5.3) 0.6 (0.1) 2.5 0.1 1.7 (1.7) (0.7) (1.3) (2.4) (4.9) (0.6) (0.1) 1.9 2.7 (1.3) (2.6)
Rank (%-ile) 53 41 16 64 70 22 42 25 0 97 42 7 31 59 3 59 51 89 57 78 29 44 31 22 5 46 51 85 92 31 20
Funding Ratio 100 100 100 100 * 100 100 100 100 100 100 100 100 100 100 100 100 100 100 100 100 100 100 100 100 100 100 100 100 100 100
53
Active Members 14 17 20 21 23 52 22 20 29 17 18 10 19 19 21 22 20 15 17 22 29 14 27 24 59 22 25 30
Net Rank Assets (%-ile) 107,427 16 56,874 2 86,159 9 561,455 76 129,303 22 1,834,031 87 178,694 39 209,524 47 306,968 62 92,438 10 145,388 26 76,890 5 290,445 58 202,304 44 152,172 30 165,690 34 270,589 53 195,698 43 0 0 182,488 40 327,304 63 96,641 11 1,932,553 88 407,089 73 5,614,272 94 169,735 36 291,359 59 538,404 75
State Rank Aid (%-ile) 6,546 7 5,673 4 7,855 20 20,939 77 10,473 50 99,928 91 8,376 33 8,291 25 18,638 76 9,164 39 8,291 25 6,109 5 8,291 25 7,919 24 10,037 44 9,600 41 15,004 70 6,982 11 0 0 9,600 41 13,709 68 8,728 34 44,294 84 13,984 69 141,983 94 8,728 34 10,131 47 17,449 74
Municipal Rank Contributions (%-ile) 1,200 52 0 0 6,600 73 0 16,708 87 3,000 62 0 2,250 58 0 0 0 18,089 89 4,500 66 0 300 47 500 49 1,300 53 0 0 0 0 45,000 94 6,250 70 287,270 98 0 13,794 84 17,083 88
Pension Amount Bal Bal Bal Bal Bal Bal Bal Bal Bal Bal Bal Bal Bal Bal Bal Bal Bal Bal Bal Bal Bal Bal Bal Bal Bal Bal Bal Bal
ROR 2011 1.6 0.0 0.9 (1.0) (2.7) (1.2) 1.9 (4.0) 2.6 (1.1) 1.3 1.8 (10.0) (2.5) 10.1 1.8 0.9 3.0 0.0 (0.3) (5.6) 1.5 1.3 (3.3) (5.2) 2.2 (0.5) (2.4)
Rank (%-ile) 77 53 67 39 16 34 85 10 91 38 74 79 1 21 100 79 67 93 53 48 2 76 74 12 4 87 47 22
Funding Ratio 100 100 100 100 100 100 100 100 100 100 100 100 100 100 100 100 100 100 100 100 100 100 100 100 100 100 100 100
* These relief associations joined the Voluntary Statewide Lump-Sum Volunteer Firefighter Retrirement Plan on January 1, 2012. The assets of these relief associations were transferred to the State Board of Investment at the end of 2011, so there were no net assets or funding ratios for these associations.
Relief Association Northrop Odessa Oklee Plainview Plummer Ramsey Red Lake Falls Round Lake Rushford Rushmore Saint Hilaire Seaforth South Bend Swanville Toivola Ulen Underwood Vermilion Lake Viking Wabasso Wanamingo Wanda Wayzata Wells West Metro Williams Winthrop Zumbrota
Table 2-B Financial and Investment Data for Defined-Contribution Plans For the Year Ended December 31, 2011
This page is intentionally left blank.
55
Active Members 65 25 25 34 44 32 95 33 36 28 65 68 40 41 22 35 71 27 51 35 51 49 33
Net Rank Assets (%-ile) $4,403,850 71 % 256,237 0 259,234 4 3,166,825 47 2,194,668 42 3,995,079 61 16,841,826 100 1,388,790 28 724,057 14 1,446,624 33 3,727,977 52 11,937,087 95 4,016,605 66 1,816,087 38 949,077 19 510,948 9 6,333,430 80 1,369,303 23 7,441,903 85 3,843,537 57 10,340,923 90 5,223,158 76 1,105,847 20
State Rank Aid (%-ile) $ 179,993 76 % 12,110 0 21,484 9 93,119 47 108,971 61 94,569 52 286,728 95 50,733 28 26,371 14 66,853 38 185,168 80 238,853 85 74,362 42 55,468 33 38,899 19 20,378 4 304,862 100 50,427 23 145,733 66 101,421 57 275,312 90 153,370 71 39,978 19
Municipal Rank Contributions (%-ile) $ 300,257 95 % 0 9,771 14 39,204 28 52,331 33 205,361 80 830,077 100 85,293 47 68,795 38 100,455 57 83,324 42 198,026 76 141,625 61 98,672 52 18,000 19 36,922 23 0 165,361 66 207,651 85 184,514 71 270,750 90 0 37,300 24
* Due to space limitations, certain benefit bylaw provisions cannot be summarized in this Table.
Relief Association Apple Valley Appleton Benson Brooklyn Center Chanhassen Chaska Eden Prairie Fairmont Glencoe Hutchinson Lake Johanna Minnetonka Mound New Ulm Pine City Pipestone Plymouth Robbinsdale Roseville Savage Spring Lake Park White Bear Lake Worthington
Yearly Rank Benefit (%-ile) $ 6,300 80 % 1,300 30 1,100 25 7,500 90 5,050 60 0 5,600 70 3,800 55 2,000 35 0 5,600 70 6,910 85 0 3,750 50 0 2,250 40 7,500 90 7,500 90 3,000 45 5,072 65 0 * * 2,725 43
Table 2-C Financial and Investment Data for Other Plan Types For the Year Ended December 31, 2011 Monthly Rank ROR Rank Funding Rank Benefit (%-ile) 2011 (%-ile) Ratio (%-ile) $ 42 90 % (3.1) % 14 % 70 % 19 % 4 5 (3.1) 14 91 66 4 5 2.1 100 62 4 24 40 (4.5) 0 93 71 21 35 (3.3) 4 77 38 24 45 (0.1) 71 75 33 56 100 (2.3) 33 85 52 25 60 0.5 80 68 14 13 25 (0.9) 47 71 23 15 30 (0.8) 52 61 0 34 85 (2.6) 23 97 80 53 95 (0.6) 61 93 71 29 65 (2.6) 23 90 61 25 55 0.5 80 81 47 38 120 100 8 15 (1.6) 3 0 (0.7) 57 73 28 24 50 (0.5) 66 113 95 13 20 0.1 76 62 4 30 70 1.3 95 85 52 33 75 (1.2) 42 78 42 34 80 0.9 90 107 90 * * (3.2) 9 104 85 17 31 (3.3) 4 80 46
This page is intentionally left blank.
How to Read Tables 3-A Through 3-C
Tables 3-A, 3-B, and 3-C provide relief association funding status and contribution requirement information. Net Assets – The value of the relief association’s Special Fund assets as of the end of 2011. The net assets include any accounts payable or receivable that are outstanding as of December 31, 2011. The net asset value may therefore differ from the market value of the relief association’s investments. Accrued Liabilities – An estimate of how much a relief association has accrued in pension benefits payable as of the end of 2011. The estimate is derived using statutory assumptions. Surplus or (Deficit) – A surplus is the amount of a relief association’s net assets in excess of its accrued liabilities. A deficit is the amount of accrued liabilities a relief association had in excess of its assets as of December 31, 2011. A relief association that has a deficit is “under-funded,” while a relief association that has a surplus is “fully- funded.” Funding Ratio – The relief association’s assets divided by its accrued liabilities at the end of 2011. Over 100 percent means the relief association had more assets than liabilities, while less than 100 percent means the association had more projected liabilities than assets. Deficit Amortization Payment – Relief associations that showed a deficit on their 2011 Schedule Form or Actuarial Valuation are required to include this charge when calculating their required contribution. The amortization payment helps bring the relief association closer to full funding. Normal Cost – The relief association’s cost of existing for one year; in this case, from 2011 to 2012. The normal cost includes the cost of members receiving one additional year of service credit, and becoming closer to receiving a fully-vested pension. Required Contribution – The contribution required from the affiliated municipality or independent nonprofit firefighting corporation. The contribution helps bring the relief association closer to full funding, or helps offset normal costs in excess of projected income.
57
This page is intentionally left blank.
Table 3-A Funding Status and Ratios for Lump-Sum Plans For the Year Ended December 31, 2011 Net Assets
Relief Association
Ada Adams Adrian Aitkin Albany Albert Lea Township Albertville Almelund Alpha Altura Amboy Annandale Argyle Arlington Arrowhead Askov Atwater Audubon Aurora Avon Babbitt Backus Badger Bagley Balaton Baldwin Balsam Barnesville Barnum Barrett Battle Lake Baudette Bayport Beardsley Beaver Bay Beaver Creek Becker Belgrade Belle Plaine Bellingham Belview Bemidji Bertha Bethel Big Lake Bigelow Bigfork Bird Island Biwabik City Blackduck
$
285,919 190,110 330,917 500,955 418,548 135,171 510,857 331,718 107,416 112,373 156,689 642,387 114,031 400,841 86,117 175,562 258,748 282,520 222,020 364,581 316,490 294,823 95,242 299,519 157,050 325,107 186,478 185,232 200,478 110,282 407,588 448,858 1,453,043 159,591 123,557 128,913 872,819 296,105 480,560 166,802 214,634 2,204,195 132,992 85,765 1,052,952 136,164 176,015 180,839 209,791 160,512
Accrued Liabilities
$
309,612 182,170 277,631 574,367 385,772 196,881 520,700 335,400 103,252 97,176 171,136 483,461 115,229 423,488 60,852 166,776 278,980 271,375 315,326 388,440 297,838 226,717 74,970 281,239 146,154 186,886 204,446 188,446 145,202 94,482 338,100 347,477 1,301,239 124,192 50,110 134,100 825,384 309,738 606,166 175,255 211,284 2,213,764 98,428 63,519 1,071,891 62,372 230,223 195,805 213,650 198,724
Surplus or (Deficit)
$
(23,693) 7,940 53,286 (73,412) 32,776 (61,710) (9,843) (3,682) 4,164 15,197 (14,447) 158,926 (1,198) (22,647) 25,265 8,786 (20,232) 11,145 (93,306) (23,859) 18,652 68,106 20,272 18,280 10,896 138,221 (17,968) (3,214) 55,276 15,800 69,488 101,381 151,804 35,399 73,447 (5,187) 47,435 (13,633) (125,606) (8,453) 3,350 (9,569) 34,564 22,246 (18,939) 73,792 (54,208) (14,966) (3,859) (38,212)
59
Funding Ratio
92 % 104 119 87 108 69 98 99 104 116 92 133 99 95 142 105 93 104 70 94 106 130 127 106 107 174 91 98 138 117 121 129 112 129 247 96 106 96 79 95 102 100 135 135 98 218 76 92 98 81
Deficit Amortization
Normal Cost
Payment*
$
4,068 10,586 4,446 10,597 367 2,995 2,980 17,301 211 7,502 3,262 6,109
$
24,147 14,628 24,884 59,160 34,085 23,560 45,483 20,942 8,712 8,248 15,264 46,569 11,457 37,739 9,180 12,928 26,040 27,699 30,065 38,726 31,064 23,676 7,670 28,675 13,200 34,473 26,004 19,503 14,980 8,131 31,350 23,253 109,620 10,750 4,840 8,970 79,692 20,689 67,373 12,196 17,596 173,910 9,840 6,071 89,208 3,884 27,846 24,759 20,832 24,609
Required Contribution^
$
1,970 21,517 2,145 19,567 3,741 5,897 787 1,939 33,584 7,173 9,968 6,452
Table 3-A Funding Status and Ratios for Lump-Sum Plans For the Year Ended December 31, 2011
Relief Association
Net Assets
Blackhoof Blooming Prairie Blue Earth Bluffton Bovey Bowlus Boyd Braham Brainerd Brandon Breckenridge Breitung Brevator Bricelyn Brimson Brook Park Brooten Browerville Browns Valley Brownsdale Brownsville Brownton Buffalo Buffalo Lake Buhl Butterfield Byron Caledonia Calumet Cambridge Campbell Canby Cannon Falls Canosia Canton Carlos Carlton Carsonville Carver Cass Lake Centennial Center City Ceylon Chandler Chatfield Cherry Chisago Chisholm Chokio Clara City
104,383 341,757 818,989 139,161 118,457 122,215 158,331 268,008 2,294,641 ** 377,998 ** 143,768 234,125 82,166 133,166 226,917 274,383 139,058 270,168 94,116 305,319 1,081,631 353,222 64,025 205,631 341,531 373,483 255,416 355,069 201,134 334,728 548,003 324,757 72,118 728,603 197,429 ** 523,490 415,895 2,308,764 325,294 181,541 170,235 336,830 145,706 706,586 576,619 164,973 309,558
Accrued Liabilities
101,080 343,003 704,042 76,020 128,047 122,808 115,878 247,176 2,501,792 ** 461,184 ** 129,492 200,674 39,687 67,048 203,950 164,460 146,760 165,970 10,299 351,804 1,356,002 352,974 97,743 217,542 422,914 382,841 291,240 422,778 206,485 245,311 606,353 281,860 71,528 626,972 115,115 ** 565,881 283,198 2,130,858 298,800 155,613 157,538 353,704 80,676 672,137 652,721 104,850 308,390
Surplus or (Deficit)
3,303 (1,246) 114,947 63,141 (9,590) (593) 42,453 20,832 (207,151) ** (83,186) ** 14,276 33,451 42,479 66,118 22,967 109,923 (7,702) 104,198 83,817 (46,485) (274,371) 248 (33,718) (11,911) (81,383) (9,358) (35,824) (67,709) (5,351) 89,417 (58,350) 42,897 590 101,631 82,314 ** (42,391) 132,697 177,906 26,494 25,928 12,697 (16,874) 65,030 34,449 (76,102) 60,123 1,168
60
Funding Ratio
103 100 116 183 93 100 137 108 92 ** 82 ** 111 117 207 199 111 167 95 163 914 87 80 100 66 95 81 98 88 84 97 136 90 115 101 116 172 ** 93 147 108 109 117 108 95 181 105 88 157 100
Deficit Amortization Payment*
3,863 25,753 6,396 15,336 6,931 31,642 1,104 7,329 2,482 15,436 8,855 4,048 52 3,852 4,604 22,796 -
Normal Cost
11,592 33,177 57,345 4,984 17,141 8,432 7,164 27,379 272,927 22,212 32,976 15,675 10,176 13,300 4,455 5,056 16,019 16,335 11,490 17,063 1,043 28,800 119,764 27,037 14,280 16,081 37,083 31,584 20,387 55,632 9,830 24,383 47,260 17,240 7,968 45,435 24,745 10,780 56,200 44,427 183,292 29,450 9,416 9,932 30,264 8,064 63,969 59,066 10,170 20,080
Required Contribution^
7,692 40,001 7,191 17,208 14,786 34,425 255 11,418 12,606 2,499 27,666 3,199 6,844 29,370 -
Table 3-A Funding Status and Ratios for Lump-Sum Plans For the Year Ended December 31, 2011
Relief Association
Net Assets
Claremont Clarissa Clarkfield Clarks Grove Clear Lake Clearbrook Clearwater Clements Cleveland Clifton Climax Clinton (Big Stone) Cohasset Cokato Cold Spring Coleraine Colvill Colvin Comfrey Cook Cosmos Cottage Grove Cotton Cottonwood Courtland Cromwell Crooked Lake Crookston Crosby Culver Currie Cuyuna Cyrus Dalton Danube Danvers Darfur Dassel Dawson Dayton Deer Creek Deer River Deerwood Delano Delavan Dent Detroit Lakes Dexter Dodge Center Dover
83,150 142,156 272,536 137,358 480,195 157,603 338,325 129,892 428,807 265,489 109,130 88,869 608,596 526,840 900,019 197,379 ** 62,387 209,730 338,756 194,561 1,780,252 160,172 338,506 312,288 344,972 142,110 494,217 356,459 46,075 121,463 165,775 129,330 244,770 157,078 83,733 185,583 805,743 326,070 510,211 155,970 339,292 276,972 685,462 171,160 236,713 1,740,637 151,649 527,892 217,876
Accrued Liabilities
84,392 179,000 264,592 119,749 386,452 134,511 360,203 143,882 397,446 209,738 40,725 115,932 602,215 636,864 903,787 204,269 ** 60,828 206,551 355,800 121,551 1,561,622 84,040 208,128 353,544 374,088 112,108 531,698 499,017 57,008 134,184 230,076 81,028 208,566 129,562 81,855 154,277 754,543 396,143 581,747 134,785 368,546 244,317 899,993 149,130 251,842 1,573,970 126,728 413,049 201,823
Surplus or (Deficit)
(1,242) (36,844) 7,944 17,609 93,743 23,092 (21,878) (13,990) 31,361 55,751 68,405 (27,063) 6,381 (110,024) (3,768) (6,890) ** 1,559 3,179 (17,044) 73,010 218,630 76,132 130,378 (41,256) (29,116) 30,002 (37,481) (142,558) (10,933) (12,721) (64,301) 48,302 36,204 27,516 1,878 31,306 51,200 (70,073) (71,536) 21,185 (29,254) 32,655 (214,531) 22,030 (15,129) 166,667 24,921 114,843 16,053
61
Funding Ratio
99 79 103 115 124 117 94 90 108 127 268 77 101 83 100 97 ** 103 102 95 160 114 191 163 88 92 127 93 71 81 91 72 160 117 121 102 120 107 82 88 116 92 113 76 115 94 111 120 128 108
Deficit Amortization Payment*
3,516 3,980 26,027 4,475 4,392 7,658 112 17,522 1,993 6,765 10,265 11,171 9,259 8,739 26,295 -
Normal Cost
9,627 13,118 22,858 8,316 30,408 15,333 38,621 12,473 30,528 17,468 4,542 12,852 48,633 39,600 62,893 18,075 6,310 7,852 13,890 24,000 11,203 148,176 6,576 15,036 23,400 33,410 7,909 41,752 50,758 6,112 8,928 18,853 7,120 15,977 10,670 7,080 6,964 49,615 44,943 42,683 9,885 38,920 19,448 68,224 13,185 14,980 138,744 6,688 32,232 15,062
Required Contribution^
711 6,060 3,091 19,602 4,278 5,090 5,611 5,780 32,355 3,609 14,219 29,246 12,422 10,701 27,469 -
Table 3-A Funding Status and Ratios for Lump-Sum Plans For the Year Ended December 31, 2011
Relief Association
Net Assets
Dovray Dumont Dunnell Eagle Bend Eagle Lake East Bethel East Grand Forks Eastern Hubbard Easton Echo Eden Valley Edgerton Eitzen Elizabeth Elk River Elko New Market Ellendale Ellsworth Elmer Elmore Elrosa Ely Elysian Emily Evansville Eveleth Excelsior Eyota Fairfax Farmington Fayal Federal Dam Fergus Falls Fertile Fifty Lakes Finland Finlayson Flensburg Floodwood Foley Forada Forest Lake Foreston Franklin Frazee Fredenberg French Township Frost Fulda Garfield
40,065 117,931 120,513 257,155 296,586 1,118,122 772,892 253,665 142,932 191,019 431,211 256,696 151,953 154,207 2,260,830 1,314,545 142,384 252,059 88,759 214,242 315,916 554,521 312,043 181,908 157,703 389,597 3,571,611 293,249 266,816 1,562,690 339,232 86,682 2,092,319 257,307 87,037 224,257 172,576 121,658 236,654 747,685 251,913 1,642,939 229,674 288,689 211,705 210,383 143,964 175,414 286,680 319,376
Accrued Liabilities
40,468 91,668 89,172 271,480 331,675 1,038,324 725,409 176,729 156,196 157,344 416,383 228,351 139,518 186,440 2,540,365 1,132,788 154,395 233,262 48,386 224,510 328,092 600,224 330,408 230,940 127,219 440,878 3,693,917 263,568 304,856 2,211,705 314,730 15,019 2,028,658 259,140 70,587 220,701 150,948 129,481 186,164 667,047 174,448 1,687,760 239,939 232,377 270,957 193,832 155,160 168,482 234,292 291,105
Surplus or (Deficit)
(403) 26,263 31,341 (14,325) (35,089) 79,798 47,483 76,936 (13,264) 33,675 14,828 28,345 12,435 (32,233) (279,535) 181,757 (12,011) 18,797 40,373 (10,268) (12,176) (45,703) (18,365) (49,032) 30,484 (51,281) (122,306) 29,681 (38,040) (649,015) 24,502 71,663 63,661 (1,833) 16,450 3,556 21,628 (7,823) 50,490 80,638 77,465 (44,821) (10,265) 56,312 (59,252) 16,551 (11,196) 6,932 52,388 28,271
62
Funding Ratio
99 129 135 95 89 108 107 144 92 121 104 112 109 83 89 116 92 108 183 95 96 92 94 79 124 88 97 111 88 71 108 577 103 99 123 102 114 94 127 112 144 97 96 124 78 109 93 104 122 110
Deficit Amortization Payment*
4,501 8,658 896 6,574 49,072 1,399 3,333 1,643 11,950 6,259 11,474 6,281 121,479 1,299 4,298 7,690 1,497 -
Normal Cost
3,166 6,306 5,967 19,638 33,585 103,972 58,445 21,861 10,539 10,704 26,842 20,813 11,493 12,132 193,934 97,160 9,860 12,500 2,925 17,754 16,198 44,512 23,310 15,300 11,886 35,872 300,395 24,864 30,653 201,611 28,920 702 134,862 20,096 9,909 12,857 10,812 10,522 18,660 43,638 16,912 143,460 16,393 20,267 28,680 14,544 13,310 10,285 21,047 24,297
Required Contribution^
16,054 4,355 29,818 2,246 2,622 10,345 7,136 18,046 14,907 14,691 170,008 1,385 1,496 9,542 -
Table 3-A Funding Status and Ratios for Lump-Sum Plans For the Year Ended December 31, 2011
Relief Association
Net Assets
Garrison Garvin Gaylord Geneva Ghent Gilbert Glenwood Glyndon Gnesen Golden Valley Gonvick Good Thunder Goodland Goodview Graceville Granada Grand Lake Grand Meadow Grand Rapids Granite Falls Green Isle Greenbush Greenwood Grey Eagle Grove City Grygla Hackensack Hallock Halstad Ham Lake Hamburg Hamel Hancock Hanley Falls Hanska Harmony Harris Hartland Hastings Hayfield Hayward Hector Henderson Hendricks Hendrum Henning Herman Hermantown Heron Lake Hewitt
633,195 108,303 430,112 126,995 128,985 185,129 370,942 355,091 228,230 4,012,194 200,985 272,956 95,860 312,672 189,703 56,600 301,579 339,052 1,763,048 365,782 185,484 212,569 391,782 241,604 181,413 129,214 595,214 161,731 212,686 1,228,896 518,333 1,174,503 204,907 115,211 183,975 267,029 148,359 141,347 3,215,829 295,272 287,709 443,372 196,504 180,623 141,993 285,679 121,915 909,736 156,621 112,823
Accrued Liabilities
644,766 102,319 483,440 83,085 116,354 205,810 438,576 337,002 269,259 3,767,599 175,630 262,795 59,412 357,133 144,793 53,294 280,890 359,557 1,598,839 437,315 162,103 246,146 343,900 230,347 198,004 71,040 650,376 165,044 185,055 1,315,712 578,678 936,196 185,057 96,682 148,751 269,867 149,374 61,124 3,048,471 356,930 192,256 375,250 254,852 217,328 118,021 334,619 121,848 768,784 146,088 89,520
Surplus or (Deficit)
(11,571) 5,984 (53,328) 43,910 12,631 (20,681) (67,634) 18,089 (41,029) 244,595 25,355 10,161 36,448 (44,461) 44,910 3,306 20,689 (20,505) 164,209 (71,533) 23,381 (33,577) 47,882 11,257 (16,591) 58,174 (55,162) (3,313) 27,631 (86,816) (60,345) 238,307 19,850 18,529 35,224 (2,838) (1,015) 80,223 167,358 (61,658) 95,453 68,122 (58,348) (36,705) 23,972 (48,940) 67 140,952 10,533 23,303
63
Funding Ratio
98 106 89 153 111 90 85 105 85 106 114 104 161 88 131 106 107 94 110 84 114 86 114 105 92 182 92 98 115 93 90 125 111 119 124 99 99 231 105 83 150 118 77 83 120 85 100 118 107 126
Deficit Amortization Payment*
12,974 3,226 19,010 2,352 1,813 5,981 11,378 5,638 1,572 10,583 4,697 12,323 10,402 8,181 8,033 5,986 75 -
Normal Cost
62,620 6,392 33,858 5,812 10,091 21,318 47,588 19,098 23,230 326,326 16,932 21,275 6,952 35,196 13,134 6,362 31,246 28,952 160,417 43,864 14,957 17,084 21,840 14,145 18,821 4,875 51,156 14,361 13,260 109,376 46,774 62,110 14,460 8,776 11,065 20,517 16,874 7,081 229,554 32,807 17,664 29,952 20,800 19,222 9,586 28,587 14,157 65,714 10,680 7,030
Required Contribution^
11,451 10,026 28,874 849 8,934 10,027 7,511 25,839 2,747 22,760 24,337 11,741 18,322 8,871 7,227 -
Table 3-A Funding Status and Ratios for Lump-Sum Plans For the Year Ended December 31, 2011
Relief Association
Hibbing Hill City Hills Hinckley Hitterdal Hoffman Hokah Holdingford Holland Hollandale Hopkins Houston Hovland Area Howard Lake Hoyt Lakes Hugo Ideal Industrial International Falls Inver Grove Heights Iona Isanti Isle Jackson Jacobson Janesville Jasper Jeffers Jordan Kandiyohi Karlstad Kasota Kasson Keewatin Kelliher Kellogg Kennedy Kensington Kerrick Kettle River Kilkenny Kimball Kinney La Crescent La Salle Lafayette Lake Benton Lake Bronson Lake City Lake Crystal
Net Assets
343,664 140,361 112,484 497,522 145,034 149,566 106,307 203,075 181,619 76,598 1,935,986 269,020 125,532 402,290 252,106 704,605 596,854 260,179 573,440 3,377,280 76,755 1,094,977 360,932 557,390 118,753 240,809 156,477 134,573 604,116 286,878 148,281 323,463 343,387 116,089 165,765 316,827 119,781 221,139 19,596 116,093 249,570 269,782 185,898 427,780 54,916 323,962 205,871 87,133 778,310 434,786
Accrued Liabilities
334,964 175,693 108,270 376,478 135,660 173,134 113,704 232,764 91,180 236 1,813,533 265,805 68,368 501,040 308,395 665,945 716,913 216,916 602,431 2,979,797 69,786 1,392,665 345,157 568,225 104,148 301,140 175,682 155,630 719,194 298,491 97,384 265,020 420,984 161,248 158,874 317,771 57,974 209,542 15,790 105,736 236,640 258,519 152,877 455,444 50,592 255,495 153,412 58,712 809,912 539,480
Surplus or (Deficit)
8,700 (35,332) 4,214 121,044 9,374 (23,568) (7,397) (29,689) 90,439 76,362 122,453 3,215 57,164 (98,750) (56,289) 38,660 (120,059) 43,263 (28,991) 397,483 6,969 (297,688) 15,775 (10,835) 14,605 (60,331) (19,205) (21,057) (115,078) (11,613) 50,897 58,443 (77,597) (45,159) 6,891 (944) 61,807 11,597 3,806 10,357 12,930 11,263 33,021 (27,664) 4,324 68,467 52,459 28,421 (31,602) (104,694)
64
Funding Ratio
103 80 104 132 107 86 93 87 199 32457 107 101 184 80 82 106 83 120 95 113 110 79 105 98 114 80 89 86 84 96 152 122 82 72 104 100 207 106 124 110 105 104 122 94 109 127 134 148 96 81
Deficit Amortization Payment*
5,452 3,417 1,055 5,542 13,994 6,876 16,302 44,357 9,158 8,911 3,880 21,188 14,574 10,412 6,182 19,952
Normal Cost
21,749 14,659 12,150 27,274 11,029 13,559 12,075 19,674 5,425 18 188,021 23,480 8,484 38,528 27,600 65,013 61,048 11,578 61,490 316,216 4,494 100,416 24,949 45,143 11,040 36,316 15,587 10,560 59,926 21,534 10,395 27,768 38,240 25,056 11,387 20,388 4,550 20,857 1,082 10,260 15,888 22,390 9,503 39,456 4,712 23,353 12,432 7,424 62,725 44,160
Required Contribution^
5,587 1,919 4,129 21,647 13,472 28,162 39,134 23,713 25,925 23,304 24,074 2,481 22,579
Table 3-A Funding Status and Ratios for Lump-Sum Plans For the Year Ended December 31, 2011
Relief Association
Net Assets
Lake Elmo Lake Henry Lake Kabetogama Lake Lillian Lake Park Lake Wilson Lakefield Lakeville Lakewood Lamberton Lancaster Lanesboro Le Sueur Leaf Valley LeRoy Lester Prairie Lewiston Lewisville Lindstrom Linwood Lismore Litchfield Little Canada Little Falls Littlefork Long Lake Long Prairie Lonsdale Loretto Lower Saint Croix Valley Lowry Lucan Luverne Lynd Mabel Madelia Madison Madison Lake Mahnomen Mahtowa Makinen Mantorville Maple Hill Maple Lake Maple Plain Mapleton Mapleview Maplewood Marble Marshall
887,064 135,140 151,556 119,767 175,011 159,189 337,195 5,619,763 255,315 158,290 125,764 276,444 671,828 206,974 153,675 ** 417,636 222,426 642,562 470,977 135,388 526,546 1,687,941 959,239 217,116 1,384,617 434,679 555,974 1,273,449 1,130,563 334,288 98,780 712,458 81,439 104,993 229,996 138,311 261,542 302,559 118,356 84,821 287,111 193,635 907,322 925,123 400,397 171,083 4,477,821 229,081 2,551,916
Accrued Liabilities
763,526 114,185 125,880 131,474 175,440 157,920 295,240 5,480,096 225,513 186,542 96,102 296,127 623,129 258,952 129,371 ** 395,388 185,462 674,859 502,760 118,270 633,194 1,813,067 1,111,827 174,326 1,345,119 481,011 491,919 1,451,888 1,165,363 308,859 96,813 713,712 63,135 106,476 336,744 183,980 234,531 298,682 98,170 105,415 264,592 142,009 996,294 950,552 335,556 61,620 4,257,762 194,372 2,810,644
Surplus or (Deficit)
123,538 20,955 25,676 (11,707) (429) 1,269 41,955 139,667 29,802 (28,252) 29,662 (19,683) 48,699 (51,978) 24,304 ** 22,248 36,964 (32,297) (31,783) 17,118 (106,648) (125,126) (152,588) 42,790 39,498 (46,332) 64,055 (178,439) (34,800) 25,429 1,967 (1,254) 18,304 (1,483) (106,748) (45,669) 27,011 3,877 20,186 (20,594) 22,519 51,626 (88,972) (25,429) 64,841 109,463 220,059 34,709 (258,728)
65
Funding Ratio
116 118 120 91 100 101 114 103 113 85 131 93 108 80 119 ** 106 120 95 94 114 83 93 86 125 103 90 113 88 97 108 102 100 129 99 68 75 112 101 121 80 109 136 91 97 119 278 105 118 91
Deficit Amortization Payment*
2,155 6,204 198 3,857 5,682 15,380 20,972 21,437 6,431 9,367 18,113 13,544 4,451 3,655 13,320 20,320 56,064
Normal Cost
72,887 10,129 9,597 10,794 16,889 12,660 24,860 532,470 15,782 18,962 10,100 23,342 57,460 17,266 10,971 27,027 37,050 12,068 55,634 49,680 8,520 58,692 113,132 102,823 20,335 120,677 40,845 49,400 116,547 78,554 21,698 10,440 68,200 4,608 9,965 27,504 23,676 26,213 27,027 10,470 7,064 21,120 10,668 52,054 56,494 38,484 6,560 338,024 21,223 230,230
Required Contribution^
504 3,367 7,881 35 2,671 8,318 1,515 29,522 11,510 24,462 1,061 34,296 13,268 2,766 16,758 9,112 6,493 7,479 16,429 592 99,646
Table 3-A Funding Status and Ratios for Lump-Sum Plans For the Year Ended December 31, 2011
Relief Association
Net Assets
Mayer Maynard McDavitt McGrath McGregor McIntosh McKinley Meadowlands Medford Melrose Menahga Middle River Miesville Milaca Milan Miltona Minneota Minnesota Lake Mission Montevideo Montgomery Monticello Montrose Moose Lake Mora Morgan Morris Morristown Morse-Fall Lake Morton Motley Mountain Iron Mountain Lake Nashwauk Nerstrand Nevis New Auburn New Brighton New Germany New London New Munich New Prague New Richland New York Mills Newfolden Newport Nicollet Nisswa Normanna North Branch
511,813 252,207 105,506 157,342 477,614 125,462 ** 64,305 240,197 337,047 277,920 159,151 252,589 669,976 186,507 227,090 283,706 225,623 276,450 439,384 443,183 1,127,049 505,860 226,839 575,199 424,322 589,558 509,033 57,787 183,939 191,824 222,954 195,391 301,235 47,923 231,899 139,537 2,848,076 445,472 251,006 115,259 550,733 231,255 172,596 138,848 847,735 277,182 597,264 ** 329,742
Accrued Liabilities
504,786 234,215 106,948 114,914 534,510 130,718 ** 31,284 251,346 351,108 258,466 82,680 266,953 675,696 136,830 244,275 258,836 215,225 306,874 458,442 428,782 1,234,025 499,920 239,534 574,615 415,808 609,620 517,616 1,130 202,496 197,568 219,132 203,616 338,075 10,864 174,413 199,307 2,815,606 455,026 323,120 90,171 792,512 203,000 195,825 101,028 1,069,115 287,517 669,216 ** 723,193
Surplus or (Deficit)
7,027 17,992 (1,442) 42,428 (56,896) (5,256) ** 33,021 (11,149) (14,061) 19,454 76,471 (14,364) (5,720) 49,677 (17,185) 24,870 10,398 (30,424) (19,058) 14,401 (106,976) 5,940 (12,695) 584 8,514 (20,062) (8,583) 56,657 (18,557) (5,744) 3,822 (8,225) (36,840) 37,059 57,486 (59,770) 32,470 (9,554) (72,114) 25,088 (241,779) 28,255 (23,229) 37,820 (221,380) (10,335) (71,952) ** (393,451)
66
Funding Ratio
101 108 99 137 89 96 ** 206 96 96 108 192 95 99 136 93 110 105 90 96 103 91 101 95 100 102 97 98 5114 91 97 102 96 89 441 133 70 101 98 78 128 69 114 88 137 79 96 89 ** 46
Deficit Amortization Payment*
565 6,280 6,392 463 3,478 13,042 1,035 196 8,429 8,661 300 12,820 30,661 3,554 28,868 262 57,456
Normal Cost
40,960 14,982 12,420 8,460 36,192 12,516 8,232 3,828 20,053 29,500 20,658 8,320 18,214 52,320 8,600 22,906 27,452 17,904 31,040 48,909 49,356 90,690 38,700 21,720 54,791 35,709 46,954 40,256 234 16,592 21,984 26,172 26,064 29,831 835 17,607 16,720 213,248 32,281 34,164 8,026 92,171 23,240 22,725 9,936 84,785 30,800 59,520 1,800 76,672
Required Contribution^
3,712 2,405 2,417 1,232 13,725 2,554 10,465 14,687 254 5,622 5,923 7,834 12,388 11,320 7,595 52,507 4,431 64,438 82,725
Table 3-A Funding Status and Ratios for Lump-Sum Plans For the Year Ended December 31, 2011
Relief Association
Net Assets
North Mankato North Saint Paul Northfield Northland Northome Norwood Young America Oak Grove Oakdale Odin Ogilvie Okabena Olivia Onamia Ormsby Oronoco Orr Ortonville Osakis Osseo Ostrander Owatonna Palisade Palo Park Rapids Parkers Prairie Paynesville Pelican Rapids Pemberton Pennock Pequaywan Pequot Lakes Perham Pierz Pillager Pine Island Pine River Plato Porter Preston Princeton Prinsburg Prior Lake Proctor Randall Randolph Raymond Red Wing Redwood Falls Remer Renville
1,299,077 1,091,613 3,315,338 84,329 131,413 481,487 976,084 1,976,753 120,346 186,067 168,298 280,970 248,501 174,727 197,531 143,395 357,810 461,081 411,575 72,622 1,840,201 128,592 ** 949,853 232,579 562,316 377,197 120,667 ** ** 1,030,654 577,983 365,755 488,947 384,505 647,849 465,830 299,208 246,227 1,076,982 209,766 2,548,946 316,287 348,929 492,408 225,360 892,070 651,002 523,061 309,535
Accrued Liabilities
1,385,092 1,114,186 3,545,570 38,904 125,972 631,951 930,580 2,053,595 103,970 274,106 103,572 372,952 289,676 138,183 154,857 117,916 354,260 566,904 383,980 50,406 1,955,541 133,368 ** 954,300 320,470 643,861 374,640 89,595 ** ** 871,158 699,092 404,260 567,111 451,786 646,054 451,722 162,522 304,681 1,046,186 147,086 2,676,003 209,519 218,672 495,990 234,976 621,574 756,715 464,160 380,362
Surplus or (Deficit)
(86,015) (22,573) (230,232) 45,425 5,441 (150,464) 45,504 (76,842) 16,376 (88,039) 64,726 (91,982) (41,175) 36,544 42,674 25,479 3,550 (105,823) 27,595 22,216 (115,340) (4,776) ** (4,447) (87,891) (81,545) 2,557 31,072 ** ** 159,496 (121,109) (38,505) (78,164) (67,281) 1,795 14,108 136,686 (58,454) 30,796 62,680 (127,057) 106,768 130,257 (3,582) (9,616) 270,496 (105,713) 58,901 (70,827)
67
Funding Ratio
94 98 94 217 104 76 105 96 116 68 162 75 86 126 128 122 101 81 107 144 94 96 ** 100 73 87 101 135 ** ** 118 83 90 86 85 100 103 184 81 103 143 95 151 160 99 96 144 86 113 81
Deficit Amortization Payment*
57,417 27,690 9,512 12,311 6,843 18,543 65,309 8,667 39 2,304 20,850 5,389 11,960 15,260 8,795 62,625 5,329 4,726 11,575
Normal Cost
129,954 102,816 234,900 3,395 9,482 51,383 80,418 214,616 8,280 34,183 6,831 27,302 20,570 8,599 19,198 8,571 29,040 50,336 40,064 4,165 124,867 12,708 14,839 72,660 27,434 52,366 39,492 8,822 17,748 7,030 81,780 60,952 38,925 50,336 62,244 41,886 29,032 7,385 30,108 98,386 8,740 265,042 27,523 26,472 37,401 19,504 62,481 78,305 33,060 32,906
Required Contribution^
22,740 8,308 25,571 38,897 14,091 21,086 11,571 2,860 31,736 1,304 12,423 405 22,982 390 19,057 27,273 14,055 4,440 75,925 8,556 3,237 11,317 18,983
Table 3-A Funding Status and Ratios for Lump-Sum Plans For the Year Ended December 31, 2011
Relief Association
Net Assets
Rice Rice Lake Richmond Rockford Rockville Rogers Rollingstone Rose Creek Roseau Rosemount Rothsay Royalton Rush City Ruthton Sabin-Elmwood Sacred Heart Saint Anthony Saint Augusta Saint Bonifacius Saint Charles Saint Clair Saint Francis Saint James Saint Joseph Saint Leo Saint Martin Saint Michael Saint Paul Park Saint Peter Saint Stephen Sanborn Sandstone Sartell Sauk Centre Sauk Rapids Scandia Valley Schroeder Sebeka Sedan Shafer Shakopee Shelly Sherburn Shevlin Silica Silver Bay Silver Lake Slayton Sleepy Eye Solway
346,268 491,856 389,921 452,855 396,192 739,332 87,269 98,598 578,287 2,783,038 307,550 152,245 459,288 213,233 228,461 147,895 889,001 42,237 453,465 574,646 638,993 618,972 625,546 493,020 158,375 427,667 760,819 560,763 753,629 367,332 122,445 203,253 775,921 528,126 1,127,579 ** 112,999 397,834 60,556 211,750 3,974,012 142,669 512,501 182,304 123,191 457,400 234,412 350,050 815,478 189,176
Accrued Liabilities
323,756 370,748 336,875 492,846 530,556 893,292 90,923 126,480 400,896 2,994,864 295,392 207,262 596,750 183,045 176,176 186,977 905,996 40,130 421,434 567,468 412,176 527,472 650,706 610,503 130,354 418,674 792,621 570,772 909,928 433,152 115,665 221,970 809,789 601,013 1,187,030 ** 79,568 425,129 22,776 202,106 4,480,608 72,618 499,793 140,090 117,269 386,954 282,759 458,640 851,918 143,938
Surplus or (Deficit)
22,512 121,108 53,046 (39,991) (134,364) (153,960) (3,654) (27,882) 177,391 (211,826) 12,158 (55,017) (137,462) 30,188 52,285 (39,082) (16,995) 2,107 32,031 7,178 226,817 91,500 (25,160) (117,483) 28,021 8,993 (31,802) (10,009) (156,299) (65,820) 6,780 (18,717) (33,868) (72,887) (59,451) ** 33,431 (27,295) 37,780 9,644 (506,596) 70,051 12,708 42,214 5,922 70,446 (48,347) (108,590) (36,440) 45,238
68
Funding Ratio
107 133 116 92 75 83 96 78 144 93 104 73 77 116 130 79 98 105 108 101 155 117 96 81 121 102 96 98 83 85 106 92 96 88 95 ** 142 94 266 105 89 196 103 130 105 118 83 76 96 131
Deficit Amortization Payment*
10,960 16,094 29,521 1,313 4,757 44,347 6,987 29,188 7,755 14,310 17,389 11,713 16,795 11,516 6,248 5,137 8,658 5,945 3,749 99,004 9,764 16,248 12,116 -
Normal Cost
21,548 34,314 26,919 54,349 37,020 85,535 8,628 8,448 41,472 282,210 17,680 19,109 49,106 11,340 17,682 19,344 72,296 11,010 49,222 45,804 29,832 52,164 54,457 53,720 9,190 26,736 69,712 50,160 68,743 34,669 10,967 28,525 72,358 45,105 99,400 23,235 10,224 29,916 2,190 19,089 374,291 3,564 31,547 8,444 9,315 24,068 22,916 39,180 58,254 21,919
Required Contribution^
18,496 19,037 26,676 115,973 11,073 35,185 10,014 18,512 13,679 350 5,073 9,347 11,521 12,366 907 5,034 152,677 8,750 25,724 9,022 -
Table 3-A Funding Status and Ratios for Lump-Sum Plans For the Year Ended December 31, 2011
Relief Association
Solway Rural South Haven Spicer Spring Grove Spring Valley Springfield Squaw Lake Stacy-Lent Area Staples Starbuck Stephen Stewart Stewartville Stillwater Storden Sturgeon Lake Sunburg Taconite Taunton Taylors Falls Thief River Falls Thomson Tofte Tower Tracy Trimont Truman Twin Lakes (City) Twin Lakes (VFD) Two Harbors Tyler Upsala Vadnais Heights Vergas Verndale Vernon Center Vesta Victoria Vining Wabasha Waconia Wadena Waite Park Waldorf Walker Walnut Grove Walters Warren Warroad Waseca
Net Assets
67,271 254,050 259,594 145,219 496,975 243,576 186,966 520,245 314,345 171,614 194,158 244,935 1,061,011 2,971,899 175,549 89,639 ** 95,496 74,774 330,168 846,127 473,951 125,186 ** 303,052 377,071 226,624 214,232 39,743 601,974 196,744 150,625 1,014,217 155,503 358,020 126,767 114,333 780,853 61,535 333,241 802,285 591,661 701,469 178,089 618,775 131,745 101,172 200,996 336,744 1,094,907
Accrued Liabilities
71,450 288,979 327,852 168,378 499,114 364,803 88,921 521,666 364,854 198,243 124,260 185,421 882,640 2,738,785 180,372 72,339 ** 124,154 65,406 389,148 823,623 518,034 140,431 ** 329,922 348,054 238,672 122,886 56,199 562,130 184,370 111,579 1,169,580 168,824 314,712 128,909 104,740 830,230 63,112 462,812 857,408 563,774 797,267 125,740 536,650 123,025 108,192 175,907 266,328 1,264,699
Surplus or (Deficit)
(4,179) (34,929) (68,258) (23,159) (2,139) (121,227) 98,045 (1,421) (50,509) (26,629) 69,898 59,514 178,371 233,114 (4,823) 17,300 ** (28,658) 9,368 (58,980) 22,504 (44,083) (15,245) ** (26,870) 29,017 (12,048) 91,346 (16,456) 39,844 12,374 39,046 (155,363) (13,321) 43,308 (2,142) 9,593 (49,377) (1,577) (129,571) (55,123) 27,887 (95,798) 52,349 82,125 8,720 (7,020) 25,089 70,416 (169,792)
69
Funding Ratio
94 88 79 86 100 67 210 100 86 87 156 132 120 109 97 124 ** 77 114 85 103 91 89 ** 92 108 95 174 71 107 107 135 87 92 114 98 109 94 98 72 94 105 88 142 115 107 94 114 126 87
Deficit Amortization Payment*
1,090 5,221 7,876 6,173 15,442 5,651 6,045 2,539 3,008 13,124 5,981 5,721 4,823 36,432 3,570 25,748 17,320 3,975 2,491 35,056
Normal Cost
8,860 25,380 32,552 17,920 33,925 33,705 8,825 34,298 32,816 19,839 12,980 17,680 74,932 154,200 12,504 8,285 11,151 12,487 4,062 28,560 78,870 33,440 11,872 8,292 33,098 24,444 20,848 7,893 3,960 53,491 12,850 10,491 126,077 15,645 28,224 10,575 9,370 61,151 7,216 31,024 81,400 38,612 59,532 13,090 60,400 11,621 7,136 13,515 22,985 99,385
Required Contribution^
6,025 16,224 7,152 27,923 6,727 3,575 5,589 2,880 10,295 7,329 8,962 1,265 64,989 25,586 16,262 33,607
Table 3-A Funding Status and Ratios for Lump-Sum Plans For the Year Ended December 31, 2011
Relief Association
Watertown Waterville Watkins Watson Waubun Waverly Welcome Wendell West Concord Westbrook Wheaton Willmar Willow River Wilmont Wilson Windom Winnebago Winsted Wolf Lake Wood Lake Woodbury Woodstock Wrenshall Wright Wykoff Wyoming Zimmerman Zumbro Falls Totals
Net Assets
Accrued Liabilities
Surplus or (Deficit)
636,478 341,955 317,917 152,577 159,916 241,106 258,753 171,089 314,268 141,945 474,468 ** 130,436 192,451 387,076 755,075 282,720 361,811 217,750 123,904 6,365,953 123,335 150,183 127,179 295,510 289,034 489,246 238,962 $ 255,740,868
778,300 358,332 302,576 170,860 117,920 231,973 240,123 164,004 224,211 99,112 392,234 ** 124,896 144,228 227,624 715,423 204,598 460,600 230,856 99,202 6,504,571 98,185 142,592 100,799 331,944 251,552 608,940 270,192 $ 255,624,623
(141,822) (16,377) 15,341 (18,283) 41,996 9,133 18,630 7,085 90,057 42,833 82,234 ** 5,540 48,223 159,452 39,652 78,122 (98,789) (13,106) 24,702 (138,618) 25,150 7,591 26,380 (36,434) 37,482 (119,694) (31,230) $ 116,245
Funding Ratio
82 95 105 89 136 104 108 104 140 143 121 ** 104 133 170 106 138 79 94 125 98 126 105 126 89 115 80 88 100 %
Deficit Amortization Payment*
Normal Cost
19,012 4,475 25,042 11,317 5,395 17,607 9,178 $ 2,384,433
62,712 25,584 22,617 13,470 8,993 25,172 20,608 13,368 21,040 13,208 43,660 85,515 11,376 8,685 12,468 69,644 19,208 35,490 12,944 9,702 547,245 7,048 12,400 9,750 20,784 26,703 85,824 21,192 $ 22,167,314
Required Contribution^
$
19,900 1,736 1,428 117 10,616 20,420 43,378 8,827 3,109,791
* For lump-sum plans, the Deficit Amortization Payment amounts are based on projected amounts as of August 1, 2011, as reported by relief associations on their 2011 Schedule Form. ^ For lump-sum plans, the Required Contribution is obtained from the 2011 Schedule Form and represents amounts to be contributed to the relief association during 2012. ** These relief associations joined the Voluntary Statewide Lump-Sum Volunteer Firefighter Retirement Plan on January 1, 2012. The assets for these relief associations were transferred to the State Board of Investment and their liabilities were transferred to the Plan at the end of 2011.
70
Table 3-B Funding Status and Ratios for Defined-Contribution Plans For the Year Ended December 31, 2011
Relief Association Alaska Andover Anoka-Champlin Ashby Austin Brewster Brooklyn Park Callaway Cloquet Area Fire District Cologne Columbia Heights Coon Rapids Crosslake Dakota Dalbo Dilworth Donnelly Eagan Edina Elbow Lake Elgin Ellsburg Embarrass Erskine Falcon Heights Fisher Fosston Fountain Freeport Fridley Gary Gibbon Glenville Goodhue Gunflint Trail Hardwick Hawley Ivanhoe Kelsey Kenyon Kerkhoven Kiester Lake George Lakeport Le Center London Longville
$
Net Assets 123,211 3,030,312 3,159,624 276,187 782,960 261,081 6,791,458 126,796 114,995 367,037 1,371,840 6,129,012 898,580 104,072 333,225 610,578 160,162 8,394,024 6,943,991 264,393 293,304 * * 151,143 1,196,405 154,656 379,660 107,273 277,925 3,286,663 97,239 296,841 161,917 664,261 259,927 * 397,947 285,641 37,554 351,146 207,281 144,980 140,594 226,001 355,654 73,940 748,707
Accrued Liabilities $ 123,211 3,030,312 3,159,624 276,187 782,960 261,081 6,791,458 126,796 114,995 367,037 1,371,840 6,129,012 898,580 104,072 333,225 610,578 160,162 8,394,024 6,943,991 264,393 293,304 * * 151,143 1,196,405 154,656 379,660 107,273 277,925 3,286,663 97,239 296,841 161,917 664,261 259,927 * 397,947 285,641 37,554 351,146 207,281 144,980 140,594 226,001 355,654 73,940 748,707
Surplus or Funding (Deficit) Ratio $ 100 % 100 100 100 100 100 100 100 100 100 100 100 100 100 100 100 100 100 100 100 100 * * * * 100 100 100 100 100 100 100 100 100 100 100 100 * * 100 100 100 100 100 100 100 100 100 100 100
71
Deficit Amortization Payment $ -
Normal Cost $ -
Required Contribution $ -
Table 3-B Funding Status and Ratios for Defined-Contribution Plans For the Year Ended December 31, 2011
Relief Association Lyle Magnolia Maple Grove Marietta Marine-On-Saint Croix Mazeppa Medicine Lake Mendota Heights Mentor Millerville Milroy Murdock Myrtle Nassau Nodine Northrop Odessa Oklee Plainview Plummer Ramsey Red Lake Falls Round Lake Rushford Rushmore Saint Hilaire Seaforth South Bend Swanville Toivola Ulen Underwood Vermilion Lake Viking Wabasso Wanamingo Wanda Wayzata Wells West Metro Williams Winthrop Zumbrota Totals
Net Assets 108,191 63,077 9,208,235 80,213 437,866 203,662 688,214 2,141,988 85,617 351,576 141,625 176,681 194,311 150,660 177,237 107,427 56,874 86,159 561,455 129,303 1,834,031 178,694 209,524 306,968 92,438 145,388 76,890 290,445 202,304 152,172 165,690 270,589 195,698 0 182,488 327,304 96,641 1,932,553 407,089 5,614,272 169,735 291,359 538,404 $ 79,371,244
Accrued Liabilities 108,191 63,077 9,208,235 80,213 437,866 203,662 688,214 2,141,988 85,617 351,576 141,625 176,681 194,311 150,660 177,237 107,427 56,874 86,159 561,455 129,303 1,834,031 178,694 209,524 306,968 92,438 145,388 76,890 290,445 202,304 152,172 165,690 270,589 195,698 0 182,488 327,304 96,641 1,932,553 407,089 5,614,272 169,735 291,359 538,404 $ 79,371,244
Surplus or (Deficit) 0
Funding Ratio 100 100 100 100 100 100 100 100 100 100 100 100 100 100 100 100 100 100 100 100 100 100 100 100 100 100 100 100 100 100 100 100 100 100 100 100 100 100 100 100 100 100 100 100 %
Deficit Amortization Payment 0
Normal Cost 0
Required Contribution 0
* These relief associations joined the Voluntary Statewide Lump-Sum Volunteer Firefighter Retirement Plan on January 1, 2012. The assets for these relief associations were transferred to the State Board of Investment and its liabilities were transferred to the Plan at the end of 2011.
72
Table 3-C Funding Status and Ratios for Other Plan Types For the Year Ended December 31, 2011
Relief Association Apple Valley Appleton Benson Brooklyn Center Chanhassen Chaska Eden Prairie Fairmont Glencoe Hutchinson Lake Johanna Minnetonka Mound New Ulm Pine City Pipestone Plymouth Robbinsdale Roseville Savage Spring Lake Park White Bear Lake Worthington Totals
Net Assets $ 4,403,850 256,237 259,234 3,166,825 2,194,668 3,995,079 16,841,826 1,388,790 724,057 1,446,624 3,727,977 11,937,087 4,016,605 1,816,087 949,077 510,948 6,333,430 1,369,303 7,441,903 3,843,537 10,340,923 5,223,158 1,105,847 $ 93,293,072
Accrued Liability $ 6,299,205 280,742 415,585 3,400,009 2,865,206 5,339,597 19,893,888 2,033,498 1,019,902 2,369,614 3,862,348 12,902,578 4,474,396 2,234,569 789,791 702,622 5,624,355 2,211,881 8,735,560 4,911,053 9,655,189 5,009,301 1,377,194 $ 106,408,083
Surplus or Funding (Deficit) Ratio $ (1,895,355) 70 % (24,505) 91 (156,351) 62 (233,184) 93 (670,538) 77 (1,344,518) 75 (3,052,062) 85 (644,708) 68 (295,845) 71 (922,990) 61 (134,371) 97 (965,491) 93 (457,791) 90 (418,482) 81 159,286 120 (191,674) 73 709,075 113 (842,578) 62 (1,293,657) 85 (1,067,516) 78 685,734 107 213,857 104 (271,347) 80 $ (13,115,011) 88 %
Deficit Amortization Payment* $ 182,768 19,145 69,705 199,113 312,383 86,385 39,668 105,486 16,742 64,590 65,963 44,972 22,772 95,950 180,596 129,956 15,623 $ 1,651,817
Normal Cost $ 223,747 9,352 8,550 101,575 74,020 90,055 534,071 56,421 32,215 34,827 183,867 244,379 85,529 68,017 11,591 31,084 241,271 83,391 95,624 87,232 162,692 125,003 44,271 $ 2,628,784
Required Contribution^ $ 261,318 10,667 12,711 57,179 199,230 614,761 88,441 58,159 88,973 33,077 84,143 83,793 69,428 36,645 143,621 152,500 147,290 44,175 $ 2,186,111
* For monthly and monthly/lump-sum combination plans, the Deficit Amortization Payment amounts are obtained from actuarial valuations or actuarial estimates prepared according to the benefit provisions applicable on December 31, 2011. ^ For monthly and monthly/lump-sum combination plans, the Required Contribution is obtained from actuarial valuation statistics associated with the December 31, 2011, benefit level of the plan and represents an estimated required contribution for the next budget year. If an estimated required contribution is not provided in the actuarial valuation, it is calculated by reducing the total financial requirements as stated in the valuation by the estimated fire state aid.
73
This page is intentionally left blank.
How to Read Tables 4-A Through 4-C
Tables 4-A, 4-B, and 4-C provide relief association revenues and expenditures for 2011.
Revenues State Aid – The amount of fire state aid the relief association received during 2011, or the amount payable for 2011 if not yet received. Supplemental Benefit Reimbursements – The total amount received in reimbursements from the State of Minnesota for the mandatory additional 10 percent (up to $1,000) payment for lump-sum service pensions and the optional 20 percent (up to $2,000) payment for survivor benefits. Supplemental benefits are additional benefits that are paid at the time of the pension or benefit disbursement, and are meant to help offset state income taxes that must be paid on relief association benefits. Municipal Contributions – The amount of city, town, or independent nonprofit firefighting corporation contributions received by the relief association during 2011, or payable for 2011 if not yet received. Investment Earnings – The net interest and realized and unrealized gain (loss) on investments during 2011. All Other – All other income received by the relief association during 2011, which includes, but is not limited to, donations, transfers from the General Fund, and other income.
Expenditures Administration – Expenses paid for items such as salaries, training, audit, actuarial and legal fees, and fidelity bonds. It also includes any other uncategorized expenditures. Service Pensions – The total of all service pension disbursements during 2011, including lump-sum and monthly distributions. Other Benefits – The total of all non-service pension benefit distributions during 2011, including short- and long-term disability payments and survivor benefits.
75
This page is intentionally left blank.
77
Relief Association Ada Adams Adrian Aitkin Albany Albert Lea Township Albertville Almelund Alpha Altura Amboy Annandale Argyle Arlington Arrowhead Askov Atwater Audubon Aurora Avon Babbitt Backus Badger Bagley Balaton Baldwin Balsam Barnesville Barnum Barrett
$
State Aid 11,346 10,037 10,910 39,528 16,120 6,546 39,914 11,346 6,546 9,164 9,164 31,567 10,910 14,520 6,109 7,855 10,705 14,602 9,600 20,395 10,910 15,125 7,855 16,069 11,346 22,985 9,370 15,454 10,910 6,982
Supplemental Benefit Reimbursements $ 1,000 1,000 2,000 1,000 2,000 1,000 1,000 240 1,000 1,000 2,183 2,000 2,000 2,420 Municipal Contributions $ 4,867 7,763 10,000 24,250 29,037 4,000 6,155 3,000 18,863 1,826 2,736 16,243 24,833 10,500 11,800 22,000 7,047 1,158 15,000 8,000 2,329 2,000
Revenues Investment Earnings $ (7,818) 2,474 11,020 (23,201) (13,146) (518) (11,818) 4,611 1,132 (2,374) 2,933 (15,758) (1,241) (20,419) 1,915 1,258 2,106 10,800 (4,634) (2,813) 14,796 (20,394) (475) 11,172 1,697 (9,073) 3,463 (4,820) 3,526 (1,638) $
3,425 550 44 20 200 2,054 1,004 95 550 121 280 -
All* Other Administration $ 659 1,010 1,835 1,895 3,424 2,179 550 20 421 3,650 322 1,783 600 750 1,972 1,935 3,220 4,598 1,439 1,540 925 2,127 1,973 3,564 4,583 5,002 475
Table 4-A Revenues and Expenditures for Lump-Sum Plans For the Year Ended December 31, 2011
$
15,950 29,000 30,920 38,338 95,062 44,067 23,200 8,800 11,752 26,724 26,812 85,220 23,366 27,000 40,811 60,987 52,775 5,200 -
Service Pensions
Expenditures
$
37,000 22,400 13,467 23,525 -
Other Benefits
78
Relief Association Battle Lake Baudette Bayport Beardsley Beaver Bay Beaver Creek Becker Belgrade Belle Plaine Bellingham Belview Bemidji Bertha Bethel Big Lake Bigelow Bigfork Bird Island Biwabik City Blackduck Blackhoof Blooming Prairie Blue Earth Bluffton Bovey Bowlus Boyd Braham Brainerd Brandon
State Aid 20,468 12,608 62,863 8,728 6,109 6,982 51,225 10,910 36,167 8,728 10,473 124,688 8,728 63,428 8,291 10,806 10,910 9,600 14,760 8,728 20,225 17,397 6,982 8,728 9,164 8,291 20,785 145,914 10,910
Supplemental Benefit Reimbursements 690 1,000 2,000 2,000 2,634 1,352 5,994 1,000 176 2,000 1,000 1,000 2,000 5,263 Municipal Contributions 253 3,355 10,000 10,084 39,999 154 9,326 2,205 865 8,000 16,100 10,591 10,000 14,113 3,895 4,000 12,000 12,320 750 65,993 10,170
Revenues Investment Earnings 2,666 (3,675) 1,852 (1,250) 3,341 1,983 (24,074) (8,550) (22,200) (5,774) 1,059 (54,333) 2,105 3,081 (2,049) (1,779) (1,057) 2,297 (16,405) (5,275) (920) 2,040 (25,328) (3,847) 6,153 (35) 61 (1,364) (100,238) (3,830) 1,133 3,800 7,500 200 4,140 196 (404) 43 140
All* Other Administration 4,160 12,419 483 2,054 1,035 6,500 5,650 4,565 275 9,408 1,290 600 1,750 1,750 2,521 512 414 3,660 1,783 1,316 2,108 13,822 172,994^
Table 4-A Revenues and Expenditures for Lump-Sum Plans For the Year Ended December 31, 2011
7,590 144,593 61,856 53,000 104,319 20,602 252,713 16,576 33,802 20,000 176,468 95,816 90,774 23,000 9,240 54,510 4,904 32,989
Service Pensions
Expenditures Other Benefits -
79
Relief Association Breckenridge Breitung Brevator Bricelyn Brimson Brook Park Brooten Browerville Browns Valley Brownsdale Brownsville Brownton Buffalo Buffalo Lake Buhl Butterfield Byron Caledonia Calumet Cambridge Campbell Canby Cannon Falls Canosia Canton Carlos Carlton Carsonville Carver Cass Lake
State Aid 17,282 9,164 8,728 9,600 6,982 7,418 9,164 11,147 9,164 8,728 8,291 9,600 74,968 10,473 7,855 10,473 27,606 18,336 9,164 52,734 11,346 13,007 32,866 8,728 8,291 12,219 15,606 11,973 20,170 28,687
Supplemental Benefit Reimbursements 1,000 1,000 396 3,844 3,000 1,224 4,800 5,209 3,000 600 2,000 4,000 703 2,880 2,000 Municipal Contributions 20,899 14,000 1,500 2,600 4,307 1,000 29,242 77,448 7,448 15,159 5,500 18,628 2,400 763 10,000 3,000 10,000 33,700 13,372 28,000 10,850
Revenues Investment Earnings 636 844 (563) 6,301 993 4,873 1,652 3,573 (1,821) (8,622) 85 (3,391) (54,707) 4,014 (921) 2,101 (21,839) (2,628) (14,606) (12,316) 8,402 (1,129) (27,279) 3,916 127 10,051 752 (6) (2,666) (10,468) 2,485 389 17 10,000 61 4,047 50 220 1,350 90 100 8,000 19,060 250
All* Other Administration 5,133 282,825^ 550 135 1,285 752 3,275 2,956 375 5,595 3,265 968 240 3,950 1,650 2,250 1,074 315 2,906 657 745 120,680^ 7,222 2,296
Table 4-A Revenues and Expenditures for Lump-Sum Plans For the Year Ended December 31, 2011
26,250 14,200 4,354 8,800 10,723 51,000 150,000 61,479 107,043 70,200 6,600 33,550 216,925 36,560 110,400
Service Pensions
Expenditures
26,765 14,000 -
Other Benefits
80
Relief Association Centennial Center City Ceylon Chandler Chatfield Cherry Chisago Chisholm Chokio Clara City Claremont Clarissa Clarkfield Clarks Grove Clear Lake Clearbrook Clearwater Clements Cleveland Clifton Climax Clinton (Big Stone) Cohasset Cokato Cold Spring Coleraine Colvill Colvin Comfrey Cook
State Aid 103,828 9,279 9,164 7,418 19,592 8,728 23,603 18,070 9,600 10,213 6,912 10,473 12,219 7,200 19,571 11,541 17,934 9,600 11,836 8,728 7,418 9,164 20,524 19,951 29,494 7,930 5,673 6,546 10,037 14,398
Supplemental Benefit Reimbursements 4,004 3,000 2,000 1,000 1,000 1,000 1,000 1,917 1,000 490 1,000 1,000 816 53 1,000 Municipal Contributions 25,500 7,500 775 20,459 100 14,677 34,641 9,305 3,500 5,594 9,254 4,000 12,659 15,388 1,943 13,600 7,252 7,035 15,631 31,156 15,500 17,321 3,300 5,350 4,000 1,500
Revenues Investment Earnings (31,469) 3,291 2,344 3,063 (3,827) 2,891 3,724 (15,786) 3,837 (6,640) (2,088) 2,789 7,859 (2,491) 8,410 2,582 (9,355) (3,182) (2,612) 1,624 736 (470) (12,737) (13,595) (22,065) (616) (10) (638) 1,925 4,078 19 324 1,258 310 120 10 319 31 -
All* Other Administration 8,275 1,413 2,599 940 200 5 9,705 1,000 615 3,370 2,316 2,338 3,429 3,794 4,664 3,762 2,200 2,155 3,530 375 869 3,442 983 6,747 350 62,918^ 2,275 1,938 3,338
Table 4-A Revenues and Expenditures for Lump-Sum Plans For the Year Ended December 31, 2011
Service Pensions 221,858 40,500 68,300 3,326 15,700 68,200 16,750 22,000 22,785 30,271 29,417 5,386 46,150 50,344 8,976 581 41,500
Expenditures
16,500 675 -
Other Benefits
81
Relief Association Cosmos Cottage Grove Cotton Cottonwood Courtland Cromwell Crooked Lake Crookston Crosby Culver Currie Cuyuna Cyrus Dalton Danube Danvers Darfur Dassel Dawson Dayton Deer Creek Deer River Deerwood Delano Delavan Dent Detroit Lakes Dexter Dodge Center Dover
State Aid 6,981 120,470 13,091 12,219 9,600 11,782 8,291 14,908 17,267 2,766 9,600 10,472 7,855 10,473 7,855 6,982 6,982 23,431 12,561 21,358 8,728 24,295 16,692 34,625 8,291 12,637 61,190 6,982 12,292 9,164
Supplemental Benefit Reimbursements 3,576 1,783 875 2,000 2,698 1,000 415 2,060 3,000 1,000 2,000 1,000 1,000 2,751 3,434 Municipal Contributions 4,200 15,998 1,044 2,400 15,000 45,708 4,225 5,565 21,236 4,500 33,601 32,856 20,641 14,238 14,236 26,500 1,600 15,496 8,180 12,623 2,000
Revenues Investment Earnings (5,342) (20,563) (870) 3,743 4,471 (13,873) 3,952 (3,607) (9,613) (969) 2,445 212 934 4,698 (663) 963 2,510 (7,512) 5,724 3,133 1,757 (14,705) (3,006) (3,167) (179) (12,120) 41,586 2,904 (11,749) (23) 44 32 32 1,078 11,748 1,800 150 253 5,265 41,000 250 -
All* Other Administration 9,809 175 2,665 5,368 2,975 815 5,190 150 1,937 475 298 5,830 382 5,875 2,385 800 1,685 29 1,328 6,083 3,743 3,500 1,923
Table 4-A Revenues and Expenditures for Lump-Sum Plans For the Year Ended December 31, 2011
127,848 5,760 76,679 2,512 54,520 12,000 20,250 37,036 105,809 26,000 72,217 62,800 26,500 174,900 32,785 -
Service Pensions
Expenditures
39,950 3,840 -
Other Benefits
82
Relief Association Dovray Dumont Dunnell Eagle Bend Eagle Lake East Bethel East Grand Forks Eastern Hubbard Easton Echo Eden Valley Edgerton Eitzen Elizabeth Elk River Elko New Market Ellendale Ellsworth Elmer Elmore Elrosa Ely Elysian Emily Evansville Eveleth Excelsior Eyota Fairfax Farmington
State Aid 5,673 8,728 6,546 10,910 12,766 39,383 36,203 8,323 10,037 9,164 13,883 10,562 10,910 9,164 116,902 34,533 8,291 10,910 6,982 10,473 13,091 17,781 9,471 9,694 13,090 10,473 92,866 12,495 11,782 87,709
Supplemental Benefit Reimbursements 1,117 1,496 326 3,000 1,000 1,000 3,000 270 2,940 1,620 2,000 1,050 1,000 960 1,000 1,000 1,000 1,499 Municipal Contributions 175 6,607 24,794 28,315 6,000 2,495 950 3,500 4,281 3,650 6,573 38,500 78,467 3,000 3,781 9,000 20,344 12,202 5,000 24,204 88,124 4,025 11,401 187,713
Revenues Investment Earnings (327) 1,327 1,403 2,028 4,656 (41,826) 24,113 2,447 (5,437) (1,033) (23,774) 8,436 2,916 2,567 (41,247) (2,765) (4,028) 4,079 5,360 1,190 (4,530) (12,888) 4,438 (12,322) (2,874) (16,206) (55,839) 8,677 4,286 (61,967) 46 4,000 2,000 95 200 147 6,500 521 820 200 -
All* Other Administration 557 318 955 145 3,740 5,015 3,941 1,350 1,530 650 1,888 720 2,825 10,076 384 570 1,600 5,140 2,850 5,291 1,883 4,818 9,836 1,605 1,574 7,950
Table 4-A Revenues and Expenditures for Lump-Sum Plans For the Year Ended December 31, 2011
11,200 5,455 67,747 49,000 28,000 77,800 49,394 34,517 11,550 36,200 10,560 15,040 199,472 25,000 42,191 -
Service Pensions
Expenditures
79,021 -
Other Benefits
83
Relief Association Fayal Federal Dam Fergus Falls Fertile Fifty Lakes Finland Finlayson Flensburg Floodwood Foley Forada Forest Lake Foreston Franklin Frazee Fredenberg French Township Frost Fulda Garfield Garrison Garvin Gaylord Geneva Ghent Gilbert Glenwood Glyndon Gnesen Golden Valley
State Aid 9,600 4,031 58,411 11,027 5,673 14,593 13,091 6,720 11,782 34,068 10,473 89,503 10,037 8,728 17,835 6,546 10,910 9,600 12,901 11,500 25,721 6,546 13,791 6,218 6,982 8,728 22,264 11,346 10,910 97,286
Supplemental Benefit Reimbursements 1,000 1,000 1,000 1,000 1,000 748 1,000 1,000 1,000 3,000 4,000 9,000 Municipal Contributions 15,632 24,632 300 7,500 13,650 18,500 10,000 8,728 10,960 6,500 3,194 2,500 4,000 15,558 13,600 34,165 10,624 34,165 12,800 97,604
Revenues Investment Earnings 10,908 (4,660) 65,256 (5,532) 827 2,492 2,973 (1,000) (8,070) (14,464) (7,674) (61,273) (1,822) 5,162 (7,719) (3,440) (1,734) 2,800 7,176 943 (24,341) (791) (691) (3,497) 172 (3,523) 8,044 3,016 226 73,479 140 8,870 105 780 645 2,500 616 2,157 200 13,500 500 500 105 2,717 -
All* Other Administration 2,740 5,320 3,364 3,065 3,705 575 3,242 3,700 7,991 2,599 2,525 2,891 2,403 300 1,308 2,193 518 882 7,051 350 4,150 4,169 2,665 1,000 15,480
Table 4-A Revenues and Expenditures for Lump-Sum Plans For the Year Ended December 31, 2011
25,180 23,200 20,460 93,000 81,975 143,875 28,000 25,000 23,860 8,228 33,100 28,000 11,500 28,500 56,596 59,600 87,084 1,107,724
Service Pensions
Expenditures
22,000 -
Other Benefits
84
Relief Association Gonvick Good Thunder Goodland Goodview Graceville Granada Grand Lake Grand Meadow Grand Rapids Granite Falls Green Isle Greenbush Greenwood Grey Eagle Grove City Grygla Hackensack Hallock Halstad Ham Lake Hamburg Hamel Hancock Hanley Falls Hanska Harmony Harris Hartland Hastings Hayfield
State Aid 8,728 9,544 7,855 13,091 10,910 7,418 13,091 13,356 86,016 16,635 10,473 13,091 13,282 10,141 8,728 8,728 16,946 12,219 10,473 56,655 11,781 30,230 10,037 10,037 10,910 10,910 8,291 9,164 112,798 15,607
Supplemental Benefit Reimbursements 2,000 2,409 2,000 2,211 1,000 1,000 2,000 2,504 468 1,181 2,912 275 3,570 4,000 2,692 2,896 1,000 736 4,750 900 Municipal Contributions 4,176 6,900 10,763 2,500 3,757 25,993 5,000 26,795 10,082 3,913 30,000 5,600 290 5,000 24,350 2,000 14,796 46,725 44,344 1,500 5,000 1,800 18,481
Revenues Investment Earnings 930 (382) 1,885 (4,404) 5,523 (2,180) (230) (9,498) (28,470) (4,600) (3,352) (2,258) 6,948 58 1,810 (1,186) 6,149 (3,088) 3,683 (22,156) 17,249 (19,185) 7,786 1,246 262 (2,035) (1,343) (1,537) (1,967) (15,981) 500 3,500 12,178 100 2,201 495 85 250 56 184 1,458 500
All* Other Administration 5,670 4,461 705 870 2,750 3,657 10,008 6,991 2,793 1,313 2,850 2,300 930 1,621 1,871 6,820 9,189 4,115 2,394 94 5,185 600
Table 4-A Revenues and Expenditures for Lump-Sum Plans For the Year Ended December 31, 2011
Service Pensions 14,271 36,212 46,136 26,200 23,253 45,523 17,416 11,098 8,961 59,094 5,148 3,400 41,197 143,762 65,605 156,994 33,456 13,240 11,627 148,412 -
Expenditures
100 82,000 -
Other Benefits
85
Relief Association Hayward Hector Henderson Hendricks Hendrum Henning Herman Hermantown Heron Lake Hewitt Hibbing Hill City Hills Hinckley Hitterdal Hoffman Hokah Holdingford Holland Hollandale Hopkins Houston Hovland Area Howard Lake Hoyt Lakes Hugo Ideal Industrial International Falls Inver Grove Heights
State Aid 9,600 11,815 10,473 10,910 8,291 10,937 10,910 33,935 8,728 6,109 15,621 10,037 11,346 21,088 6,546 10,473 13,091 10,473 8,728 8,728 65,039 10,910 5,701 15,227 10,910 50,335 20,449 7,418 41,958 124,167
Supplemental Benefit Reimbursements 2,000 2,000 1,000 1,204 3,845 1,000 2,739 550 2,900 3,000 3,000 Municipal Contributions 4,500 22,906 14,185 12,734 3,263 36,650 900 4,954 11,111 5,000 3,102 77 3,167 4,600 32,166 3,427 8,000 31,107 18,650 17,344 35,916 5,000 13,867 -
Revenues Investment Earnings 1,780 14,118 953 (171) 906 (1,323) (537) 29,765 (3,023) 1,287 (3,764) (2,909) (6,399) (3,235) 2,954 1,860 (377) (420) (5,546) (3,231) (41,702) (358) (562) (7,676) (14,036) (7,732) (15,962) 9,862 (5,385) (11,527) 65 645 154 650 2,130 110 1,411 98 90 -
All* Other Administration 2,400 20 10,846 26 486 168 3,322 8,091 2,577 2,315 5,891 1,680 1,251 1,932 2,442 1,556 2,130 1,130 9,954 2,655 525 5,060 3,325 7,075 1,198 3,195 4,625 8,274
Table 4-A Revenues and Expenditures for Lump-Sum Plans For the Year Ended December 31, 2011
36,800 41,900 11,000 13,246 144,997 14,800 37,456 30,975 22,600 6,050 27,295 23,075 206,541
Service Pensions
Expenditures
14,200 500 69,750 -
Other Benefits
86
Relief Association Iona Isanti Isle Jackson Jacobson Janesville Jasper Jeffers Jordan Kandiyohi Karlstad Kasota Kasson Keewatin Kelliher Kellogg Kennedy Kensington Kerrick Kettle River Kilkenny Kimball Kinney La Crescent La Salle Lafayette Lake Benton Lake Bronson Lake City Lake Crystal
State Aid 3,927 51,206 21,798 20,586 6,982 13,963 9,600 8,728 30,150 8,728 13,091 13,993 26,616 9,164 10,037 10,037 6,546 10,473 6,109 8,291 9,600 12,843 8,291 22,834 5,673 9,600 10,929 6,109 33,676 18,808
Supplemental Benefit Reimbursements 3,000 1,000 1,000 1,000 523 2,000 4,000 1,000 1,000 914 840 350 2,000 800 1,000 1,000 1,000 Municipal Contributions 59,976 5,000 409 24,256 4,360 3,529 42,350 7,017 8,500 26,928 21,569 2,473 4,000 300 5,031 3,436 7,000 5,000 5,484 4,000 1,000 28,690 31,380
Revenues Investment Earnings (1,340) (49,439) (19,990) 21,952 (3,134) 4,079 (2,683) (1,648) 9,337 7,497 1,503 (2,491) (20,015) (4,544) 5,166 (3,989) (1,430) 6,750 35 1,378 (3,132) 3,832 (2,048) 7,914 2,242 6,629 1,249 694 18,497 (9,817) 130 12,446 125 161 34 3,200 130 8,400 3,450 182 1,375 5,000 105 598 -
All* Other Administration 388 8,848 2,495 833 658 4,583 900 764 1,301 2,960 404 2,090 7,012 3,061 1,336 1,768 1,242 350 450 1,928 2,720 3,453 100 2,495 1,005 185 350 682 1,229
Table 4-A Revenues and Expenditures for Lump-Sum Plans For the Year Ended December 31, 2011
160,512 75,384 29,000 12,856 95,024 4,640 18,480 110,004 177,218 47,600 16,120 34,803 9,240 4,846 31,629 46,200 21,500 58,167
Service Pensions
Expenditures
26,700 -
Other Benefits
87
Relief Association Lake Elmo Lake Henry Lake Kabetogama Lake Lillian Lake Park Lake Wilson Lakefield Lakeville Lakewood Lamberton Lancaster Lanesboro Le Sueur Leaf Valley LeRoy Lester Prairie Lewiston Lewisville Lindstrom Linwood Lismore Litchfield Little Canada Little Falls Littlefork Long Lake Long Prairie Lonsdale Loretto Lower Saint Croix Valley
State Aid 37,692 6,677 8,291 6,546 14,118 7,418 14,754 213,067 10,910 8,728 8,291 9,600 25,249 8,291 10,473 13,091 18,252 7,855 26,290 18,049 10,037 40,001 37,917 52,420 11,346 74,962 23,461 31,514 21,915 31,250
Supplemental Benefit Reimbursements 2,978 758 2,000 1,000 1,000 3,000 2,000 720 2,000 1,000 1,000 3,000 1,000 Municipal Contributions 9,807 1,500 2,788 287 2,435 44,804 11,103 3,500 18,000 5,800 16,000 11,557 18,891 28,365 24,489 36,952 30,696 5,910 6,000 20,000 70,000 21,226
Revenues Investment Earnings 2,144 (3,525) 224 1,987 (6,863) 1,939 (10,963) (93,663) (1,410) (2,601) 2,120 (6,170) (25,914) (1,580) 3,578 (9,911) 2,864 4,353 (22,704) 12,881 1,362 (17,437) (66,195) (31,206) 1,645 (52,353) (5,909) (20,291) (32,400) (35,905) 6,846 40 304 2,000 932 1,222 311 30 491 4,290 120 500 -
All* Other Administration 8,952 669 610 2,841 871 3,089 10,531 500 610 831 685 2,097 283,857^ 3,035 3,456 6,375 2,869 1,995 5,645 4,850 5,859 1,138 950 7,963 793 9,610
Table 4-A Revenues and Expenditures for Lump-Sum Plans For the Year Ended December 31, 2011
21,125 20,200 86,000 213,384 38,283 43,000 51,000 133,000 44,396 41,365 135,400 -
Service Pensions
Expenditures Other Benefits -
88
Relief Association Lowry Lucan Luverne Lynd Mabel Madelia Madison Madison Lake Mahnomen Mahtowa Makinen Mantorville Maple Hill Maple Lake Maple Plain Mapleton Mapleview Maplewood Marble Marshall Mayer Maynard McDavitt McGrath McGregor McIntosh McKinley Meadowlands Medford Melrose
State Aid 10,037 9,600 23,110 6,546 8,728 13,327 10,910 10,473 10,910 6,982 9,130 7,418 32,881 16,861 13,109 152,528 8,291 59,026 10,473 10,037 7,855 8,728 27,034 7,418 4,800 5,673 10,910 20,040
Supplemental Benefit Reimbursements 1,000 1,000 2,855 1,000 1,000 300 660 1,000 1,000 6,000 2,000 1,000 1,000 3,756 247 857 1,000 Municipal Contributions 5,000 12,078 3,340 16,204 10,931 6,689 800 4,122 7,212 3,500 8,000 13,000 25,750 4,950 222,110 8,000 134,649 32,101 9,683 27,360 2,251 15,000 4,929
Revenues Investment Earnings (2,656) (340) (13,755) (1,657) 1,054 (4,921) 1,262 (10,078) (6,289) (1,830) 304 (2,525) 6,064 (8,034) 17,094 13,227 1,592 29,507 (3,705) (19,846) 11,309 (1,376) 1,106 1,877 (18,499) 1,205 954 3,362 (8,166) 11,560 (940) 95 355 10,000 3,000 105 155 102 80 -
All* Other Administration 952 1,470 755 2,390 450 165 450 90 621 4,348 2,640 3,950 17,556 4,512 5,475 2,390 3,481 36 2,824 672 74,543^ 840 6,335 1,687
Table 4-A Revenues and Expenditures for Lump-Sum Plans For the Year Ended December 31, 2011
12,700 41,000 36,956 29,976 63,300 18,065 3,300 17,848 312,101 27,071 36,872 20,663 65,816 3,205 9,425 665 1,781 25,000
Service Pensions
Expenditures
1,250 -
Other Benefits
89
Relief Association Menahga Middle River Miesville Milaca Milan Miltona Minneota Minnesota Lake Mission Montevideo Montgomery Monticello Montrose Moose Lake Mora Morgan Morris Morristown Morse-Fall Lake Morton Motley Mountain Iron Mountain Lake Nashwauk Nerstrand Nevis New Auburn New Brighton New Germany New London
State Aid 9,089 8,291 13,091 29,686 8,728 10,910 13,221 10,910 13,962 24,445 18,386 72,647 13,359 22,823 38,168 10,563 23,927 14,126 30,204 8,728 11,193 9,231 12,837 11,782 4,390 16,971 9,600 81,509 11,782 27,994
Supplemental Benefit Reimbursements 3,000 2,655 1,000 632 1,300 4,000 1,986 1,000 1,000 2,000 1,000 2,000 1,000 1,000 3,000 693 1,000 Municipal Contributions 2,000 3,495 8,617 3,474 2,000 10,594 6,767 17,034 42,000 12,074 17,340 23,484 2,400 6,734 18,505 10,800 4,130 17,358 6,250 16,007 46,200 7,500 8,400
Revenues Investment Earnings 16,469 2,544 (2,442) (12,938) 2,729 (2,885) (2,769) (939) 8,723 2,186 (15,354) (145) (1,856) (10,074) (4,371) (14,194) (17,207) 5,607 763 (4,150) (7,689) (7,368) 4,065 (5,915) 91 4,614 (3,413) 77,885 (3,068) 9,703 75 500 10,000 3,645 10 120 11,926 146 50 160 100 65 12,941 250
All* Other Administration 1,307 2,374 4,152 53 2,380 874 3,287 8,614 3,645 1,600 2,855 7,440 4,950 1,290 1,212 4,118 1,780 1,677 1,183 3,115 2,971 4,610 1,906 2,283 2,857 7,626 2,582
Table 4-A Revenues and Expenditures for Lump-Sum Plans For the Year Ended December 31, 2011
Service Pensions 82,200 10,120 11,500 42,295 6,950 8,081 168,339 33,892 80,500 51,047 92,133 25,000 56,488 12,293 39,000 97,700 8,471 79,625
Expenditures
11,640 -
Other Benefits
90
Relief Association New Munich New Prague New Richland New York Mills Newfolden Newport Nicollet Nisswa Normanna North Branch North Mankato North Saint Paul Northfield Northland Northome Norwood Young America Oak Grove Oakdale Odin Ogilvie Okabena Olivia Onamia Ormsby Oronoco Orr Ortonville Osakis Osseo Ostrander
State Aid 7,418 50,591 12,901 12,835 6,546 13,091 16,904 37,528 5,237 44,726 43,896 38,782 98,731 4,364 8,728 17,348 29,117 98,657 5,673 12,404 8,728 14,338 15,287 6,546 9,600 6,305 12,655 17,818 10,473 6,109
Supplemental Benefit Reimbursements 1,000 4,480 1,000 1,000 5,000 2,915 1,000 1,000 2,000 92 2,000 3,000 2,563 5,000 Municipal Contributions 2,500 60,739 1,609 7,329 71,816 5,000 10,000 92,525 32,686 55,207 77,374 5,000 38,700 61,275 16,850 16,681 11,055 4,563 3,177 49,879 6,267 1,086
Revenues Investment Earnings 105 (15,873) 3,040 4,371 603 (25,739) (5,644) (28,984) (604) (3,382) (35,363) 7,540 50,406 6,256 481 12,985 (29,583) (84,144) 2,679 421 4,909 (4,574) (500) 3,903 3,536 381 77 2,358 (14,209) 482 801 9,000 300 200 8,700 17 100 276 1,000 120 500 8,049 9,100 -
All* Other Administration 1,108 4,810 625 806 100 10,276 2 32,449^ 4,575 7,469 10,132 6,403 123 5,980 13,058 955 2,207 1,417 2,795 968 915 1,060 1,550 3,600 4,095 -
Table 4-A Revenues and Expenditures for Lump-Sum Plans For the Year Ended December 31, 2011
Service Pensions 10,967 80,300 98,280 19,700 21,349 27,325 183,000 279,567 120,612 69,000 157,875 10,901 14,200 88,105 70,350 27,459 62,195 83,600 -
Expenditures
12,800 46,800 -
Other Benefits
91
Relief Association Owatonna Palisade Palo Park Rapids Parkers Prairie Paynesville Pelican Rapids Pemberton Pennock Pequaywan Pequot Lakes Perham Pierz Pillager Pine Island Pine River Plato Porter Preston Princeton Prinsburg Prior Lake Proctor Randall Randolph Raymond Red Wing Redwood Falls Remer Renville
State Aid 102,837 8,414 10,910 56,804 10,910 24,838 39,294 7,418 8,789 6,109 34,540 26,815 29,829 23,510 31,519 16,930 11,346 10,473 11,536 41,436 8,728 140,411 15,080 10,910 15,976 9,600 69,531 25,994 13,355 10,910
Supplemental Benefit Reimbursements 2,000 3,000 2,000 1,000 960 1,420 1,000 309 1,000 1,000 6,000 1,000 4,780 Municipal Contributions 45,655 6,812 6,500 2,600 19,359 8,372 1,000 4,413 4,290 44,124 31,538 14,940 25,000 29,352 25,738 6,500 5,000 17,282 17,000 100,175 5,000 19,000 29,605 5,302 47,460 10,389 30,215
Revenues Investment Earnings (2,140) (2,371) (1,674) (11,659) (3,146) (38,584) (15,380) 2,444 5,704 946 16,737 (18,561) (14,510) (6,374) 7,428 7,250 (25,459) 4,013 (1,235) (43,041) 5,159 (2,645) (4,878) (759) 1,077 232 24,473 3,324 18,492 7,137 36 382 1,154 279 150 24 914 105 500 100 125 190 -
All* Other Administration 5,424 507 244,563^ 20 800 2,831 700 1,133 222,175^ 59,906^ 5,366 3,050 6,016 3,926 1,614 1,926 3,466 6,479 2,830 6,302 2,491 6,844 8,803 1,025 2,350
Table 4-A Revenues and Expenditures for Lump-Sum Plans For the Year Ended December 31, 2011
Service Pensions 233,771 92,458 125,000 52,185 27,928 417 10,454 29,176 76,000 58,865 15,500 51,783 148,626 20,200 283,988 -
Expenditures Other Benefits -
92
Relief Association Rice Rice Lake Richmond Rockford Rockville Rogers Rollingstone Rose Creek Roseau Rosemount Rothsay Royalton Rush City Ruthton Sabin-Elmwood Sacred Heart Saint Anthony Saint Augusta Saint Bonifacius Saint Charles Saint Clair Saint Francis Saint James Saint Joseph Saint Leo Saint Martin Saint Michael Saint Paul Park Saint Peter Saint Stephen
State Aid 14,549 13,381 17,249 21,857 11,000 58,829 9,600 9,164 23,949 85,718 10,738 9,600 23,228 7,855 9,164 10,910 31,574 12,937 27,719 20,053 15,212 23,308 22,261 34,452 10,473 10,473 59,000 18,414 41,596 15,048
Supplemental Benefit Reimbursements 1,000 2,450 2,882 1,000 920 1,000 1,000 2,000 1,000 4,000 1,000 1,000 2,000 3,000 1,000 1,000 4,000 1,000 3,299 1,000 2,000 2,000 Municipal Contributions 5,000 10,700 10,107 20,850 24,762 34,509 3,867 10,000 166,000 12,459 37,429 425 16,289 6,000 33,000 7,000 10,000 22,079 9,806 24,100 28,000 20,996 28,512 21,648
Revenues Investment Earnings (15,577) 22,993 (6,702) 4,223 (18,031) (17,516) 1,859 618 (3,252) 20,249 (8,508) (7,215) 1,309 2,801 5,719 1,496 (44,930) (361) (4,411) (27,785) 9,974 (17,372) (1,018) (14,692) 2,603 (33,701) (17,383) (9,131) (9,069) (9,041)
All* Other 230 100 125 19 208 250 4,000 215 100 25 2,200 Administration 2,150 4,700 2,845 8 2,325 623 9,362 2,492 3,504 1,426 431 1,450 1,960 7,300 5,562 2,765 768 3,465 6,988 3,424 125 2,090 1,554 5,952 4,521 1,973
Table 4-A Revenues and Expenditures for Lump-Sum Plans For the Year Ended December 31, 2011
Service Pensions 38,000 29,000 30,977 59,930 37,125 14,430 13,403 97,672 22,600 72,229 38,419 20,760 85,000 126,184 31,000 26,200 47,550 134,924 132,200 34,000 30,283 107,000 29,941
Expenditures Other Benefits -
93
Relief Association Sanborn Sandstone Sartell Sauk Centre Sauk Rapids Scandia Valley Schroeder Sebeka Sedan Shafer Shakopee Shelly Sherburn Shevlin Silica Silver Bay Silver Lake Slayton Sleepy Eye Solway Solway Rural South Haven Spicer Spring Grove Spring Valley Springfield Squaw Lake Stacy-Lent Area Staples Starbuck
State Aid 8,291 16,626 60,267 29,827 67,748 11,393 4,800 13,753 6,109 9,600 155,577 7,026 10,910 8,728 6,982 12,608 11,782 13,384 24,107 13,091 8,291 12,534 16,155 10,910 13,993 13,975 9,600 17,545 16,551 13,654
Supplemental Benefit Reimbursements 1,000 1,000 3,000 1,346 2,000 2,598 1,000 1,480 1,000 1,000 449 2,000 2,000 1,000 2,000 336 1,000 Municipal Contributions 2,000 17,453 7,800 17,071 12,000 16,549 1,867 2,000 3,709 351,976 4,108 7,097 10,000 5,000 19,534 25,057 9,662 1,646 11,344 20,512 10,769 11,791 30,586 9,999 10,295 7,184
Revenues Investment Earnings 2,235 608 4,792 20,646 (25,790) 5,458 586 12,287 76 2,664 27,766 (109) 10,584 (3,141) 2,873 (4,549) 4,507 2,840 87,716 9,998 (2,840) (7,377) (13,660) (782) (8,225) (6,279) 3,179 (24,566) (7,102) 315 20 110 100 3,216 7,484 2,100 125 5,475 1,540 3,000 -
All* Other Administration 1,000 2,014 1,515 5,689 50 238,577^ 525 1,472 1,035 1,051 8,742 1,460 1,803 10 2,665 550 2,058 1,702 622 934 3,680 5,645 1,802 3,267 13,473 1,975 8,647 3,360 1,160
Table 4-A Revenues and Expenditures for Lump-Sum Plans For the Year Ended December 31, 2011
Service Pensions 20,250 214,862 388 102,500 142,322 23,937 244,813 39,896 17,200 32,680 35,000 37,000 60,533 15,260 8,228 37,266 27,380 57,596 3,696 21,064 -
Expenditures
1,275 -
Other Benefits
94
Relief Association Stephen Stewart Stewartville Stillwater Storden Sturgeon Lake Sunburg Taconite Taunton Taylors Falls Thief River Falls Thomson Tofte Tower Tracy Trimont Truman Twin Lakes (City) Twin Lakes (VFD) Two Harbors Tyler Upsala Vadnais Heights Vergas Verndale Vernon Center Vesta Victoria Vining Wabasha
State Aid 12,655 10,473 34,436 106,348 9,600 6,109 8,291 6,109 6,109 10,910 39,922 17,430 5,084 8,291 14,724 9,600 10,910 7,462 6,109 34,202 8,902 7,418 51,454 13,605 10,473 8,728 7,418 37,498 6,546 16,611
Supplemental Benefit Reimbursements 1,000 2,000 3,000 3,000 2,000 1,268 1,000 1,000 2,000 1,000 2,000 1,000 2,000 Municipal Contributions 1,000 10,000 15,000 3,883 2,792 4,846 22,900 14,564 9,132 3,308 12,511 2,300 4,652 7,305 2,000 1,500 66,128 1,335 1,200 1,963 180 44,089 19,585
Revenues Investment Earnings 3,319 4,092 (21,701) (71,719) (4,472) 1,408 1,578 (2,326) 1,185 (17,613) 17,073 15,985 2,731 569 (691) 9,520 5,196 13,226 (829) 113 4,099 923 (7,186) (728) (5,230) 136 1,919 10,806 (1,944) 4,972 518 24 210 160 14 11 375 361 72 511 41 2,603 570 200 1,400
All* Other Administration 4,165 3,526 1,228 7,465 300 133,697^ 1,187 6,484 3,185 5,191 675 94,576^ 2,441 96 4,400 2,002 15 8,125 500 2,050 215 1,147 500 3,626
Table 4-A Revenues and Expenditures for Lump-Sum Plans For the Year Ended December 31, 2011
114,200 53,400 66,400 31,190 21,000 17,820 16,300 15,800 114,678 54,000 61,638 3,878 123,000
Service Pensions
Expenditures
42,452 -
Other Benefits
95
Relief Association Waconia Wadena Waite Park Waldorf Walker Walnut Grove Walters Warren Warroad Waseca Watertown Waterville Watkins Watson Waubun Waverly Welcome Wendell West Concord Westbrook Wheaton Willmar Willow River Wilmont Wilson Windom Winnebago Winsted Wolf Lake Wood Lake
State Aid 53,120 18,347 26,437 10,037 30,990 8,728 7,418 12,454 18,593 43,215 27,788 11,381 10,910 8,728 8,728 11,240 10,910 8,728 10,754 8,291 13,563 66,394 6,982 10,473 13,091 25,849 11,163 13,091 9,164 8,728
Supplemental Benefit Reimbursements 5,796 1,000 960 1,000 1,000 808 1,000 2,000 3,530 1,000 2,000 1,000 200 720 1,000 2,000 2,000 1,000 Municipal Contributions 15,459 900 5,000 4,193 18,498 1,000 472 50,370 21,996 5,616 7,664 4,211 13,200 6,000 8,118 1,250 12,464 24,463 2,680 9,502 5,000 4,000 18,398 1,896 552
Revenues Investment Earnings (6,954) (8,694) (2,532) (4,279) (7,689) 2,492 (490) (9,758) 7,564 24,569 (24,279) 15,343 (7,579) (4,918) 3,921 (585) 6,514 4,890 4,235 2,929 (23,895) (40,916) 2,393 671 114 (13,051) 690 (13,464) 4,872 (3,122) 4,500 1,100 (1,064) 5,200 3,995 (500) 2,812 5,100 3,735 19 25 -
All* Other Administration 6,993 4,850 1,175 425 1,890 2,430 4,308 825 3,830 426 3,200 12 220 1,950 1,105 813,957^ 404 4,128 2,714 300 9,643 12 794
Table 4-A Revenues and Expenditures for Lump-Sum Plans For the Year Ended December 31, 2011
Service Pensions 245,677 943 118,800 10,560 25,180 19,160 7,446 36,000 37,000 276 37,000 149,084 22,600 2,204 7,920 54,858 38,170 63,500 18,000
Expenditures Other Benefits -
96
Totals
State Aid 244,674 6,546 8,291 7,855 8,728 28,279 47,498 10,422 $ 11,632,926
Municipal Contributions 143,189 12,000 2,700 4,600 55,586 21,396 $ 7,567,939
Revenues Investment Earnings (70,407) 1,986 2,958 2,688 (6,281) 9,760 (486) 3,008 $ (1,798,216)
All* Other 10 100 1,200 3,993 256 205 $ 425,859 Administration 12,062 3,107 300 600 4,450 7,100 1,753 $ 1,396,274
Service Pensions 209,475 21,567 16,000 28,600 27,950 30,376 20,872 $ 18,768,338
Expenditures
8,050 $ 616,660
Other Benefits
^ Includes assets that were transferred to the Voluntary Statewide Lump-Sum Volunteer Firefighter Retirement Plan at the end of 2011. The relief associations joined the Plan on January 1, 2012. The transfer of assets was included as an administrative expense for reporting purposes.
* The All Other column includes, but is not limited to, donations, transfers, and other income.
Relief Association Woodbury Woodstock Wrenshall Wright Wykoff Wyoming Zimmerman Zumbro Falls
Supplemental Benefit Reimbursements 2,000 1,491 1,000 3,530 1,000 1,000 $ 525,654
Table 4-A Revenues and Expenditures for Lump-Sum Plans For the Year Ended December 31, 2011
97
Relief Association Alaska Andover Anoka-Champlin Ashby Austin Brewster Brooklyn Park Callaway Cloquet Area Fire District Cologne Columbia Heights Coon Rapids Crosslake Dakota Dalbo Dilworth Donnelly Eagan Edina Elbow Lake Elgin Ellsburg Embarrass Erskine Falcon Heights Fisher Fosston Fountain Freeport Fridley
State Aid $ 6,546 106,170 140,348 10,473 49,500 10,327 258,052 7,855 46,959 13,011 63,554 208,097 29,224 6,982 10,037 22,361 11,782 255,982 260,705 11,782 13,075 4,364 8,291 8,291 40,264 11,346 13,627 8,728 10,349 99,320
Supplemental Benefit Reimbursements $ 1,000 3,000 1,364 4,000 4,000 657 2,000 9,000 1,000 345 1,000 1,750 1,000 782 1,975 1,000 3,000 Municipal Contributions $ 50,000 10,920 5,585 26,181 9,200 16,521 1,050 484 8,251 405,546 9,000 4,780 2,750 1,000 5,223 -
Revenues Investment Earnings $ 2,183 (49,307) (86,402) 1,717 10,853 (750) 95,819 3,704 770 (13,313) 33,520 206,422 (17,377) 3,602 (10,535) (15,825) (5,967) (201,062) (55,656) 4,374 1,492 (1,834) (1,523) (3,137) (47,795) (1,004) 3,000 (85) 249 20,162 $
500 1,000 500 17 30 180 110 5,158 -
All* Other $
31,760 559,353 70,806 7,228 72,166 792,633 12,523 19,719 3,792 19,207 18,555 14,368 71,519 8,597 19,221 21,964 28,116 586,021
Service Pensions
Expenditures
Administration $ 350 8,681 13,085 1,647 6,482 2,440 15,885 19 1,239 7,744 40,302 4,850 500 34,628 35,120 50 3,333 70,072^ 142,228^ 995 6,300 7,743 4,478 700 3,285 6,000
Table 4-B Revenues and Expenditures for Defined-Contribution Plans For the Year Ended December 31, 2011
Other Benefits $ 8,182 5,397 1,000 992 -
98
Relief Association Gary Gibbon Glenville Goodhue Gunflint Trail Hardwick Hawley Ivanhoe Kelsey Kenyon Kerkhoven Kiester Lake George Lakeport Le Center London Longville Lyle Magnolia Maple Grove Marietta Marine-On-Saint Croix Mazeppa Medicine Lake Mendota Heights Mentor Millerville Milroy Murdock Myrtle
State Aid 6,982 10,910 11,782 24,210 10,473 7,855 15,045 11,782 6,982 17,694 9,600 9,164 7,418 11,233 15,320 6,109 26,320 7,855 5,237 264,226 8,291 10,473 10,473 8,291 63,267 4,800 7,418 6,546 6,982 10,910
Supplemental Benefit Reimbursements 2,825 1,000 1,464 574 3,862 2,000 1,451 1,000 9,000 1,000 1,000 3,000 1,000 1,000 Municipal Contributions 2,500 10,000 7,700 4,000 4,000 1,370 8,000 11,408 6,408 25,000 207,442 13,000 2,202 21,000 60,106 14,000 2,865 -
Revenues Investment Earnings 698 737 (1,130) (16,453) 3,209 1,086 (7,771) (2,454) (688) (74,543) 8,213 (1,146) (5,860) (2,611) 2,733 (3,859) 4,292 315 1,397 41,158 856 (6,883) (256) (7,882) (50,543) (3,686) (2,087) 77 3,086 5,116 750 495 195 100 92 6 1,222 156 -
All* Other
27,378 60,868 16,100 6,169 6,312 107,496 39,323 27,500 2,865 28,603 1,307,132 17,623 20,111 179,711 13,506 22,790 -
Service Pensions
Expenditures
Administration 205 1,293 176 2,400 105,607^ 15 2,175 819 2,500 161 1,216 2,136 950 2,025 1,300 1,000 9,350 2,095 2,300 2,310 3,068 680 565 850
Table 4-B Revenues and Expenditures for Defined-Contribution Plans For the Year Ended December 31, 2011
Other Benefits 10,950 -
99
Relief Association Nassau Nodine Northrop Odessa Oklee Plainview Plummer Ramsey Red Lake Falls Round Lake Rushford Rushmore Saint Hilaire Seaforth South Bend Swanville Toivola Ulen Underwood Vermilion Lake Viking Wabasso Wanamingo Wanda Wayzata Wells West Metro Williams Winthrop
State Aid 8,728 7,418 6,546 5,673 7,855 20,939 10,473 99,928 8,376 8,291 18,638 9,164 8,291 6,109 8,291 7,919 10,037 9,600 15,004 6,982 9,600 13,709 8,728 44,294 13,984 141,983 8,728 10,131
Supplemental Benefit Reimbursements 524 1,000 410 1,000 6,092 487 1,628 1,963 696 2,000 3,000 2,000 5,818 Municipal Contributions 1,400 1,200 6,600 16,708 3,000 2,250 18,089 4,500 300 500 1,300 45,000 6,250 287,270 13,794
Revenues Investment Earnings (1,528) (4,525) 1,560 (33) 676 (5,057) (2,799) (16,229) 3,609 (8,651) (637) (884) 1,734 1,336 (27,640) (4,650) 13,408 2,779 2,600 5,445 (514) (18,248) 1,935 25,633 (11,831) (285,668) 3,456 (1,066) 18 20,000 3,187 -
All* Other
5,762 4,509 18,020 23,543 65,249 536 11,067 35,074 696 39,248 37,540 54,655 447,949 -
Service Pensions
Expenditures
Administration 230 500 1,741 18 362 1,900 2,697 625 569 1,100 636 225 152 895 9,400 -
Table 4-B Revenues and Expenditures for Defined-Contribution Plans For the Year Ended December 31, 2011
Other Benefits -
100
Totals
State Aid 17,449 $ 2,923,918
Municipal Contributions 17,083 $ 1,382,736
Revenues Investment Earnings (13,279) $ (577,652)
All* Other 203 $ 33,919 Administration 2,896 $ 269,391
$ 4,984,883
Service Pensions
Expenditures Other Benefits $ 26,521
^ Includes assets that were transferred to the Voluntary Statewide Lump-Sum Volunteer Firefighter Retirement Plan at the end of 2011. These relief associations joined the Plan on January 1, 2012. The transfer of assets was included as an administrative expense for reporting purposes.
* The All Other column includes, but is not limited to, donations, transfers, and other income.
Relief Association Zumbrota
Supplemental Benefit Reimbursements $ 93,667
Table 4-B Revenues and Expenditures for Defined-Contribution Plans For the Year Ended December 31, 2011
101
Totals
State Aid $ 179,993 12,110 21,484 93,119 108,971 94,569 286,728 50,733 26,371 66,853 185,168 238,853 74,362 55,468 38,899 20,378 304,862 50,427 145,733 101,421 275,312 153,370 39,978 $ 2,625,162
Municipal Contributions $ 300,257 9,771 39,204 52,331 205,361 830,077 85,293 68,795 100,455 83,324 198,026 141,625 98,672 18,000 36,922 165,361 207,651 184,514 270,750 37,300 $ 3,133,689
Revenues Investment Earnings $ (116,287) (7,584) 6,350 (144,398) (51,478) (1,433) (320,272) 8,011 (3,871) (5,748) (79,505) (66,892) (100,606) 14,712 (14,497) (4,697) (7,969) 1,188 95,306 (46,379) 101,586 (163,409) (32,197) $ (940,069)
* The All Other column includes, but is not limited to, donations, transfers, and other income.
Relief Association Apple Valley Appleton Benson Brooklyn Center Chanhassen Chaska Eden Prairie Fairmont Glencoe Hutchinson Lake Johanna Minnetonka Mound New Ulm Pine City Pipestone Plymouth Robbinsdale Roseville Savage Spring Lake Park White Bear Lake Worthington
Supplemental Benefit Reimbursements $ 2,000 5,000 1,000 2,000 4,000 4,000 2,000 2,000 3,500 1,000 2,000 2,000 1,000 2,000 1,000 $ 34,500 328 292 568 15,000 20 442 200 200 $ 17,050
$
All* Other
Service Pensions $ 394,779 91,928 46,480 120,015 409,821 272,079 890,856 85,390 39,976 149,027 424,651 502,081 243,252 220,929 56,000 69,895 209,213 209,465 510,608 277,650 454,339 233,121 114,740 $ 6,026,295
Expenditures
Administration $ 34,216 2,615 5,783 12,680 9,470 4,760 32,156 10,404 13,355 15,167 16,944 28,848 15,475 17,616 8,130 1,610 31,704 18,442 21,270 14,421 21,877 25,795 410 $ 363,148
Table 4-C Revenues and Expenditures for Other Plan Types For the Year Ended December 31, 2011
Other Benefits $ 63,100 50 $ 63,150
This page is intentionally left blank.
How to Read Tables 5-A Through 5-C
Tables 5-A, 5-B, and 5-C provide information regarding relief association membership and bylaw provisions in effect at the end of 2011. Active Members – Active members in the relief association as of December 31, 2011. Lump-Sum – Retirees who received a lump-sum pension during 2011. Survivor – Survivor benefits paid during 2011. Disability – Disability benefits paid during 2011. Monthly – Retirees or beneficiaries receiving a monthly pension during 2011 (for “Other Plan Types” only). Deferred Members – Members no longer active in the fire department or relief association who are entitled to, but have yet to receive, a service pension. Minimum Retirement Age – The minimum age at which a member may receive a service pension distribution. State law requires that members be at least age 50 to receive payment of their service pension. Active Service – The minimum years a member must serve with the affiliated fire department before becoming eligible for a service pension. Active Membership – The minimum years a member must be a member of the relief association before becoming eligible for a service pension. Treasurer – The amount of the treasurer’s faithful performance bond. By law, it must be 10 percent of assets, although the amount of the bond need not exceed $500,000. Secretary – The amount of the secretary’s faithful performance bond, if applicable. State law does not require that the secretary be bonded.
103
This page is intentionally left blank.
105
Relief Association Ada Adams Adrian Aitkin Albany Albert Lea Township Albertville Almelund Alpha Altura Amboy Annandale Argyle Arlington Arrowhead Askov Atwater Audubon Aurora Avon Babbitt Backus Badger Bagley Balaton Baldwin Balsam Barnesville Barnum Barrett
Active Members 34 24 25 29 24 15 30 32 17 23 21 27 25 28 12 18 27 23 23 25 29 16 18 24 25 26 27 26 24 14
Number of Members Retired LumpSum Survivor Disability 1 1 1 1 1 2 1 1 1 1 2 3 1 4 1 1 1 3 2 2 1 1 Deferred Members 1 3 1 1 1 4 8 4 3 1 17 2 7 5 2 10 4 3 4 3 4 6 2 3 1 3 6
Minimum Retirement Age 50 50 50 50 50 50 50 50 50 50 50 50 50 50 50 55 50 50 50 50 50 50 50 50 50 50 50 50 50 50 Active Service 10 10 10 10 5 10 10 10 10 10 10 5 10 10 5 10 10 5 10 10 5 10 10 10 10 5 10 10 10 10
Active Membership 10 10 10 10 5 10 10 10 10 10 10 5 10 10 5 10 10 5 10 10 5 10 10 10 10 5 10 10 10 10
Minimum Years
Table 5-A Membership and Bylaw Provisions for Lump-Sum Plans For the Year Ended December 31, 2011
Treasurer $ 250,000 250,000 250,000 200,000 50,000 30,000 60,000 50,000 25,000 20,000 50,000 80,000 150,000 45,000 10,000 250,000 30,000 50,000 500,000 40,000 250,000 50,000 50,000 100,000 130,000 100,000 50,000 40,000 250,000 15,000
Secretary $ 200,000 250,000 50,000 250,000 -
Performance Bond
106
Relief Association Battle Lake Baudette Bayport Beardsley Beaver Bay Beaver Creek Becker Belgrade Belle Plaine Bellingham Belview Bemidji Bertha Bethel Big Lake Bigelow Bigfork Bird Island Biwabik City Blackduck Blackhoof Blooming Prairie Blue Earth Bluffton Bovey Bowlus Boyd Braham Brainerd Brandon
Active Members 20 23 23 20 12 18 28 25 30 20 22 40 16 13 33 24 17 24 17 22 23 28 26 15 13 23 23 19 37 17
Number of Members Retired LumpSum Survivor Disability 1 1 2 2 3 3 2 1 1 1 6 6 2 1 1 4 1 2 Deferred Members 1 7 3 5 3 8 1 5 3 5 4 2 12 2 2 4 5 3 3 12 4 4 11 6 3
Minimum Retirement Age 50 50 50 50 50 50 50 50 50 50 50 50 50 50 50 50 50 50 50 50 50 50 50 50 50 50 50 50 50 50 Active Service 10 5 10 10 5 10 10 10 10 10 10 10 10 10 5 5 10 10 5 10 10 10 5 20 10 20 10 5 10 5
Active Membership 10 5 10 10 5 10 10 10 10 10 10 10 10 10 5 5 10 10 5 10 10 10 5 10 10 20 10 5 10 5
Minimum Years
Table 5-A Membership and Bylaw Provisions for Lump-Sum Plans For the Year Ended December 31, 2011
Treasurer 200,000 250,000 500,000 20,000 250,000 20,000 100,000 50,000 100,000 50,000 50,000 250,000 50,000 50,000 100,000 50,000 50,000 30,000 50,000 40,000 15,000 100,000 100,000 15,000 25,000 200,000 20,000 35,000 500,000 30,000
Secretary 200,000 50,000 50,000 50,000 15,000 -
Performance Bond
107
Relief Association Breckenridge Breitung Brevator Bricelyn Brimson Brook Park Brooten Browerville Browns Valley Brownsdale Brownsville Brownton Buffalo Buffalo Lake Buhl Butterfield Byron Caledonia Calumet Cambridge Campbell Canby Cannon Falls Canosia Canton Carlos Carlton Carsonville Carver Cass Lake
Active Members 27 22 14 21 11 15 24 21 17 21 16 29 29 21 17 22 30 31 13 25 20 24 30 19 20 26 15 24 32 20
Number of Members Retired LumpSum Survivor Disability 1 1 2 1 2 3 2 3 2 8 3 1 1 1 4 3 2 Deferred Members 2 3 2 3 2 8 1 3 1 2 8 1 4 5 2 3 2 3 6 5 2 2 2 12 1
Minimum Retirement Age 50 50 50 55 50 50 50 50 50 50 55 50 50 50 50 50 50 50 50 50 50 50 50 50 50 50 50 50 50 50 Active Service 10 10 5 10 5 5 10 10 20 10 5 10 10 5 10 5 10 10 10 10 20 10 10 10 15 10 10 10 5 10
Active Membership 10 10 5 10 5 5 10 10 10 10 5 10 10 5 10 5 10 10 10 10 10 10 10 10 10 10 10 10 5 10
Minimum Years
Table 5-A Membership and Bylaw Provisions for Lump-Sum Plans For the Year Ended December 31, 2011
Treasurer 50,000 30,000 15,000 25,000 15,000 20,000 30,000 30,000 25,000 30,000 20,000 40,000 500,000 40,000 150,000 20,000 125,000 200,000 50,000 400,000 25,000 50,000 100,000 300,000 20,000 1,000,000 30,000 10,000 50,000 50,000
15,000 15,000 125,000 400,000 50,000 20,000 -
Secretary
Performance Bond
108
Relief Association Centennial Center City Ceylon Chandler Chatfield Cherry Chisago Chisholm Chokio Clara City Claremont Clarissa Clarkfield Clarks Grove Clear Lake Clearbrook Clearwater Clements Cleveland Clifton Climax Clinton (Big Stone) Cohasset Cokato Cold Spring Coleraine Colvill Colvin Comfrey Cook
Active Members 40 24 17 15 24 15 22 22 20 20 14 19 27 21 28 21 29 19 27 17 28 23 22 24 28 14 12 10 23 16
Number of Members Retired LumpSum Survivor Disability 5 3 2 1 1 1 1 1 3 2 1 1 1 1 1 1 1 1 Deferred Members 22 4 2 1 2 4 7 5 2 2 1 6 6 6 3 6 3 2 10 6 8 12 3 3 4 1
Minimum Retirement Age 50 50 50 50 50 50 50 50 50 50 50 50 50 50 50 50 50 50 50 50 50 50 50 50 50 50 50 50 50 50 Active Service 10 10 10 10 5 5 5 10 10 5 10 10 10 10 10 10 10 10 10 5 10 10 10 5 5 5 5 5 5 20
Active Membership 10 10 10 10 5 5 5 10 10 5 10 10 10 10 10 10 10 10 5 5 10 10 10 5 5 5 5 5 5 20
Minimum Years
Table 5-A Membership and Bylaw Provisions for Lump-Sum Plans For the Year Ended December 31, 2011
Treasurer 300,000 40,000 250,000 30,000 40,000 100,000 75,000 250,000 20,000 40,000 100,000 20,000 250,000 30,000 165,000 40,000 35,000 100,000 50,000 35,000 250,000 12,000 500,000 75,000 100,000 20,000 100,000 10,000 200,000 45,000
30,000 250,000 35,000 75,000 20,000 -
Secretary
Performance Bond
109
Relief Association Cosmos Cottage Grove Cotton Cottonwood Courtland Cromwell Crooked Lake Crookston Crosby Culver Currie Cuyuna Cyrus Dalton Danube Danvers Darfur Dassel Dawson Dayton Deer Creek Deer River Deerwood Delano Delavan Dent Detroit Lakes Dexter Dodge Center Dover
Active Members 14 50 18 26 21 22 16 26 26 9 17 20 19 24 25 11 18 26 25 29 17 20 20 28 18 24 29 19 22 20
Number of Members Retired LumpSum Survivor Disability 4 1 1 1 2 3 1 1 2 1 3 1 2 1 1 1 3 Deferred Members 9 21 1 5 6 1 4 5 2 2 2 2 5 2 9 6 2 2 5 3 5 3 5 8 3 1
Minimum Retirement Age 50 50 50 55 50 50 50 55 50 50 50 50 50 50 50 50 50 50 50 50 50 50 50 50 50 50 50 50 50 50 Active Service 5 5 5 10 10 20 5 10 5 10 10 10 10 10 10 10 10 5 10 5 10 10 10 10 5 10 5 10 10 10
Active Membership 5 5 5 10 10 10 5 10 5 10 10 10 10 10 10 10 10 5 10 5 10 10 10 10 5 10 5 10 10 10
Minimum Years
Table 5-A Membership and Bylaw Provisions for Lump-Sum Plans For the Year Ended December 31, 2011
Treasurer 25,000 500,000 170,000 35,000 30,000 50,000 20,000 75,000 50,000 5,000 50,000 20,000 15,000 25,000 30,000 15,000 20,000 100,000 200,000 500,000 20,000 50,000 100,000 1,000,000 30,000 150,000 250,000 20,000 500,000 25,000
50,000 50,000 200,000 1,000,000 500,000 -
Secretary
Performance Bond
110
Relief Association Dovray Dumont Dunnell Eagle Bend Eagle Lake East Bethel East Grand Forks Eastern Hubbard Easton Echo Eden Valley Edgerton Eitzen Elizabeth Elk River Elko New Market Ellendale Ellsworth Elmer Elmore Elrosa Ely Elysian Emily Evansville Eveleth Excelsior Eyota Fairfax Farmington
Active Members 22 22 16 20 19 34 27 21 26 18 25 22 27 21 38 25 19 25 11 15 23 27 26 24 23 20 46 25 21 45
Number of Members Retired LumpSum Survivor Disability 1 1 2 1 1 3 3 2 1 1 1 1 2 1 1 2 Deferred Members 3 1 1 4 5 2 3 3 3 1 2 3 1 3 2 7 4 1 2 7 1 1 2 1 5 9 9 8
Minimum Retirement Age 50 50 50 50 50 50 50 55 50 50 50 50 50 50 50 50 50 55 60 50 55 50 50 50 50 50 50 50 50 50 Active Service 5 10 10 10 10 10 10 10 10 10 10 10 10 10 5 10 5 10 5 10 5 10 10 10 10 5 10 10 5 10
Active Membership 5 10 10 10 10 10 10 10 10 10 10 10 10 10 5 10 5 10 5 10 5 10 10 10 10 5 10 10 5 10
Minimum Years
Table 5-A Membership and Bylaw Provisions for Lump-Sum Plans For the Year Ended December 31, 2011
Treasurer 5,000 13,000 100,000 30,000 40,000 250,000 500,000 50,000 20,000 20,000 100,000 40,000 20,000 30,000 500,000 400,000 125,000 26,000 14,000 60,000 30,000 500,000 100,000 200,000 20,000 50,000 500,000 100,000 450,000 1,000,000
40,000 500,000 500,000 400,000 500,000 -
Secretary
Performance Bond
111
Relief Association Fayal Federal Dam Fergus Falls Fertile Fifty Lakes Finland Finlayson Flensburg Floodwood Foley Forada Forest Lake Foreston Franklin Frazee Fredenberg French Township Frost Fulda Garfield Garrison Garvin Gaylord Geneva Ghent Gilbert Glenwood Glyndon Gnesen Golden Valley
Active Members 23 8 39 25 17 22 21 22 22 23 24 34 15 19 25 14 27 18 21 24 23 12 25 22 22 21 28 23 27 48
Number of Members Retired LumpSum Survivor Disability 1 1 1 3 1 1 1 1 1 1 2 1 1 1 1 2 2 3 10 Deferred Members 1 5 13 7 7 4 3 5 3 13 5 5 3 1 2 9 6 2 3 5 1 2 1 7 2 4
Minimum Retirement Age 50 50 50 50 50 50 50 50 50 50 50 50 50 50 50 50 50 50 50 50 50 50 50 55 50 50 50 50 50 50 Active Service 10 10 10 10 5 10 10 10 5 10 10 10 5 10 5 10 10 10 10 5 10 5 10 10 10 5 10 10 10 10
Active Membership 10 10 10 10 5 10 10 10 5 10 10 10 5 10 5 10 10 10 10 5 10 5 10 10 10 5 10 10 10 10
Minimum Years
Table 5-A Membership and Bylaw Provisions for Lump-Sum Plans For the Year Ended December 31, 2011
Treasurer 250,000 10,000 250,000 35,000 100,000 30,000 250,000 40,000 125,000 100,000 250,000 200,000 250,000 30,000 40,000 40,000 15,000 50,000 50,000 350,000 500,000 25,000 100,000 20,000 20,000 35,000 44,000 35,000 50,000 500,000
Secretary 250,000 10,000 125,000 250,000 40,000 15,000 350,000 100,000 500,000
Performance Bond
112
Relief Association Gonvick Good Thunder Goodland Goodview Graceville Granada Grand Lake Grand Meadow Grand Rapids Granite Falls Green Isle Greenbush Greenwood Grey Eagle Grove City Grygla Hackensack Hallock Halstad Ham Lake Hamburg Hamel Hancock Hanley Falls Hanska Harmony Harris Hartland Hastings Hayfield
Active Members 19 23 16 31 25 13 27 25 31 31 20 33 14 18 18 19 31 28 25 30 28 26 24 24 27 27 18 17 46 21
Number of Members Retired LumpSum Survivor Disability 1 2 3 2 4 2 1 1 1 4 1 3 3 4 2 3 4 1 1 4 1 Deferred Members 5 8 6 4 2 2 5 5 4 5 4 3 4 2 1 6 10 3 9 2 3 2 3 2 2 11 6
Minimum Retirement Age 50 50 50 50 50 50 50 50 50 50 50 50 50 50 50 50 50 50 55 50 50 50 50 50 50 50 50 50 50 50 Active Service 10 5 5 8 10 10 10 10 10 10 10 10 5 5 10 10 10 10 10 5 10 10 10 10 10 10 10 10 5 10
Active Membership 10 5 5 8 10 10 10 10 10 10 10 5 5 5 10 10 10 10 10 5 10 10 10 10 10 10 10 10 5 10
Minimum Years
Table 5-A Membership and Bylaw Provisions for Lump-Sum Plans For the Year Ended December 31, 2011
Treasurer 250,000 40,000 100,000 50,000 20,000 50,000 1,000,000 250,000 500,000 160,000 100,000 500,000 50,000 30,000 25,000 20,000 50,000 100,000 25,000 150,000 70,000 150,000 100,000 25,000 200,000 50,000 50,000 100,000 500,000 50,000
50,000 1,000,000 250,000 160,000 150,000 50,000 -
Secretary
Performance Bond
113
Relief Association Hayward Hector Henderson Hendricks Hendrum Henning Herman Hermantown Heron Lake Hewitt Hibbing Hill City Hills Hinckley Hitterdal Hoffman Hokah Holdingford Holland Hollandale Hopkins Houston Hovland Area Howard Lake Hoyt Lakes Hugo Ideal Industrial International Falls Inver Grove Heights
Active Members 23 24 25 29 21 25 21 25 16 15 16 23 20 21 19 22 24 28 21 17 33 25 13 27 19 28 30 15 26 60
Number of Members Retired LumpSum Survivor Disability 1 2 1 2 4 1 3 1 2 1 1 1 1 1 3 Deferred Members 1 4 4 7 3 3 1 3 2 2 7 7 1 2 4 1 5 6 17 3 1 2 6 7 4 3 8 13
Minimum Retirement Age 50 50 50 50 50 50 50 50 55 50 50 50 50 50 50 50 50 50 50 50 50 50 50 50 50 50 50 50 50 50 Active Service 10 10 10 5 10 5 10 10 10 10 5 5 10 10 10 10 10 10 10 10 5 10 10 10 5 10 10 5 5 10
Active Membership 10 10 10 5 10 5 10 10 10 10 5 5 10 10 10 10 10 10 10 10 5 10 10 10 5 10 10 5 5 10
Minimum Years
Table 5-A Membership and Bylaw Provisions for Lump-Sum Plans For the Year Ended December 31, 2011
Treasurer 50,000 50,000 200,000 20,000 25,000 30,000 15,000 150,000 20,000 25,000 250,000 100,000 15,000 100,000 20,000 25,000 150,000 50,000 50,000 50,000 300,000 30,000 15,000 100,000 500,000 100,000 60,000 30,000 745,000 400,000
25,000 150,000 25,000 150,000 300,000 15,000 100,000 400,000
Secretary
Performance Bond
114
Relief Association Iona Isanti Isle Jackson Jacobson Janesville Jasper Jeffers Jordan Kandiyohi Karlstad Kasota Kasson Keewatin Kelliher Kellogg Kennedy Kensington Kerrick Kettle River Kilkenny Kimball Kinney La Crescent La Salle Lafayette Lake Benton Lake Bronson Lake City Lake Crystal
Active Members 16 20 24 27 25 26 24 22 39 18 31 22 20 18 20 29 13 25 20 17 20 27 16 27 15 28 19 19 20 23
Number of Members Retired LumpSum Survivor Disability 3 2 1 1 2 2 1 2 2 5 1 1 2 1 1 2 5 1 1 Deferred Members 10 2 12 2 1 3 1 3 4 1 1 3 2 4 4 1 1 2 4 1 1 1 5 3
Minimum Retirement Age 50 50 50 50 50 50 50 50 50 50 50 50 50 50 50 50 50 50 55 50 50 50 50 50 50 50 50 50 50 50 Active Service 20 10 10 10 5 10 10 15 10 5 10 10 10 10 10 10 10 10 10 5 10 10 10 5 10 10 10 10 10 10
Active Membership 10 10 10 10 5 10 10 10 10 5 10 10 10 10 10 10 10 10 10 5 10 10 10 5 10 10 10 10 10 10
Minimum Years
Table 5-A Membership and Bylaw Provisions for Lump-Sum Plans For the Year Ended December 31, 2011
Treasurer 10,000 1,500,000 50,000 100,000 25,000 60,000 100,000 20,000 500,000 30,000 20,000 50,000 75,000 40,000 50,000 40,000 100,000 250,000 125,000 30,000 60,000 30,000 25,000 100,000 50,000 40,000 300,000 10,000 250,000 50,000
25,000 20,000 125,000 30,000 300,000 -
Secretary
Performance Bond
115
Relief Association Lake Elmo Lake Henry Lake Kabetogama Lake Lillian Lake Park Lake Wilson Lakefield Lakeville Lakewood Lamberton Lancaster Lanesboro Le Sueur Leaf Valley LeRoy Lester Prairie Lewiston Lewisville Lindstrom Linwood Lismore Litchfield Little Canada Little Falls Littlefork Long Lake Long Prairie Lonsdale Loretto Lower Saint Croix Valley
Active Members 23 22 12 15 21 21 24 85 22 19 24 22 23 16 24 30 32 17 26 28 28 28 33 34 26 41 22 26 27 26
Number of Members Retired LumpSum Survivor Disability 1 1 3 2 1 1 1 3 1 2 1 Deferred Members 6 3 2 2 24 3 1 8 3 2 3 2 2 2 8 1 1 2 2 2 5 10 2 3 7 5
Minimum Retirement Age 50 50 50 50 50 50 50 50 50 50 55 50 50 50 50 50 50 50 50 50 50 50 50 50 50 50 50 50 50 50 Active Service 10 10 5 10 10 10 10 7 20 10 10 10 10 5 10 15 5 10 5 10 10 10 10 10 7 10 5 10 10 10
Active Membership 10 10 5 10 10 10 10 7 20 10 10 10 10 5 10 15 5 10 5 10 10 10 10 10 7 10 5 10 10 5
Minimum Years
Table 5-A Membership and Bylaw Provisions for Lump-Sum Plans For the Year Ended December 31, 2011
Treasurer 500,000 150,000 20,000 50,000 50,000 20,000 100,000 500,000 50,000 25,000 20,000 30,000 100,000 35,000 50,000 35,000 500,000 50,000 80,000 55,000 30,000 70,000 190,000 101,702 250,000 500,000 100,000 60,000 200,000 250,000
500,000 100,000 50,000 500,000 50,000 55,000 250,000 100,000 200,000 -
Secretary
Performance Bond
116
Relief Association Lowry Lucan Luverne Lynd Mabel Madelia Madison Madison Lake Mahnomen Mahtowa Makinen Mantorville Maple Hill Maple Lake Maple Plain Mapleton Mapleview Maplewood Marble Marshall Mayer Maynard McDavitt McGrath McGregor McIntosh McKinley Meadowlands Medford Melrose
Active Members 24 23 33 11 20 26 26 24 25 22 13 30 12 30 25 23 12 41 13 44 27 22 17 16 24 20 15 10 27 25
Number of Members Retired LumpSum Survivor Disability 1 1 1 3 4 2 1 1 1 6 2 1 1 4 1 1 1 1 1 Deferred Members 3 1 5 1 7 3 2 1 7 6 2 4 40 12 3 4 1 2 5 4 1 3 9
Minimum Retirement Age 50 50 50 50 50 50 50 50 50 50 50 50 50 50 50 50 50 50 50 50 50 50 50 50 50 50 50 50 50 50 Active Service 10 10 10 10 10 10 10 5 10 5 10 10 5 10 10 10 20 10 10 5 10 10 10 5 10 10 10 5 10 10
Active Membership 10 10 10 5 10 10 10 5 10 5 10 10 5 10 10 10 10 10 10 5 10 10 10 5 10 10 10 5 10 10
Minimum Years
Table 5-A Membership and Bylaw Provisions for Lump-Sum Plans For the Year Ended December 31, 2011
Treasurer 40,000 50,000 125,000 50,000 15,000 250,000 50,000 50,000 350,000 12,500 30,000 30,000 20,000 150,000 250,000 250,000 25,000 500,000 30,000 500,000 50,000 75,000 75,000 25,000 50,000 200,000 10,000 50,000 30,000 250,000
50,000 250,000 50,000 30,000 20,000 150,000 20,000 30,000 500,000 75,000 75,000 -
Secretary
Performance Bond
117
Relief Association Menahga Middle River Miesville Milaca Milan Miltona Minneota Minnesota Lake Mission Montevideo Montgomery Monticello Montrose Moose Lake Mora Morgan Morris Morristown Morse-Fall Lake Morton Motley Mountain Iron Mountain Lake Nashwauk Nerstrand Nevis New Auburn New Brighton New Germany New London
Active Members 20 23 33 20 20 22 29 23 19 28 30 26 27 26 28 20 27 23 22 20 17 17 25 26 17 17 18 40 22 24
Number of Members Retired LumpSum Survivor Disability 3 1 1 3 1 1 2 4 2 1 2 2 1 2 1 1 3 1 2 Deferred Members 6 5 5 5 1 1 3 9 2 2 6 4 5 9 4 1 6 1 3 2 2 3 9 3 -
Minimum Retirement Age 55 50 50 50 55 50 50 50 50 50 50 50 55 50 50 50 50 50 65 50 50 50 50 50 50 50 50 50 50 50 Active Service 10 10 10 5 10 10 10 5 5 10 10 10 10 10 10 10 15 10 10 10 10 10 10 10 5 10 5 10 10 10
Active Membership 10 10 10 5 10 10 10 5 5 10 10 10 10 10 10 9 15 10 10 10 10 10 10 10 5 10 5 10 10 10
Minimum Years
Table 5-A Membership and Bylaw Provisions for Lump-Sum Plans For the Year Ended December 31, 2011
Treasurer 100,000 19,000 50,000 75,000 30,000 100,000 250,000 50,000 30,000 500,000 50,000 110,000 60,000 50,000 100,000 250,000 250,000 50,000 50,000 50,000 35,000 45,000 100,000 50,000 50,000 40,000 100,000 1,000,000 85,000 250,000
250,000 30,000 500,000 50,000 5,000 -
Secretary
Performance Bond
118
Relief Association New Munich New Prague New Richland New York Mills Newfolden Newport Nicollet Nisswa Normanna North Branch North Mankato North Saint Paul Northfield Northland Northome Norwood Young America Oak Grove Oakdale Odin Ogilvie Okabena Olivia Onamia Ormsby Oronoco Orr Ortonville Osakis Osseo Ostrander
Active Members 19 30 22 19 15 26 24 24 9 25 35 39 31 11 18 31 32 42 14 25 17 24 20 19 22 14 30 20 29 9
Number of Members Retired LumpSum Survivor Disability 2 1 5 1 1 1 3 5 3 1 1 3 1 2 3 1 2 3 2 1 Deferred Members 4 1 3 1 9 2 6 13 6 2 2 2 5 12 11 1 2 3 5 3 3 1 3 1 4 2
Minimum Retirement Age 50 50 50 50 50 50 50 50 50 50 50 50 50 50 50 50 50 50 50 50 55 50 50 50 50 50 50 50 50 50 Active Service 10 10 10 10 10 10 5 10 20 10 5 10 5 5 10 10 5 10 10 10 5 10 10 10 10 10 10 10 10 10
Active Membership 10 10 10 10 10 10 5 10 20 10 5 10 5 5 10 10 5 10 10 10 5 10 10 10 10 10 10 10 10 10
Minimum Years
Table 5-A Membership and Bylaw Provisions for Lump-Sum Plans For the Year Ended December 31, 2011
Treasurer 15,000 70,000 250,000 20,000 20,000 100,000 30,000 300,000 10,000 100,000 200,000 150,000 500,000 10,000 20,000 200,000 300,000 250,000 15,000 30,000 20,000 200,000 100,000 50,000 20,000 140,000 100,000 55,000 75,000 15,000
70,000 150,000 250,000 50,000 -
Secretary
Performance Bond
119
Relief Association Owatonna Palisade Palo Park Rapids Parkers Prairie Paynesville Pelican Rapids Pemberton Pennock Pequaywan Pequot Lakes Perham Pierz Pillager Pine Island Pine River Plato Porter Preston Princeton Prinsburg Prior Lake Proctor Randall Randolph Raymond Red Wing Redwood Falls Remer Renville
Active Members 30 24 16 27 26 26 24 18 20 12 29 28 26 25 29 22 29 24 23 33 18 41 24 24 33 26 26 28 21 24
Number of Members Retired LumpSum Survivor Disability 2 3 2 4 1 1 1 2 1 1 1 1 6 1 5 Deferred Members 6 1 2 4 2 1 2 2 2 3 2 2 3 5 9 4 4 2 7 1 4 16 2 7 3 1 1
Minimum Retirement Age 50 50 50 50 50 50 50 50 50 50 50 50 50 50 50 50 50 55 50 50 50 50 50 50 50 50 50 50 50 50 Active Service 10 10 10 10 10 5 10 10 10 5 10 10 12 10 10 10 5 10 10 10 10 10 20 10 5 10 10 10 10 10
Active Membership 10 10 10 10 10 5 10 10 10 5 10 10 12 10 10 10 5 10 10 10 10 10 10 10 5 10 10 10 10 10
Minimum Years
Table 5-A Membership and Bylaw Provisions for Lump-Sum Plans For the Year Ended December 31, 2011
Treasurer 500,000 100,000 30,000 500,000 30,000 500,000 50,000 15,000 20,000 7,000 250,000 65,000 100,000 50,000 1,000,000 250,000 100,000 28,000 300,000 500,000 25,000 300,000 50,000 40,000 60,000 300,000 500,000 150,000 100,000 100,000
7,000 300,000 50,000 500,000 100,000 -
Secretary
Performance Bond
120
Relief Association Rice Rice Lake Richmond Rockford Rockville Rogers Rollingstone Rose Creek Roseau Rosemount Rothsay Royalton Rush City Ruthton Sabin-Elmwood Sacred Heart Saint Anthony Saint Augusta Saint Bonifacius Saint Charles Saint Clair Saint Francis Saint James Saint Joseph Saint Leo Saint Martin Saint Michael Saint Paul Park Saint Peter Saint Stephen
Active Members 24 27 21 29 24 34 22 21 27 47 22 21 28 17 23 25 29 30 26 28 26 28 33 28 19 22 30 25 29 25
Number of Members Retired LumpSum Survivor Disability 2 1 2 3 1 1 1 1 1 4 3 1 1 2 1 1 1 4 2 1 1 2 1 Deferred Members 3 1 4 12 7 3 2 5 1 2 3 1 2 5 4 2 5 4 3 12 4 4 3
Minimum Retirement Age 50 50 50 50 50 50 50 50 50 50 50 50 50 50 50 50 50 50 50 50 50 50 50 50 50 50 50 50 50 50 Active Service 5 10 10 5 10 10 10 10 10 10 10 10 10 10 10 10 10 5 10 10 10 10 10 10 10 10 5 10 5 10
Active Membership 5 10 10 5 10 10 10 10 10 10 10 10 10 10 10 10 10 5 10 10 10 10 10 10 10 10 5 10 5 10
Minimum Years
Table 5-A Membership and Bylaw Provisions for Lump-Sum Plans For the Year Ended December 31, 2011
Treasurer 40,000 50,000 500,000 500,000 100,000 100,000 15,000 75,000 250,000 300,000 35,000 30,000 50,000 75,000 125,000 50,000 120,000 25,000 60,000 65,000 75,000 500,000 100,000 80,000 15,000 450,000 250,000 70,000 100,000 50,000
500,000 100,000 50,000 125,000 120,000 15,000 100,000 -
Secretary
Performance Bond
121
Relief Association Sanborn Sandstone Sartell Sauk Centre Sauk Rapids Scandia Valley Schroeder Sebeka Sedan Shafer Shakopee Shelly Sherburn Shevlin Silica Silver Bay Silver Lake Slayton Sleepy Eye Solway Solway Rural South Haven Spicer Spring Grove Spring Valley Springfield Squaw Lake Stacy-Lent Area Staples Starbuck
Active Members 19 16 29 27 30 19 14 20 16 24 42 14 23 14 13 23 26 28 32 20 17 25 24 28 23 24 20 33 25 24
Number of Members Retired LumpSum Survivor Disability 1 4 1 1 3 2 1 3 1 2 1 1 1 1 1 2 2 2 1 1 Deferred Members 2 2 1 1 5 14 8 3 5 1 2 2 4 3 2 2 1 4 5 10 4 1
Minimum Retirement Age 50 50 50 50 50 50 50 50 50 50 50 50 50 50 50 50 50 50 55 50 50 50 50 50 50 50 50 50 50 50 Active Service 20 10 10 10 10 10 10 10 5 10 5 10 10 10 10 10 10 5 10 10 10 5 10 10 5 10 10 10 10 10
Active Membership 10 10 10 10 10 10 10 10 5 10 5 10 10 10 10 10 10 5 10 10 10 5 10 10 5 10 10 5 10 10
Minimum Years
Table 5-A Membership and Bylaw Provisions for Lump-Sum Plans For the Year Ended December 31, 2011
Treasurer 50,000 200,000 100,000 75,000 150,000 40,000 30,000 150,000 30,000 250,000 500,000 13,500 300,000 25,000 20,000 75,000 50,000 50,000 100,000 22,000 20,000 35,000 40,000 250,000 400,000 100,000 50,000 60,000 40,000 20,000
100,000 40,000 30,000 150,000 500,000 40,000 -
Secretary
Performance Bond
122
Relief Association Stephen Stewart Stewartville Stillwater Storden Sturgeon Lake Sunburg Taconite Taunton Taylors Falls Thief River Falls Thomson Tofte Tower Tracy Trimont Truman Twin Lakes (City) Twin Lakes (VFD) Two Harbors Tyler Upsala Vadnais Heights Vergas Verndale Vernon Center Vesta Victoria Vining Wabasha
Active Members 28 19 36 32 23 16 23 15 14 20 26 21 12 15 24 24 24 15 10 23 24 20 35 20 21 20 19 28 17 24
Number of Members Retired LumpSum Survivor Disability 2 3 2 2 1 1 1 1 2 1 2 1 1 4 Deferred Members 1 5 1 10 2 1 3 2 5 2 2 5 2 1 5 4 1 13 4 3 5 16 1 3
Minimum Retirement Age 50 50 50 50 50 50 50 50 55 50 50 50 50 50 50 50 50 50 50 50 50 50 50 50 50 50 50 50 55 50 Active Service 10 10 5 10 10 10 10 10 10 10 10 10 5 10 5 10 10 5 10 5 10 10 5 10 10 10 10 5 10 10
Active Membership 10 10 5 10 10 10 10 10 10 10 10 10 5 10 5 10 10 5 10 5 10 10 5 10 10 10 10 5 10 10
Minimum Years
Table 5-A Membership and Bylaw Provisions for Lump-Sum Plans For the Year Ended December 31, 2011
Treasurer 300,000 34,000 150,000 300,000 20,000 100,000 100,000 15,000 25,000 60,000 100,000 60,000 15,000 100,000 50,000 75,000 105,000 25,000 20,000 70,000 25,000 25,000 135,000 35,000 50,000 15,000 15,000 500,000 10,000 75,000
15,000 50,000 70,000 50,000 15,000 75,000
Secretary
Performance Bond
123
Relief Association Waconia Wadena Waite Park Waldorf Walker Walnut Grove Walters Warren Warroad Waseca Watertown Waterville Watkins Watson Waubun Waverly Welcome Wendell West Concord Westbrook Wheaton Willmar Willow River Wilmont Wilson Windom Winnebago Winsted Wolf Lake Wood Lake
Active Members 34 20 29 25 24 20 18 25 27 31 28 21 24 15 16 21 23 23 25 24 23 36 19 18 25 31 21 26 20 17
Number of Members Retired LumpSum Survivor Disability 6 1 1 1 1 1 2 1 2 1 1 2 1 1 2 1 2 2 1 Deferred Members 3 2 1 1 5 7 7 6 3 1 2 1 2 4 2 4 10 2 2 10 1 5 6 1 6 6 12 3
Minimum Retirement Age 50 50 50 50 50 50 50 50 50 50 50 50 50 50 50 50 50 50 50 50 50 50 50 50 50 50 50 50 50 50 Active Service 10 10 10 10 10 10 5 10 10 10 10 10 10 10 10 10 10 10 5 10 10 10 10 10 10 10 5 10 10 10
Active Membership 10 10 10 10 10 10 5 10 5 10 10 10 10 10 10 10 10 10 5 10 10 10 10 10 10 10 5 10 10 10
Minimum Years
Table 5-A Membership and Bylaw Provisions for Lump-Sum Plans For the Year Ended December 31, 2011
Treasurer 500,000 300,000 72,000 50,000 75,000 100,000 25,000 50,000 100,000 150,000 60,000 250,000 250,000 40,000 20,000 30,000 100,000 50,000 200,000 20,000 100,000 250,000 100,000 150,000 50,000 100,000 50,000 50,000 100,000 20,000
50,000 100,000 150,000 40,000 50,000 200,000 150,000 50,000 100,000 -
Secretary
Performance Bond
124
Relief Association Woodbury Woodstock Wrenshall Wright Wykoff Wyoming Zimmerman Zumbro Falls
Active Members 70 12 26 12 15 26 25 17
Number of Members Retired LumpSum Survivor Disability 2 2 1 1 3 1 1 1 Deferred Members 38 1 4 5 4 4 3 3
Minimum Retirement Age 50 50 50 50 50 50 50 50 Active Service 5 10 10 10 10 10 10 10
Active Membership 5 10 10 10 10 10 10 10
Minimum Years
Table 5-A Membership and Bylaw Provisions for Lump-Sum Plans For the Year Ended December 31, 2011
Treasurer 500,000 15,000 50,000 15,000 75,000 250,000 100,000 31,000
250,000 -
Secretary
Performance Bond
125
Relief Association Alaska Andover Anoka-Champlin Ashby Austin Brewster Brooklyn Park Callaway Cloquet Area Fire District Cologne Columbia Heights Coon Rapids Crosslake Dakota Dalbo Dilworth Donnelly Eagan Edina Elbow Lake Elgin Ellsburg Embarrass Erskine Falcon Heights Fisher Fosston Fountain Freeport Fridley
Active Members 17 50 44 23 18 21 74 15 30 30 21 51 27 12 18 28 22 102 42 25 25 7 16 20 20 16 24 19 21 35
Number of Members Retired LumpSum Survivor Disability 1 1 4 4 1 1 2 8 1 2 1 1 2 1 1 1 1 1 1 2 1 5 Deferred Members 4 25 8 4 5 8 31 4 3 2 9 13 2 4 6 3 2 42 10 7 4 1 6 2 14 2 2 2 7 13
Minimum Retirement Age 50 50 50 50 50 50 50 50 50 50 50 50 50 50 50 50 50 50 50 50 50 55 50 50 50 50 50 50 50 50 Active Service 10 5 10 5 7 10 5 10 5 10 5 5 10 5 10 10 10 5 5 10 10 5 10 10 5 15 10 10 10 5
Active Membership 5 5 10 5 7 10 5 10 5 10 5 5 10 5 10 10 10 5 5 10 5 5 10 10 5 15 10 10 10 5
Minimum Years
Table 5-B Membership and Bylaw Provisions for Defined-Contribution Plans For the Year Ended December 31, 2011
Treasurer $ 15,000 303,032 500,000 260,000 100,000 100,000 500,000 70,000 25,000 50,000 200,000 500,000 400,000 50,000 50,000 70,000 150,000 500,000 500,000 30,000 30,000 25,000 15,000 20,000 150,000 15,466 40,000 75,000 125,000 350,000
Secretary $ 500,000 10,000 500,000 50,000 500,000 500,000 75,000 -
Performance Bond
126
Relief Association Gary Gibbon Glenville Goodhue Gunflint Trail Hardwick Hawley Ivanhoe Kelsey Kenyon Kerkhoven Kiester Lake George Lakeport Le Center London Longville Lyle Magnolia Maple Grove Marietta Marine-On-Saint Croix Mazeppa Medicine Lake Mendota Heights Mentor Millerville Milroy Murdock Myrtle
Active Members 21 25 25 23 22 19 21 32 12 30 23 21 10 17 24 22 20 18 9 90 16 32 21 20 37 16 29 27 21 21
Number of Members Retired LumpSum Survivor Disability 1 1 1 2 1 1 4 2 2 1 1 11 1 1 3 1 1 Deferred Members 5 10 9 2 2 2 3 3 3 4 2 1 6 6 3 1 45 3 20 6 4 4 1 5 3 10
Minimum Retirement Age 50 50 50 50 50 50 50 50 50 50 50 55 50 50 50 50 50 50 50 50 60 50 50 50 50 50 50 50 50 50 Active Service 10 13 5 5 5 10 10 10 5 10 10 10 10 10 10 5 5 10 10 5 10 5 10 5 10 10 10 10 10 5
Active Membership 10 13 5 5 5 10 10 10 5 10 10 10 10 10 10 5 5 10 10 5 10 5 10 5 10 10 10 10 5 5
Minimum Years
Table 5-B Membership and Bylaw Provisions for Defined-Contribution Plans For the Year Ended December 31, 2011
Treasurer 20,000 40,000 20,000 80,000 30,000 45,000 55,000 100,000 5,000 55,000 100,000 125,000 6,000 25,000 50,000 10,000 75,000 15,000 10,000 1,000,000 10,000 125,000 25,000 75,000 500,000 10,000 50,000 50,000 30,000 20,000
125,000 75,000 500,000 -
Secretary
Performance Bond
127
Relief Association Nassau Nodine Northrop Odessa Oklee Plainview Plummer Ramsey Red Lake Falls Round Lake Rushford Rushmore Saint Hilaire Seaforth South Bend Swanville Toivola Ulen Underwood Vermilion Lake Viking Wabasso Wanamingo Wanda Wayzata Wells West Metro Williams Winthrop Zumbrota
Active Members 16 13 14 17 20 21 23 52 22 20 29 17 18 10 19 19 21 22 20 15 17 22 29 14 27 24 59 22 25 30
Number of Members Retired LumpSum Survivor Disability 1 1 1 1 3 1 1 2 1 2 3 2 7 Deferred Members 1 2 1 1 9 2 3 2 5 1 1 10 1 7 1 5 1 1 3 3 27 3 2 3
Minimum Retirement Age 55 50 50 50 50 50 50 50 50 50 50 50 50 50 50 50 50 50 50 50 50 50 50 50 50 50 50 50 50 50 Active Service 20 10 5 10 10 10 10 10 5 10 10 5 10 10 10 10 5 10 10 10 20 10 10 10 10 5 5 10 10 10
Active Membership 10 10 5 5 10 10 10 10 5 10 10 5 10 10 10 10 5 10 10 10 20 10 10 10 10 5 5 10 10 10
Minimum Years
Table 5-B Membership and Bylaw Provisions for Defined-Contribution Plans For the Year Ended December 31, 2011
Treasurer 100,000 20,000 100,000 10,000 15,000 60,000 20,000 500,000 21,000 60,000 100,000 100,000 20,000 9,000 40,000 25,000 15,000 125,000 30,000 20,000 25,000 50,000 15,000 200,000 100,000 500,000 50,000 250,000 75,000
20,000 500,000 -
Secretary
Performance Bond
This page is intentionally left blank.
129
Relief Association Apple Valley Appleton Benson Brooklyn Center Chanhassen Chaska Eden Prairie Fairmont Glencoe Hutchinson Lake Johanna Minnetonka Mound New Ulm Pine City Pipestone Plymouth Robbinsdale Roseville Savage Spring Lake Park White Bear Lake Worthington
Active Members 65 25 25 34 44 32 95 33 36 28 65 68 40 41 22 35 71 27 51 35 51 49 33
LumpSum 2 3 1 2 4 2 2 2 1 2 2 2 1 Survivor 1 -
Disability 1 -
Number of Members Retired Monthly 23 7 13 25 9 48 82 15 13 53 20 61 38 14 29 7 7 10 55 33 66 45 15
Deferred Members 14 7 2 8 20 11 12 2 3 7 10 17 3 9 1 2 19 2 11 35 9 9 4
Minimum Retirement Age 50 55 50 50 50 50 50 50 50 50 50 50 50 50 50 50 50 50 50 50 50 50 50 Active Active Service Membership 5 5 10 10 10 10 10 10 5 5 10 10 10 10 10 10 10 10 15 15 10 10 10 10 20 20 10 10 20 19 10 10 10 10 10 10 10 10 10 10 10 10 10 10 10 10
Minimum Years
Table 5-C Membership and Bylaw Provisions for Other Plan Types For the Year Ended December 31, 2011
Treasurer $ 500,000 250,000 45,000 500,000 200,000 1,000,000 500,000 300,000 100,000 200,000 500,000 1,000,000 500,000 500,000 100,000 104,000 500,000 200,000 500,000 500,000 500,000 500,000 200,000
Secretary $ 250,000 500,000 1,000,000 500,000 300,000 50,000 1,000,000 10,000 500,000 500,000 -
Performance Bond
This page is intentionally left blank.
How to Read Tables 6-A Through 6-C
Tables 6-A, 6-B, and 6-C provide information regarding the benefits offered by each relief association during 2011. Annual Benefit – The service pension amount payable per year of active service. For defined-contribution plans, the pension amount is based on the member’s account balance. Monthly – The service pension amount payable per month, for each year of active service. Long-Term Disability – The amount and type of benefit available for members who separate from service with a long-term disability. “Y/S” means the amount paid per year of active service, while “M/S” means the amount paid monthly for each year of active service. Short-Term Disability – The amount and type of benefit for members who are temporarily unable to serve because of a short-term disability. Survivor Benefit – The amount and type of benefit paid on behalf of a deceased member. “Y/S” means the amount paid per year of active service, while “M/S” means the amount paid monthly for each year of active service.
131
This page is intentionally left blank.
Table 6-A Benefit Amounts for Lump-Sum Plans For the Year Ended December 31, 2011
Relief Association Ada Adams Adrian Aitkin Albany Albert Lea Township Albertville Almelund Alpha Altura Amboy Annandale Argyle Arlington Arrowhead Askov Atwater Audubon Aurora Avon Babbitt Backus Badger Bagley Balaton Baldwin Balsam Barnesville Barnum Barrett Battle Lake Baudette Bayport Beardsley Beaver Bay Beaver Creek Becker Belgrade Belle Plaine Bellingham Belview Bemidji Bertha Bethel
Annual Benefit $ 790 700 1,000 2,000 1,400 2,000 1,740 700 600 400 800 2,000 465 1,150 600 800 1,000 1,100 1,300 1,700 1,100 1,400 500 1,150 500 1,600 1,100 700 700 475 1,500 1,150 5,400 500 500 500 2,900 850 2,100 700 700 5,100 800 488
Long-Term Disability Amount Type $ 700 Y/S 1,000 Y/S 2,000 Y/S 1,400 Y/S 2,000 Y/S 1,740 Y/S 700 Y/S 800 Y/S 2,000 Y/S 1,150 Y/S 600 Y/S 800 Y/S 1,000 Y/S 1,100 Y/S 1,300 Y/S 1,100 Y/S 1,400 Y/S 500 Y/S 1,150 Y/S 500 Y/S 1,600 Y/S 1,100 Y/S 700 Y/S 700 Y/S 1,500 Y/S 1,150 Y/S 5,400 Y/S 500 Y/S 500 Y/S 500 Y/S 2,900 Y/S 850 Y/S 2,100 Y/S 700 Y/S 700 Y/S 5,100 Y/S 800 Y/S 488 Y/S
Short-Term Disability Amount Type $ 200 Week 3 Day 10 Day 5 Day 25 Day -
Survivor Benefit Amount Type $ 790 Y/S 700 Y/S 1,000 Y/S 2,000 Y/S 1,400 Y/S 2,000 Y/S 1,740 Y/S 700 Y/S 600 Y/S 400 Y/S 800 Y/S 2,000 Y/S 465 Y/S 1,150 Y/S 600 Y/S 800 Y/S 1,000 Y/S 1,100 Y/S 1,300 Y/S 1,700 Y/S 1,100 Y/S 1,400 Y/S 500 Y/S 1,150 Y/S 500 Y/S 1,600 Y/S 1,100 Y/S 700 Y/S 700 Y/S 475 Y/S 1,500 Y/S 1,150 Y/S 5,400 Y/S 500 Y/S 500 Y/S 500 Y/S 2,900 Y/S 850 Y/S 2,100 Y/S 700 Y/S 700 Y/S 5,100 Y/S 800 Y/S 488 Y/S
Key: Bal = Balance of Account; Lump = Lump-Sum; M/S = Per Month, Per Year of Service; MO = Month; Y/S = Per Year of Service
133
Table 6-A Benefit Amounts for Lump-Sum Plans For the Year Ended December 31, 2011
Relief Association Big Lake Bigelow Bigfork Bird Island Biwabik City Blackduck Blackhoof Blooming Prairie Blue Earth Bluffton Bovey Bowlus Boyd Braham Brainerd Brandon Breckenridge Breitung Brevator Bricelyn Brimson Brook Park Brooten Browerville Browns Valley Brownsdale Brownsville Brownton Buffalo Buffalo Lake Buhl Butterfield Byron Caledonia Calumet Cambridge Campbell Canby Cannon Falls Canosia Canton Carlos Carlton Carsonville
Annual Benefit 2,800 200 2,100 950 1,400 900 500 1,225 1,700 350 1,100 400 320 1,245 6,825 875 1,200 750 600 700 450 400 700 750 750 800 50 1,000 4,000 1,000 1,000 650 1,150 1,050 1,450 2,400 500 1,050 1,700 1,000 400 1,750 1,750 500
Long-Term Disability Amount Type 2,800 Y/S 200 Y/S 2,100 Y/S 950 Y/S 1,400 Y/S 900 Y/S 500 Y/S 1,225 Y/S 1,700 Y/S 350 Y/S 1,100 Y/S 400 Y/S 320 Y/S 1,245 Y/S 6,825 Y/S 875 Y/S 1,200 Y/S 750 Y/S 600 Y/S 700 Y/S 450 Y/S 400 Y/S 700 Y/S 750 Y/S 750 Y/S 800 Y/S 50 Y/S 1,000 Y/S 1,000 Y/S 1,000 Y/S 650 Y/S 1,150 Y/S 1,050 Y/S 2,400 Y/S 1,050 Y/S 1,700 Y/S 1,000 Y/S 400 Y/S 1,750 Y/S 1,750 Y/S 500 Y/S
Short-Term Disability Amount Type 5 Day 25 Day 2 Day 5 Day 5 Day -
Survivor Benefit Amount Type 2,800 Y/S 200 Y/S 2,100 Y/S 950 Y/S 1,400 Y/S 900 Y/S 500 Y/S 1,225 Y/S 1,700 Y/S 350 Y/S 1,100 Y/S 400 Y/S 320 Y/S 1,245 Y/S 6,825 Y/S 875 Y/S 1,200 Y/S 750 Y/S 600 Y/S 700 Y/S 450 Y/S 400 Y/S 700 Y/S 750 Y/S 750 Y/S 800 Y/S 50 Y/S 1,000 Y/S 4,000 Y/S 1,000 Y/S 1,000 Y/S 650 Y/S 1,150 Y/S 1,050 Y/S 2,400 Y/S 500 Y/S 1,050 Y/S 1,700 Y/S 1,000 Y/S 400 Y/S 1,750 Y/S 1,750 Y/S 500 Y/S
Key: Bal = Balance of Account; Lump = Lump-Sum; M/S = Per Month, Per Year of Service; MO = Month; Y/S = Per Year of Service
134
Table 6-A Benefit Amounts for Lump-Sum Plans For the Year Ended December 31, 2011
Relief Association Carver Cass Lake Centennial Center City Ceylon Chandler Chatfield Cherry Chisago Chisholm Chokio Clara City Claremont Clarissa Clarkfield Clarks Grove Clear Lake Clearbrook Clearwater Clements Cleveland Clifton Climax Clinton (Big Stone) Cohasset Cokato Cold Spring Coleraine Colvill Colvin Comfrey Cook Cosmos Cottage Grove Cotton Cottonwood Courtland Cromwell Crooked Lake Crookston Crosby Culver Currie Cuyuna
Annual Benefit 1,957 2,500 4,000 1,250 550 650 1,300 600 2,700 2,400 500 1,000 700 700 800 450 1,200 950 1,300 650 1,200 1,100 150 600 2,150 1,600 1,900 1,250 500 800 625 1,500 850 3,600 400 600 1,200 1,300 550 1,700 2,050 400 600 850
Long-Term Disability Amount Type 1,957 Y/S 2,500 Y/S 4,000 Y/S 1,250 Y/S 650 Y/S 1,300 Y/S 600 Y/S 2,700 Y/S 2,400 Y/S 500 Y/S 1,000 Y/S 700 Y/S 700 Y/S 800 Y/S 450 Y/S 1,200 Y/S 950 Y/S 1,300 Y/S 650 Y/S 1,200 Y/S 1,100 Y/S 600 Y/S 2,150 Y/S 1,600 Y/S 1,250 Y/S 500 Y/S 625 Y/S 1,500 Y/S 850 Y/S 3,600 Y/S 400 Y/S 600 Y/S 1,200 Y/S 1,300 Y/S 1,700 Y/S 2,050 Y/S 400 Y/S 600 Y/S 850 Y/S
Short-Term Disability Amount Type 10 Day 50 Week 25 Week 15 Day -
Survivor Benefit Amount Type 1,957 Y/S 2,500 Y/S 4,000 Y/S 1,250 Y/S 550 Y/S 650 Y/S 1,300 Y/S 600 Y/S 2,700 Y/S 2,400 Y/S 500 Y/S 1,000 Y/S 700 Y/S 700 Y/S 800 Y/S 450 Y/S 1,200 Y/S 950 Y/S 1,300 Y/S 650 Y/S 1,200 Y/S 1,100 Y/S 150 Y/S 600 Y/S 2,150 Y/S 1,600 Y/S 1,900 Y/S 1,250 Y/S 500 Y/S 800 Y/S 625 Y/S 1,500 Y/S 850 Y/S 3,600 Y/S 400 Y/S 600 Y/S 1,200 Y/S 1,300 Y/S 550 Y/S 1,700 Y/S 2,050 Y/S 400 Y/S 600 Y/S 850 Y/S
Key: Bal = Balance of Account; Lump = Lump-Sum; M/S = Per Month, Per Year of Service; MO = Month; Y/S = Per Year of Service
135
Table 6-A Benefit Amounts for Lump-Sum Plans For the Year Ended December 31, 2011
Relief Association Cyrus Dalton Danube Danvers Darfur Dassel Dawson Dayton Deer Creek Deer River Deerwood Delano Delavan Dent Detroit Lakes Dexter Dodge Center Dover Dovray Dumont Dunnell Eagle Bend Eagle Lake East Bethel East Grand Forks Eastern Hubbard Easton Echo Eden Valley Edgerton Eitzen Elizabeth Elk River Elko New Market Ellendale Ellsworth Elmer Elmore Elrosa Ely Elysian Emily Evansville Eveleth
Annual Benefit 400 600 550 750 400 2,300 1,800 1,500 625 1,750 1,100 2,525 750 700 4,700 400 1,700 850 160 300 450 900 1,700 3,400 2,100 1,100 450 600 1,000 850 450 600 5,091 3,500 500 500 250 1,100 700 1,600 900 750 480 1,900
Long-Term Disability Amount Type 600 Y/S 550 Y/S 750 Y/S 400 Y/S 2,300 Y/S 1,800 Y/S 1,500 Y/S 625 Y/S 1,750 Y/S 2,525 Y/S 750 Y/S 700 Y/S 400 Y/S 850 Y/S 160 Y/S 300 Y/S 450 Y/S 900 Y/S 1,700 Y/S 2,100 Y/S 450 Y/S 600 Y/S 850 Y/S 600 Y/S 5,091 Y/S 3,500 Y/S 500 Y/S 1,100 Y/S 700 Y/S 1,600 Y/S 900 Y/S 480 Y/S 1,900 Y/S
Short-Term Disability Amount Type 20 Day 10 Day -
Survivor Benefit Amount Type 400 Y/S 600 Y/S 550 Y/S 750 Y/S 400 Y/S 2,300 Y/S 1,800 Y/S 1,500 Y/S 625 Y/S 1,750 Y/S 1,100 Y/S 2,525 Y/S 750 Y/S 700 Y/S 4,700 Y/S 400 Y/S 1,700 Y/S 850 Y/S 160 Y/S 300 Y/S 450 Y/S 900 Y/S 1,700 Y/S 3,400 Y/S 2,100 Y/S 1,100 Y/S 450 Y/S 600 Y/S 1,000 Y/S 850 Y/S 450 Y/S 600 Y/S 5,091 Y/S 3,500 Y/S 500 Y/S 500 Y/S 250 Y/S 1,100 Y/S 700 Y/S 1,600 Y/S 900 Y/S 750 Y/S 480 Y/S 1,900 Y/S
Key: Bal = Balance of Account; Lump = Lump-Sum; M/S = Per Month, Per Year of Service; MO = Month; Y/S = Per Year of Service
136
Table 6-A Benefit Amounts for Lump-Sum Plans For the Year Ended December 31, 2011
Relief Association Excelsior Eyota Fairfax Farmington Fayal Federal Dam Fergus Falls Fertile Fifty Lakes Finland Finlayson Flensburg Floodwood Foley Forada Forest Lake Foreston Franklin Frazee Fredenberg French Township Frost Fulda Garfield Garrison Garvin Gaylord Geneva Ghent Gilbert Glenwood Glyndon Gnesen Golden Valley Gonvick Good Thunder Goodland Goodview Graceville Granada Grand Lake Grand Meadow Grand Rapids Granite Falls
Annual Benefit 6,250 1,200 1,700 4,575 1,500 100 3,900 800 600 650 600 575 1,000 2,100 800 4,500 1,000 1,000 1,200 800 500 550 1,000 1,000 3,100 450 1,350 200 525 1,100 1,600 900 1,000 6,700 650 975 550 1,400 550 500 1,375 1,100 5,000 1,350
Long-Term Disability Amount Type 6,250 Y/S 1,200 Y/S 1,700 Y/S 4,575 Y/S 1,500 Y/S 100 Y/S 800 Y/S 600 Y/S 600 Y/S 575 Y/S 1,000 Y/S 800 Y/S 4,500 Y/S 1,000 Y/S 1,000 Y/S 1,200 Y/S 800 Y/S 500 Y/S 550 Y/S 1,000 Y/S 1,000 Y/S 3,100 Y/S 450 Y/S 1,350 Y/S 200 Y/S 1,100 Y/S 1,600 Y/S 1,000 Y/S 6,700 Y/S 650 Y/S 550 Y/S 1,400 Y/S 550 Y/S 1,375 Y/S 1,100 Y/S 5,000 Y/S -
Short-Term Disability Amount Type 35 Week 75 Week 5 Day 25 Day 50 Week 300 Week -
Survivor Benefit Amount Type 6,250 Y/S 1,200 Y/S 1,700 Y/S 4,575 Y/S 1,500 Y/S 100 Y/S 3,900 Y/S 800 Y/S 600 Y/S 650 Y/S 600 Y/S 575 Y/S 1,000 Y/S 2,100 Y/S 800 Y/S 4,500 Y/S 1,000 Y/S 1,000 Y/S 1,200 Y/S 800 Y/S 500 Y/S 550 Y/S 1,000 Y/S 1,000 Y/S 3,100 Y/S 450 Y/S 1,350 Y/S 200 Y/S 525 Y/S 1,100 Y/S 1,600 Y/S 900 Y/S 1,000 Y/S 6,700 Y/S 650 Y/S 975 Y/S 550 Y/S 1,400 Y/S 550 Y/S 500 Y/S 1,375 Y/S 1,100 Y/S 5,000 Y/S -
Key: Bal = Balance of Account; Lump = Lump-Sum; M/S = Per Month, Per Year of Service; MO = Month; Y/S = Per Year of Service
137
Table 6-A Benefit Amounts for Lump-Sum Plans For the Year Ended December 31, 2011
Relief Association Green Isle Greenbush Greenwood Grey Eagle Grove City Grygla Hackensack Hallock Halstad Ham Lake Hamburg Hamel Hancock Hanley Falls Hanska Harmony Harris Hartland Hastings Hayfield Hayward Hector Henderson Hendricks Hendrum Henning Herman Hermantown Heron Lake Hewitt Hibbing Hill City Hills Hinckley Hitterdal Hoffman Hokah Holdingford Holland Hollandale Hopkins Houston Hovland Area Howard Lake
Annual Benefit 775 500 1,500 750 1,000 250 1,800 500 600 3,200 1,450 2,300 600 400 510 750 1,100 425 4,500 1,500 800 1,200 1,000 700 600 1,000 650 2,900 600 500 1,200 615 750 1,300 500 650 475 900 250 1 5,300 925 800 1,400
Long-Term Disability Amount Type 775 Y/S 1,500 Y/S 750 Y/S 1,000 Y/S 250 Y/S 1,800 Y/S 600 Y/S 3,200 Y/S 1,450 Y/S 2,300 Y/S 510 Y/S 750 Y/S 1,100 Y/S 425 Y/S 4,500 Y/S 1,500 Y/S 800 Y/S 1,200 Y/S 1,000 Y/S 700 Y/S 600 Y/S 1,000 Y/S 650 Y/S 2,900 Y/S 600 Y/S 500 Y/S 1,200 Y/S 615 Y/S 750 Y/S 1,300 Y/S 500 Y/S 650 Y/S 475 Y/S 900 Y/S 250 Y/S 1 Y/S 5,300 Y/S 925 Y/S 800 Y/S 1,400 Y/S
Short-Term Disability Amount Type 40 Day -
Survivor Benefit Amount Type 775 Y/S 500 Y/S 1,500 Y/S 750 Y/S 1,000 Y/S 250 Y/S 1,800 Y/S 500 Y/S 600 Y/S 3,200 Y/S 1,450 Y/S 2,300 Y/S 600 Y/S 400 Y/S 510 Y/S 750 Y/S 1,100 Y/S 425 Y/S 4,500 Y/S 1,500 Y/S 800 Y/S 1,200 Y/S 1,000 Y/S 700 Y/S 600 Y/S 1,000 Y/S 650 Y/S 2,900 Y/S 600 Y/S 500 Y/S 1,200 Y/S 615 Y/S 750 Y/S 1,300 Y/S 500 Y/S 650 Y/S 475 Y/S 900 Y/S 250 Y/S 1 Y/S 5,300 Y/S 925 Y/S 800 Y/S 1,400 Y/S
Key: Bal = Balance of Account; Lump = Lump-Sum; M/S = Per Month, Per Year of Service; MO = Month; Y/S = Per Year of Service
138
Table 6-A Benefit Amounts for Lump-Sum Plans For the Year Ended December 31, 2011
Relief Association Hoyt Lakes Hugo Ideal Industrial International Falls Inver Grove Heights Iona Isanti Isle Jackson Jacobson Janesville Jasper Jeffers Jordan Kandiyohi Karlstad Kasota Kasson Keewatin Kelliher Kellogg Kennedy Kensington Kerrick Kettle River Kilkenny Kimball Kinney La Crescent La Salle Lafayette Lake Benton Lake Bronson Lake City Lake Crystal Lake Elmo Lake Henry Lake Kabetogama Lake Lillian Lake Park Lake Wilson Lakefield Lakeville
Annual Benefit 1,500 2,700 2,100 700 2,750 5,800 300 3,800 967 1,700 400 1,400 650 500 1,900 1,100 350 1,300 2,000 1,600 560 680 350 750 50 600 800 825 650 1,600 400 1,025 700 400 3,250 2,000 3,100 425 750 700 875 600 1,000 6,230
Long-Term Disability Amount Type 1,500 Y/S 700 Y/S 2,750 Y/S 5,800 Y/S 300 Y/S 3,800 Y/S 967 Y/S 400 Y/S 1,400 Y/S 650 Y/S 1,900 Y/S 350 Y/S 1,300 Y/S 2,000 Y/S 1,600 Y/S 560 Y/S 680 Y/S 350 Y/S 600 Y/S 800 Y/S 825 Y/S 650 Y/S 1,600 Y/S 400 Y/S 700 Y/S 400 Y/S 3,250 Y/S 2,000 Y/S 3,100 Y/S 425 Y/S 750 Y/S 700 Y/S 875 Y/S 600 Y/S 6,230 Y/S
Short-Term Disability Amount Type 3 Day 10 Day 2 Day -
Survivor Benefit Amount Type 1,500 Y/S 2,700 Y/S 2,100 Y/S 700 Y/S 2,750 Y/S 5,800 Y/S 300 Y/S 3,800 Y/S 967 Y/S 1,700 Y/S 400 Y/S 1,400 Y/S 650 Y/S 500 Y/S 1,900 Y/S 1,100 Y/S 350 Y/S 1,300 Y/S 2,000 Y/S 1,600 Y/S 560 Y/S 680 Y/S 350 Y/S 750 Y/S 50 Y/S 600 Y/S 800 Y/S 825 Y/S 650 Y/S 1,600 Y/S 400 Y/S 1,025 Y/S Y/S 700 400 Y/S 3,250 Y/S 2,000 Y/S 3,100 Y/S 425 Y/S 750 Y/S 700 Y/S 875 Y/S 600 Y/S 1,000 Y/S 6,230 Y/S
Key: Bal = Balance of Account; Lump = Lump-Sum; M/S = Per Month, Per Year of Service; MO = Month; Y/S = Per Year of Service
139
Table 6-A Benefit Amounts for Lump-Sum Plans For the Year Ended December 31, 2011
Relief Association Lakewood Lamberton Lancaster Lanesboro Le Sueur Leaf Valley LeRoy Lester Prairie Lewiston Lewisville Lindstrom Linwood Lismore Litchfield Little Canada Little Falls Littlefork Long Lake Long Prairie Lonsdale Loretto Lower Saint Croix Valley Lowry Lucan Luverne Lynd Mabel Madelia Madison Madison Lake Mahnomen Mahtowa Makinen Mantorville Maple Hill Maple Lake Maple Plain Mapleton Mapleview Maplewood Marble Marshall Mayer Maynard
Annual Benefit 650 950 500 1,100 2,600 900 450 925 1,250 700 2,295 2,000 300 2,000 3,150 3,000 875 2,889 1,750 1,900 4,200 3,100 800 450 2,000 450 525 1,200 1,000 1,100 1,100 500 500 800 1,000 1,700 2,100 1,800 500 5,500 1,450 4,700 1,600 650
Long-Term Disability Amount Type 650 Y/S 950 Y/S 500 Y/S 1,100 Y/S 900 Y/S 450 Y/S 925 Y/S 1,250 Y/S 700 Y/S 2,295 Y/S 2,000 Y/S 300 Y/S 2,000 Y/S 3,150 Y/S 3,000 Y/S 875 Y/S 2,889 Y/S 1,750 Y/S 1,900 Y/S 4,200 Y/S 3,100 Y/S 800 Y/S 450 Y/S 525 Y/S 1,200 Y/S 1,000 Y/S 1,100 Y/S 500 Y/S 500 Y/S 800 Y/S 1,000 Y/S 1,700 Y/S 2,100 Y/S 1,800 Y/S 500 Y/S 5,500 Y/S 1,450 Y/S 4,700 Y/S 1,600 Y/S 650 Y/S
Short-Term Disability Amount Type 100 Week 100 Week 8 Day 10 Day 50 Week 10 Week 50 Day -
Survivor Benefit Amount Type 650 Y/S 950 Y/S 500 Y/S 1,100 Y/S 2,600 Y/S 900 Y/S 450 Y/S 925 Y/S 1,250 Y/S 700 Y/S 2,295 Y/S 2,000 Y/S 300 Y/S 2,000 Y/S 3,150 Y/S 3,000 Y/S 875 Y/S 2,889 Y/S 1,750 Y/S 1,900 Y/S 4,200 Y/S 3,100 Y/S 800 Y/S 450 Y/S 2,000 Y/S 450 Y/S 525 Y/S 1,200 Y/S 1,000 Y/S 1,100 Y/S 1,100 Y/S 500 Y/S 500 Y/S 800 Y/S 1,000 Y/S 1,700 Y/S 2,100 Y/S 1,800 Y/S 500 Y/S 5,500 Y/S 1,450 Y/S 4,700 Y/S 1,600 Y/S 650 Y/S
Key: Bal = Balance of Account; Lump = Lump-Sum; M/S = Per Month, Per Year of Service; MO = Month; Y/S = Per Year of Service
140
Table 6-A Benefit Amounts for Lump-Sum Plans For the Year Ended December 31, 2011
Relief Association McDavitt McGrath McGregor McIntosh McKinley Meadowlands Medford Melrose Menahga Middle River Miesville Milaca Milan Miltona Minneota Minnesota Lake Mission Montevideo Montgomery Monticello Montrose Moose Lake Mora Morgan Morris Morristown Morse-Fall Lake Morton Motley Mountain Iron Mountain Lake Nashwauk Nerstrand Nevis New Auburn New Brighton New Germany New London New Munich New Prague New Richland New York Mills Newfolden Newport
Annual Benefit 1,000 500 1,600 600 600 300 725 1,250 1,100 400 500 2,400 500 1,000 1,000 800 1,500 1,700 1,800 2,750 1,500 1,000 1,700 1,600 1,700 1,700 10 800 1,600 1,800 1,200 1,300 50 1,050 1,000 5,600 1,300 1,525 475 3,050 1,000 1,250 600 3,000
Long-Term Disability Amount Type 1,000 Y/S 500 Y/S 1,600 Y/S 600 Y/S 600 Y/S 725 Y/S 1,250 Y/S 1,100 Y/S 400 Y/S 500 Y/S 2,400 Y/S 500 Y/S 1,000 Y/S 1,000 Y/S 800 Y/S 1,500 Y/S Y/S 1,700 1,800 Y/S 2,750 Y/S 1,500 Y/S 1,000 Y/S 1,700 Y/S 1,600 Y/S 1,700 Y/S 10 Y/S 800 Y/S 1,600 Y/S 1,800 Y/S 1,200 Y/S 1,300 Y/S 50 Y/S 1,050 Y/S 1,000 Y/S 5,600 Y/S 1,300 Y/S 1,525 Y/S 475 Y/S 3,050 Y/S 1,000 Y/S 1,250 Y/S 600 Y/S 3,000 Y/S
Short-Term Disability Amount Type 6 Day 100 Week 3 Day 50 Week 100 Week 300 Week -
Survivor Benefit Amount Type 1,000 Y/S 500 Y/S 1,600 Y/S 600 Y/S 600 Y/S 300 Y/S 725 Y/S 1,250 Y/S 1,100 Y/S 400 Y/S 500 Y/S 2,400 Y/S 500 Y/S 1,000 Y/S 1,000 Y/S 800 Y/S 1,500 Y/S 1,700 Y/S 1,800 Y/S 2,750 Y/S 1,500 Y/S 1,000 Y/S 1,700 Y/S 1,600 Y/S 1,700 Y/S 1,700 Y/S 10 Y/S 800 Y/S 1,600 Y/S 1,800 Y/S 1,200 Y/S 1,300 Y/S 50 Y/S 1,050 Y/S 1,000 Y/S 5,600 Y/S 1,300 Y/S 1,525 Y/S 475 Y/S 3,050 Y/S 1,000 Y/S 1,250 Y/S 600 Y/S 3,000 Y/S
Key: Bal = Balance of Account; Lump = Lump-Sum; M/S = Per Month, Per Year of Service; MO = Month; Y/S = Per Year of Service
141
Table 6-A Benefit Amounts for Lump-Sum Plans For the Year Ended December 31, 2011
Relief Association Nicollet Nisswa Normanna North Branch North Mankato North Saint Paul Northfield Northland Northome Norwood Young America Oak Grove Oakdale Odin Ogilvie Okabena Olivia Onamia Ormsby Oronoco Orr Ortonville Osakis Osseo Ostrander Owatonna Palisade Palo Park Rapids Parkers Prairie Paynesville Pelican Rapids Pemberton Pennock Pequaywan Pequot Lakes Perham Pierz Pillager Pine Island Pine River Plato Porter Preston Princeton
Annual Benefit 1,300 2,400 100 3,200 3,000 3,400 7,500 250 550 1,575 2,300 4,900 575 1,250 450 1,100 1,100 525 1,200 650 1,000 2,600 1,600 435 4,450 600 950 3,000 1,100 2,000 1,800 550 900 500 2,900 1,900 1,400 2,200 2,500 1,950 1,084 325 1,300 2,875
Long-Term Disability Amount Type 1,300 Y/S 2,400 Y/S 100 Y/S 3,200 Y/S 3,000 Y/S 3,400 Y/S 7,500 Y/S 250 Y/S 550 Y/S 1,575 Y/S 2,300 Y/S 4,900 Y/S 1,250 Y/S 450 Y/S 1,100 Y/S 1,100 Y/S 650 Y/S 1,000 Y/S 2,600 Y/S 1,600 Y/S 435 Y/S 4,450 Y/S 600 Y/S 950 Y/S 1,100 Y/S 2,000 Y/S 1,800 Y/S 900 Y/S 1,400 Y/S 2,200 Y/S 2,500 Y/S 1,950 Y/S 1,084 Y/S 325 Y/S 1,300 Y/S 2,875 Y/S
Short-Term Disability Amount Type 15 Week -
Survivor Benefit Amount Type 1,300 Y/S 2,400 Y/S 100 Y/S 3,200 Y/S 3,000 Y/S 3,400 Y/S 7,500 Y/S 250 Y/S 550 Y/S 1,575 Y/S 2,300 Y/S 4,900 Y/S 575 Y/S 1,250 Y/S 450 Y/S 1,100 Y/S 1,100 Y/S 525 Y/S 1,200 Y/S 650 Y/S 1,000 Y/S 2,600 Y/S 1,600 Y/S 435 Y/S 4,450 Y/S 600 Y/S 950 Y/S 3,000 Y/S 1,100 Y/S 2,000 Y/S 1,800 Y/S 550 Y/S 900 Y/S 500 Y/S 2,900 Y/S 1,900 Y/S 1,400 Y/S 2,200 Y/S 2,500 Y/S 1,950 Y/S 1,084 Y/S 325 Y/S 1,300 Y/S 2,875 Y/S
Key: Bal = Balance of Account; Lump = Lump-Sum; M/S = Per Month, Per Year of Service; MO = Month; Y/S = Per Year of Service
142
Table 6-A Benefit Amounts for Lump-Sum Plans For the Year Ended December 31, 2011
Relief Association Prinsburg Prior Lake Proctor Randall Randolph Raymond Red Wing Redwood Falls Remer Renville Rice Rice Lake Richmond Rockford Rockville Rogers Rollingstone Rose Creek Roseau Rosemount Rothsay Royalton Rush City Ruthton Sabin-Elmwood Sacred Heart Saint Anthony Saint Augusta Saint Bonifacius Saint Charles Saint Clair Saint Francis Saint James Saint Joseph Saint Leo Saint Martin Saint Michael Saint Paul Park Saint Peter Saint Stephen Sanborn Sandstone Sartell Sauk Centre
Annual Benefit 500 6,500 1,100 1,200 1,000 800 2,500 2,775 1,500 1,300 900 1,400 1,250 1,750 1,500 2,600 395 400 1,600 6,900 800 975 1,700 750 800 760 2,800 500 2,519 1,650 1,200 2,100 1,775 1,800 500 1,200 2,100 2,200 2,400 1,200 550 1,750 2,530 1,550
Long-Term Disability Amount Type 500 Y/S 6,500 Y/S 1,100 Y/S 1,200 Y/S 800 Y/S 2,500 Y/S 2,775 Y/S 1,300 Y/S 900 Y/S 1,250 Y/S 1,750 Y/S 1,500 Y/S 2,600 Y/S 395 Y/S 400 Y/S 1,600 Y/S 6,900 Y/S 800 Y/S 975 Y/S 1,700 Y/S 800 Y/S 2,800 Y/S 2,519 Y/S 1,650 Y/S 1,200 Y/S 2,100 Y/S 1,775 Y/S 1,800 Y/S 500 Y/S 1,200 Y/S 2,100 Y/S 2,200 Y/S 2,400 Y/S 1,200 Y/S 550 Y/S 1,750 Y/S 2,530 Y/S 1,550 Y/S
Short-Term Disability Amount Type 5 Day -
Survivor Benefit Amount Type 500 Y/S 6,500 Y/S 1,100 Y/S 1,200 Y/S 1,000 Y/S 800 Y/S 2,500 Y/S 2,775 Y/S 1,500 Y/S 1,300 Y/S 900 Y/S 1,400 Y/S 1,250 Y/S 1,750 Y/S 1,500 Y/S 2,600 Y/S 395 Y/S 400 Y/S 1,600 Y/S 6,900 Y/S 800 Y/S 975 Y/S 1,700 Y/S 750 Y/S 800 Y/S 760 Y/S 2,800 Y/S 500 Y/S 2,519 Y/S 1,650 Y/S 1,200 Y/S 2,100 Y/S Y/S 1,775 1,800 Y/S 500 Y/S 1,200 Y/S 2,100 Y/S 2,200 Y/S 2,400 Y/S 1,200 Y/S 550 Y/S 1,750 Y/S 2,530 Y/S 1,550 Y/S
Key: Bal = Balance of Account; Lump = Lump-Sum; M/S = Per Month, Per Year of Service; MO = Month; Y/S = Per Year of Service
143
Table 6-A Benefit Amounts for Lump-Sum Plans For the Year Ended December 31, 2011
Relief Association Sauk Rapids Scandia Valley Schroeder Sebeka Sedan Shafer Shakopee Shelly Sherburn Shevlin Silica Silver Bay Silver Lake Slayton Sleepy Eye Solway Solway Rural South Haven Spicer Spring Grove Spring Valley Springfield Squaw Lake Stacy-Lent Area Staples Starbuck Stephen Stewart Stewartville Stillwater Storden Sturgeon Lake Sunburg Taconite Taunton Taylors Falls Thief River Falls Thomson Tofte Tower Tracy Trimont Truman Twin Lakes (City)
Annual Benefit 3,500 1,250 800 1,500 150 825 7,500 300 1,250 600 675 1,100 850 1,500 1,900 1,150 500 1,000 1,300 700 1,410 1,250 400 1,100 1,400 850 500 1,000 2,200 5,000 600 525 450 850 300 1,400 3,000 1,600 1,015 600 1,300 1,050 800 450
Long-Term Disability Amount Type 3,500 Y/S 800 Y/S 1,500 Y/S 825 Y/S 7,500 Y/S 300 Y/S 1,250 Y/S 600 Y/S 1,100 Y/S 850 Y/S 1,500 Y/S 1,900 Y/S 1,150 Y/S 500 Y/S 1,000 Y/S 1,300 Y/S 1,410 Y/S 1,250 Y/S 400 Y/S 1,100 Y/S 850 Y/S 1,000 Y/S 2,200 Y/S 5,000 Y/S 600 Y/S 525 Y/S 450 Y/S 1,400 Y/S 1,015 Y/S 600 Y/S 1,300 Y/S 1,050 Y/S 800 Y/S 450 Y/S
Short-Term Disability Amount Type 75 Week 20 Day 15 Day 5 Day 10 Week -
Survivor Benefit Amount Type 3,500 Y/S 1,250 Y/S 800 Y/S 1,500 Y/S 825 Y/S 7,500 Y/S 300 Y/S 1,250 Y/S 600 Y/S 675 Y/S 1,100 Y/S 850 Y/S 1,500 Y/S 1,900 Y/S 1,150 Y/S 500 Y/S 1,000 Y/S 1,300 Y/S 700 Y/S 1,410 Y/S 1,250 Y/S 400 Y/S 1,100 Y/S 1,400 Y/S 850 Y/S 500 Y/S 1,000 Y/S 2,200 Y/S 5,000 Y/S 600 Y/S 525 Y/S 450 Y/S 850 Y/S 300 Y/S 1,400 Y/S 3,000 Y/S 1,600 Y/S 1,015 Y/S 600 Y/S 1,300 Y/S 1,050 Y/S 800 Y/S 450 Y/S
Key: Bal = Balance of Account; Lump = Lump-Sum; M/S = Per Month, Per Year of Service; MO = Month; Y/S = Per Year of Service
144
Table 6-A Benefit Amounts for Lump-Sum Plans For the Year Ended December 31, 2011
Relief Association Twin Lakes (VFD) Two Harbors Tyler Upsala Vadnais Heights Vergas Verndale Vernon Center Vesta Victoria Vining Wabasha Waconia Wadena Waite Park Waldorf Walker Walnut Grove Walters Warren Warroad Waseca Watertown Waterville Watkins Watson Waubun Waverly Welcome Wendell West Concord Westbrook Wheaton Willmar Willow River Wilmont Wilson Windom Winnebago Winsted Wolf Lake Wood Lake Woodbury Woodstock
Annual Benefit 450 2,400 500 450 3,600 820 1,400 500 500 2,000 400 1,400 2,500 1,970 2,050 500 2,500 550 400 625 800 3,100 2,100 1,300 930 1,025 600 1,400 875 600 1,000 650 1,800 2,400 600 450 600 2,300 800 1,500 800 500 6,720 625
Long-Term Disability Amount Type 2,400 Y/S 500 Y/S 450 Y/S 1,400 Y/S 500 Y/S 500 Y/S 2,000 Y/S 400 Y/S 2,500 Y/S 1,970 Y/S 2,050 Y/S 2,500 Y/S 550 Y/S 625 Y/S 800 Y/S 2,100 Y/S 1,300 Y/S 930 Y/S 1,025 Y/S 600 Y/S 1,400 Y/S 875 Y/S 600 Y/S 1,000 Y/S 650 Y/S 1,800 Y/S 2,400 Y/S 600 Y/S 450 Y/S 600 Y/S 2,300 Y/S 800 Y/S 1,500 Y/S 500 Y/S 6,720 Y/S 625 Y/S
Short-Term Disability Amount Type 100 Week -
Survivor Benefit Amount Type 450 Y/S 2,400 Y/S 500 Y/S 450 Y/S 3,600 Y/S 820 Y/S 1,400 Y/S 500 Y/S 500 Y/S 2,000 Y/S 400 Y/S 1,400 Y/S 2,500 Y/S 1,970 Y/S 2,050 Y/S 500 Y/S 2,500 Y/S 550 Y/S 400 Y/S 625 Y/S 800 Y/S 3,100 Y/S 2,100 Y/S 1,300 Y/S 930 Y/S 1,025 Y/S 600 Y/S 1,400 Y/S 875 Y/S 600 Y/S 1,000 Y/S 650 Y/S 1,800 Y/S 2,400 Y/S 600 Y/S 450 Y/S 600 Y/S 2,300 Y/S 800 Y/S 1,500 Y/S 800 Y/S 500 Y/S 6,720 Y/S 625 Y/S
Key: Bal = Balance of Account; Lump = Lump-Sum; M/S = Per Month, Per Year of Service; MO = Month; Y/S = Per Year of Service
145
Table 6-A Benefit Amounts for Lump-Sum Plans For the Year Ended December 31, 2011
Relief Association Wrenshall Wright Wykoff Wyoming Zimmerman Zumbro Falls
Annual Benefit 500 825 1,200 1,150 3,600 1,200
Long-Term Disability Amount Type 500 Y/S 1,200 Y/S 1,150 Y/S 3,600 Y/S 1,200 Y/S
Short-Term Disability Amount Type 20 Day -
Survivor Benefit Amount Type 500 Y/S 825 Y/S 1,200 Y/S 1,150 Y/S 3,600 Y/S 1,200 Y/S
* Due to space limitations, certain benefit bylaw provisions cannot be summarized in this Table.
Key: Bal = Balance of Account; Lump = Lump-Sum; M/S = Per Month, Per Year of Service; MO = Month; Y/S = Per Year of Service
146
Table 6-B Benefit Amounts for Defined-Contribution Plans For the Year Ended December 31, 2011
Relief Association Alaska Andover Anoka-Champlin Ashby Austin Brewster Brooklyn Park Callaway Cloquet Area Fire District Cologne Columbia Heights Coon Rapids Crosslake Dakota Dalbo Dilworth Donnelly Eagan Edina Elbow Lake Elgin Ellsburg Embarrass Erskine Falcon Heights Fisher Fosston Fountain Freeport Fridley Gary Gibbon Glenville Goodhue Gunflint Trail Hardwick Hawley Ivanhoe Kelsey Kenyon Kerkhoven Kiester Lake George Lakeport
Annual Benefit Bal Bal Bal Bal Bal Bal Bal Bal Bal Bal Bal Bal Bal Bal Bal Bal Bal Bal Bal Bal Bal Bal Bal Bal Bal Bal Bal Bal Bal Bal Bal Bal Bal Bal Bal Bal Bal Bal Bal Bal Bal Bal Bal Bal
Long-Term Disability Amount Type Bal Bal Bal Bal Bal Bal Bal Bal Bal Bal Bal Bal Bal Bal Bal Bal Bal Bal Bal Bal Bal Bal Bal Bal Bal Bal Bal Bal Bal Bal Bal Bal Bal Bal Bal
Short-Term Disability Amount Type $ 42 Week -
Survivor Benefit Amount Type Bal Bal Bal Bal Bal Bal Bal Bal Bal Bal Bal Bal Bal Bal Bal Bal Bal Bal Bal Bal Bal Bal Bal Bal Bal Bal Bal Bal Bal Bal Bal Bal Bal Bal Bal Bal Bal Bal Bal Bal Bal Bal
Key: Bal = Balance of Account; Lump = Lump-Sum; M/S = Per Month, Per Year of Service; MO = Month; Y/S = Per Year of Service
147
Table 6-B Benefit Amounts for Defined-Contribution Plans For the Year Ended December 31, 2011
Relief Association Le Center London Longville Lyle Magnolia Maple Grove Marietta Marine-On-Saint Croix Mazeppa Medicine Lake Mendota Heights Mentor Millerville Milroy Murdock Myrtle Nassau Nodine Northrop Odessa Oklee Plainview Plummer Ramsey Red Lake Falls Round Lake Rushford Rushmore Saint Hilaire Seaforth South Bend Swanville Toivola Ulen Underwood Vermilion Lake Viking Wabasso Wanamingo Wanda Wayzata Wells West Metro Williams
Annual Benefit Bal Bal Bal Bal Bal Bal Bal Bal Bal Bal Bal Bal Bal Bal Bal Bal Bal Bal Bal Bal Bal Bal Bal Bal Bal Bal Bal Bal Bal Bal Bal Bal Bal Bal Bal Bal Bal Bal Bal Bal Bal Bal Bal Bal
Long-Term Disability Amount Type Bal Bal Bal Bal Bal Bal Bal Bal Bal Bal Bal Bal Bal Bal Bal Bal Bal Bal Bal Bal Bal Bal Bal Bal Bal Bal Bal Bal Bal Bal Bal Bal Bal -
Short-Term Disability Amount Type 100 Week -
Survivor Benefit Amount Type Bal Bal Bal Bal Bal Bal Bal Bal Bal Bal Bal Bal Bal Bal Bal Bal Bal Bal Bal Bal Bal Bal Bal Bal Bal Bal Bal Bal Bal Bal Bal Bal Bal Bal Bal Bal Bal Bal Bal Bal Bal Bal
Key: Bal = Balance of Account; Lump = Lump-Sum; M/S = Per Month, Per Year of Service; MO = Month; Y/S = Per Year of Service
148
Table 6-B Benefit Amounts for Defined-Contribution Plans For the Year Ended December 31, 2011
Relief Association Winthrop Zumbrota
Annual Benefit Bal Bal
Long-Term Disability Amount Type Bal Bal
Short-Term Disability Amount Type -
Survivor Benefit Amount Type Bal Bal
* Due to space limitations, certain benefit bylaw provisions cannot be summarized in this Table.
Key: Bal = Balance of Account; Lump = Lump-Sum; M/S = Per Month, Per Year of Service; MO = Month; Y/S = Per Year of Service
149
This page is intentionally left blank.
Table 6-C Benefit Amounts for Other Plan Types For the Year Ended December 31, 2011 Long-Term Benefit Relief Association
Apple Valley Appleton Benson Brooklyn Center Chanhassen Chaska Eden Prairie Fairmont Glencoe Hutchinson Lake Johanna Minnetonka Mound New Ulm Pine City Pipestone Plymouth Robbinsdale Roseville Savage Spring Lake Park White Bear Lake Worthington
Annual
$
6,300 1,300 1,100 7,500 5,050 5,600 3,800 2,000 5,600 6,910 3,750 2,250 7,500 7,500 3,000 5,072 * 2,725
Disability
Monthly
$
Short-Term
42 4 4 24 21 24 56 25 13 15 34 53 29 25 8 3 24 13 30 33 34 * 17
Amount
$
Disability Type
1,300 1,100 5,050 24 56 3,800 2,000 5,600 53 3,750 7,500 7,500 3,000 5,072 34 * -
Survivor
Y/S Y/S Y/S M/S M/S Y/S Y/S Y/S M/S Y/S Y/S Y/S Y/S Y/S M/S * -
Amount
$
Benefit Type
5 5 * 35 170 20 25 25 -
Day Day * Day MO Day Week Day -
Amount
$
6,300 1,300 1,100 7,500 5,050 24 56 3,800 2,000 15 5,600 53 29 3,750 * 7,500 7,500 3,000 5,072 34 * 2,725
Type
Y/S Y/S Y/S Y/S Y/S M/S M/S Y/S Y/S M/S Y/S M/S M/S Y/S * Y/S Y/S Y/S Y/S M/S * Y/S
* Due to space limitations, certain benefit bylaw provisions cannot be summarized in this Table. All benefit levels are rounded to the nearest whole dollar.
Key: Bal = Balance of Account; Lump = Lump-Sum; M/S = Per Month, Per Year of Service; MO = Month; Y/S = Per Year of Service
151
This page is intentionally left blank.
How to Read Table 7
Table 7 provides relief association investment information. Market Value – The value of the relief association’s Special Fund investments as of December 31, 2011. % of Assets at SBI – Percentage of the relief association’s investments held in the State Board of Investment’s Supplemental Fund. Allocations as of 12/31/11 – Percentage of the relief association’s investments that are held in each asset class. “Other” includes all investments besides cash, stocks, and bonds, including small allocations to this asset class within mutual funds.
Rates of Return 2011 – The return on the relief association’s investments for calendar year 2011. 2011 Benchmark – The return on a hypothetical portfolio, explained in detail below. Above (Below) Benchmark – The 2011 Return minus the Benchmark Return. This figure shows how the relief association performed compared to its benchmark. 5-Yr – The relief association’s average annual return from 2007-2011. 10-Yr – The relief association’s average annual return from 2002-2011. Rank (%-ile) 10-Yr Return – The relief association’s ranking by its ten-year return. The highest ten-year average annual return is ranked at 100 percent, while the lowest ten-year average annual return is ranked at 0 percent. For example, a 75 percent rank means the relief association’s average annual return is higher than the return earned by 75 percent of relief associations.
Benchmark Return The benchmark return is included as a comparison tool for relief associations. The benchmark return shows what the relief association could have earned, had it invested its assets passively for the entire year. Passive investment means using index funds that track a specific index. Index funds are widely available for stocks and bonds. For cash, a
153
relief association could have invested in a proven money market fund or shopped for the highest-returning certificates of deposit. The benchmark return is calculated for each relief association by multiplying the association’s asset class proportions by the rate of return earned on a common benchmark index for each asset class. If a relief association changed investment strategies during the year, the calculated benchmark return will not reflect the changes.
Benchmark Calculation Example January 1, 2011 Asset Allocation (a) Domestic Stock 40.0% International Stock 9.5% Bonds 25.6% Cash 14.9% Other 10.0% Benchmark Return
Benchmark
Return (a) x (b) (b) (c) Russell 3000 1.0% 0.4% MSCI ACWI ex. U.S. (13.7)% (1.3)% Barclays Capital Aggregate 7.8% 2.0% 90-Day U.S. T-Bill 0.1% 0.0% Russell 3000 1.0% 0.1% Sum (c) = 1.2%
Common Benchmark Indices Russell 3000 Index – A measure of the overall U.S. stock market. This index includes the 3,000 largest publicly traded U.S. companies. MSCI ACWI ex. U.S. Index – A measure of the performance of international stocks, including developed markets and emerging markets. This index does not include the U.S. stock market’s performance. Barclays Capital Aggregate Index – A measure of the performance of the U.S. investment grade bond market, including corporate and government bonds. 90-Day U.S. T-Bill – A measure of short-term cash investments.
154
155
Relief Association SBI Income Share Voluntary Statewide Plan Ada Adams Adrian Aitkin Alaska Albany Albert Lea Township Albertville Almelund Alpha Altura Amboy Andover Annandale Anoka-Champlin Apple Valley Appleton Argyle Arlington Arrowhead Ashby Askov Atwater Audubon Aurora Austin Avon Babbitt Backus Badger Bagley Balaton Baldwin Balsam Barnesville
$
284,919 190,110 329,917 497,955 123,211 417,548 92,117 509,857 331,718 107,416 112,373 155,689 3,059,505 642,387 3,159,270 4,401,850 247,127 114,031 383,112 86,117 276,187 175,562 258,748 281,808 221,020 733,610 364,581 319,659 284,072 95,242 299,519 157,050 325,107 186,378 180,929
Market Value
% of Assets at SBI
Rank (%-ile) Allocations as of 12/31/11 Rates of Return (%) 2011 (Below) U.S. Stock Int'l Stock Bond Cash Other 10-Yr % % % % % 2011 Benchmark Benchmark 5-Yr 10-Yr Return 92 % 60.0 % - % 35.0 % 5.0 % - % 3.0 % 3.3 % (0.3) % 2.9 % 4.7 % A 35.0 15.0 45.0 5.0 1.2 1.8 (0.6) A A - % 50.0 11.6 6.7 31.2 0.5 (2.8) (0.6) (2.2) 1.0 2.8 33 100.0 1.4 0.1 1.3 2.5 2.7 31 45.0 24.2 13.0 14.0 3.8 3.5 (1.9) 5.4 2.8 4.8 93 42.4 11.4 22.4 23.1 0.7 (4.2) 1.1 (5.3) 0.4 3.8 71 35.8 27.0 4.1 4.1 64.8 1.8 0.0 1.8 2.5 4.0 79 27.1 18.9 31.7 19.1 3.2 (4.0) (1.0) (3.0) 0.4 2.9 36 27.2 20.9 36.0 13.8 2.1 (1.1) (1.6) 0.5 1.2 4.1 81 15.8 32.9 5.2 41.3 19.5 1.1 (2.9) 1.4 (4.3) 0.9 2.3 19 99.8 45.3 14.1 40.6 1.4 1.5 (0.1) 4.0 5.2 97 78.3 2.7 19.0 5.1 2.6 2.5 (2.5) 1.2 5 24.2 12.0 34.6 28.6 0.6 (2.3) 0.6 (2.9) 4.2 3.8 71 58.7 40.6 18.1 41.3 2.0 1.8 0.2 1.7 3.3 52 64.1 6.0 13.4 16.1 0.4 (1.7) 2.6 (4.3) 0.1 3.2 48 33.3 14.0 24.0 27.2 1.5 (2.4) 0.1 (2.5) 1.2 3.8 71 40.4 17.9 38.2 3.0 0.5 (3.0) 1.8 (4.8) (3.9) 1.6 8 34.4 11.4 34.5 18.7 1.0 (3.1) 0.6 (3.7) 1.0 3.2 48 31.5 16.6 23.3 27.5 1.1 (3.1) (0.2) (2.9) 0.0 3.4 56 36.0 32.4 1.9 16.7 47.3 1.7 (1.6) 2.6 (4.2) (4.0) 0.5 2 46.8 22.1 11.4 18.7 1.0 (5.5) (2.2) (3.3) 0.3 3.3 52 78.1 40.1 19.4 40.5 2.5 2.8 (0.3) 0.6 A A 5.4 6.2 68.3 20.1 0.6 (0.7) 1.3 3.3 3.3 52 100.0 0.7 0.1 0.6 1.6 3.0 41 39.8 9.1 19.4 31.0 0.7 (1.5) 0.0 (1.5) 1.4 3.5 61 97.2 41.0 52.8 6.2 3.6 4.1 (0.5) 3.9 4.5 89 22.5 12.0 39.1 26.9 (0.5) (2.4) 0.3 (2.7) (1.9) 1.5 7 59.4 58.6 1.4 12.2 25.7 2.1 1.2 1.4 (0.2) 1.4 3.5 61 10.5 10.5 69.8 18.7 1.0 (0.8) 5.0 (5.8) 1.6 2.5 24 93.1 73.8 0.9 17.6 7.7 4.3 3.2 1.1 3.0 4.7 92 23.6 51.2 22.0 6.6 19.0 1.2 (6.9) (2.0) (4.9) (4.6) 0.9 4 9.8 18.6 44.2 27.0 0.4 (0.7) 0.4 (1.1) 1.0 2.4 22 50.0 26.6 21.6 51.8 3.4 2.3 1.1 4.0 4.9 94 9.1 0.5 15.3 73.6 1.5 1.1 1.3 (0.2) 1.1 2.3 19 50.7 8.8 18.3 21.2 1.0 (3.1) (1.2) (1.9) 1.4 A A 99.7 72.0 24.1 3.9 2.2 2.7 (0.5) 1.4 3.9 74 59.8 17.6 0.3 22.2 0.1 (4.0) (2.0) (2.0) 0.8 2.5 24
Table 7 Rates of Return and Asset Allocation For the Year Ended December 31, 2011
156
Relief Association Barnum Barrett Battle Lake Baudette Bayport Beardsley Beaver Bay Beaver Creek Becker Belgrade Belle Plaine Bellingham Belview Bemidji Benson Bertha Bethel Big Lake Bigelow Bigfork Bird Island Biwabik City Blackduck Blackhoof Blooming Prairie Blue Earth Bluffton Bovey Bowlus Boyd Braham Brainerd Brandon Breckenridge Breitung Brevator Brewster
Market Value 198,101 110,282 407,588 436,082 1,452,043 159,591 115,220 128,913 869,819 294,105 437,927 166,802 213,282 2,204,694 258,234 132,992 84,900 1,052,952 127,872 176,015 181,754 200,797 145,752 100,488 341,757 816,989 130,409 125,429 122,215 158,331 268,008 2,270,376 7,602 377,998 104 126,311 259,730
% of Assets at SBI 60.5 94.2 28.4 47.7 54.6 84.8 52.3 20.2 24.9 15.9 U.S. Stock % 50.0 27.2 10.8 30.3 66.6 45.9 13.9 40.4 29.0 51.9 32.3 47.0 30.3 41.1 60.7 30.7 23.7 73.4 40.6 29.5 61.2 15.9 34.5 59.6 38.3 75.0 51.0 34.5 23.2 35.8 29.2 23.9 21.1
Allocations as of 12/31/11 Int'l Stock Bond Cash % % % 10.0 40.0 15.1 26.9 30.7 2.3 73.3 13.4 10.3 44.3 13.6 1.5 20.7 10.9 18.3 29.9 5.9 100.0 19.6 66.3 14.9 29.6 13.0 13.5 30.0 23.4 10.5 18.5 17.8 23.6 6.3 36.6 100.0 12.7 26.0 13.8 27.4 42.3 11.8 47.1 6.2 28.0 3.8 6.4 17.9 44.2 10.5 31.5 33.7 8.2 2.8 15.6 10.3 49.1 36.6 8.2 23.3 23.7 0.6 14.4 10.6 44.9 12.6 2.0 31.8 31.0 4.1 12.7 23.2 16.7 38.9 3.6 25.0 8.6 30.9 8.5 2.4 3.2 59.9 15.9 23.5 37.9 17.4 29.1 13.3 100.0 14.1 18.1 37.5 100.0 24.7 43.4 6.9 8.9 15.2 40.3 Other % 0.1 0.2 1.5 0.3 0.2 2.1 4.1 1.3 1.2 0.5 1.3 0.8 0.6 2.4 0.1 16.0 0.7 0.4 2.5 1.0 (0.5) 4.4 1.1 1.1 14.5 2011 1.7 (1.8) 0.6 (0.8) (0.5) (1.1) 3.0 1.7 (2.9) (3.1) (4.6) (3.6) 0.5 (2.6) 2.1 1.6 3.0 (0.3) (1.2) (0.1) 1.3 (9.9) (4.9) (1.3) 0.4 (3.6) (2.9) 5.7 (0.1) (0.1) (1.0) (4.8) (3.5) 0.7 0.1 (0.4) (0.3)
Table 7 Rates of Return and Asset Allocation For the Year Ended December 31, 2011 Rates of Return (%) 2011 (Below) Benchmark Benchmark 1.3 0.4 (0.4) (1.4) 5.6 (5.0) 1.4 (2.2) 1.9 (2.4) (0.3) (0.8) 0.1 2.9 1.4 0.3 0.3 (3.2) (0.8) (2.3) 0.2 (4.8) (3.1) (0.5) 0.1 0.4 (0.9) (1.7) 2.3 (0.2) 1.5 0.1 2.3 0.7 0.3 (0.6) 0.9 (2.1) (0.3) 0.2 1.3 0.0 (3.1) (6.8) (3.9) (1.0) 1.5 (2.8) 2.7 (2.3) (0.8) (2.8) 0.6 (3.5) 0.7 5.0 1.8 (1.9) 0.3 (0.4) 0.7 (1.7) (0.1) (4.7) (1.9) (1.6) (0.5) 1.2 1.4 (1.3) (0.4) 0.0 0.3 (0.6) 5-Yr 2.2 0.3 4.4 2.2 1.9 0.8 2.9 0.5 1.7 1.1 0.6 2.2 2.7 2.0 0.7 1.7 1.8 2.3 1.1 1.3 1.8 (1.6) (1.0) 1.9 1.9 (0.4) 1.2 0.6 (4.9) 1.5 1.9 1.8 (0.6) 0.8 0.0 0.3 1.8
10-Yr 4.7 1.5 4.9 4.1 3.3 4.2 3.1 1.7 3.0 3.6 3.4 4.6 3.0 4.6 3.2 3.0 2.9 3.8 2.5 3.1 3.0 2.2 1.3 2.8 3.8 3.2 3.4 2.2 (0.4) 2.0 3.0 4.2 1.7 2.8 3.0 2.3 2.6
Rank (%-ile) 10-Yr Return 92 7 94 81 52 83 45 9 41 65 56 90 41 90 48 41 36 71 24 45 41 17 6 33 71 48 56 17 0 13 41 83 9 33 41 19 27
157
Relief Association Bricelyn Brimson Brook Park Brooklyn Center Brooklyn Park Brooten Browerville Browns Valley Brownsdale Brownsville Brownton Buffalo Buffalo Lake Buhl Butterfield Byron Caledonia Callaway Calumet Cambridge Campbell Canby Cannon Falls Canosia Canton Carlos Carlton Carsonville Carver Cass Lake Centennial Center City Ceylon Chandler Chanhassen Chaska Chatfield
Market Value 233,125 81,902 133,166 3,125,724 6,763,077 225,218 274,383 135,680 270,168 94,116 272,727 1,082,381 344,550 59,225 205,631 330,300 369,883 134,324 224,478 353,069 177,440 367,278 544,003 324,757 71,978 728,603 197,429 1,711 521,490 413,895 2,307,797 315,015 174,931 170,235 2,190,668 3,998,279 334,830
% of Assets at SBI 100.0 98.1 99.9 66.4 88.9 70.5 15.9 92.6 73.2 60.6 86.8 73.3 U.S. Stock % 48.4 47.2 45.0 77.9 66.4 9.8 41.2 30.0 53.3 55.7 48.5 57.4 34.1 55.8 25.8 49.4 51.1 0.2 67.9 44.1 12.9 58.4 42.7 99.1 41.8 44.8 46.3 38.5 73.6 25.2 66.1 27.8 49.0
Allocations as of 12/31/11 Int'l Stock Bond Cash % % % 100.0 10.0 35.1 6.5 14.6 29.7 8.6 1.6 27.5 25.2 3.4 16.3 2.4 33.6 3.7 4.7 81.6 3.8 54.9 33.2 1.5 34.9 9.0 23.4 14.3 4.3 12.4 27.5 4.8 10.8 35.3 11.4 31.2 65.9 100.0 25.6 2.5 15.2 11.9 28.4 33.1 100.0 25.3 10.5 13.4 4.2 39.1 5.0 46.9 52.1 9.5 12.7 9.9 23.2 18.2 10.8 100.0 1.3 85.8 8.5 18.9 8.9 8.6 21.3 27.4 0.9 8.2 21.0 27.8 11.8 20.2 21.8 9.5 24.1 19.4 4.1 16.3 41.1 11.5 14.9 1.9 16.6 56.3 3.5 13.2 16.8 7.3 12.4 52.2 13.5 9.4 28.1 Other % (0.1) 0.7 0.2 0.1 0.4 0.1 0.6 0.9 0.8 1.4 0.6 0.8 3.7 5.3 1.2 1.4 0.7 0.4 0.3 2011 3.0 1.2 3.6 (4.5) 1.2 0.4 1.3 (0.7) (3.1) 0.0 (1.2) (5.4) 1.1 (6.2) 1.1 (7.9) (1.0) 2.4 (5.7) (4.2) 5.0 (0.3) (5.6) 1.3 (0.1) 1.5 0.3 0.1 (0.9) (3.2) (1.9) 1.0 (0.3) 1.8 (3.3) (0.1) (1.9)
Table 7 Rates of Return and Asset Allocation For the Year Ended December 31, 2011 Rates of Return (%) 2011 (Below) Benchmark Benchmark 3.2 (0.2) 0.7 0.5 0.1 3.5 0.4 (4.9) 1.5 (0.3) 0.7 (0.3) (0.3) 1.6 (0.1) (0.6) (4.5) 1.4 1.1 (1.1) 0.3 (1.5) 0.5 (5.9) 1.6 (0.5) (1.7) (4.5) 0.1 1.0 (2.4) (5.5) 0.2 (1.2) 0.1 2.3 (1.9) (3.8) 3.3 (7.5) (0.3) 5.3 0.1 (0.4) (0.2) (5.4) 0.1 1.2 0.1 (0.2) 0.1 1.4 0.8 (0.5) 1.6 (1.5) 0.8 (1.7) (0.5) (2.7) (0.4) (1.5) 1.0 0.0 1.4 (1.7) 1.5 0.3 0.9 (4.2) (0.5) 0.4 (0.9) (1.0) 5-Yr 2.9 2.7 (3.2) 1.2 1.2 0.4 1.3 2.1 (1.1) 1.0 1.8 0.3 1.5 (0.4) 2.5 (1.4) 1.0 3.4 0.2 (3.0) 3.0 1.4 0.3 2.5 1.9 1.1 (6.2) 1.6 2.3 1.3 (0.7) 2.4 0.6 2.2 1.0 1.4 1.6
10-Yr 4.7 1.7 1.7 5.0 4.1 3.5 2.2 3.5 4.2 2.5 4.0 1.8 3.5 0.1 2.7 1.2 3.4 4.1 3.5 0.8 3.4 2.6 3.0 2.5 2.7 3.4 0.6 3.0 3.7 3.6 2.4 3.1 3.0 3.6 4.6 3.3 3.6
Rank (%-ile) 10-Yr Return 92 9 9 96 81 61 17 61 83 24 79 10 61 1 31 5 56 81 61 3 56 27 41 24 31 56 2 41 68 65 22 45 41 65 90 52 65
158
Relief Association Cherry Chisago Chisholm Chokio Clara City Claremont Clarissa Clarkfield Clarks Grove Clear Lake Clearbrook Clearwater Clements Cleveland Clifton Climax Clinton (Big Stone) Cloquet Area Fire District Cohasset Cokato Cold Spring Coleraine Cologne Columbia Heights Colvill Colvin Comfrey Cook Coon Rapids Cosmos Cottage Grove Cotton Cottonwood Courtland Cromwell Crooked Lake Crookston
Market Value 136,978 681,919 574,619 164,973 308,558 82,150 141,156 263,282 138,838 476,195 133,350 338,325 129,891 415,207 270,772 101,712 87,879 116,734 607,596 527,419 899,019 196,813 367,037 1,307,886 C 61,037 201,730 335,756 6,132,013 193,404 1,776,676 158,389 338,506 312,288 333,340 142,110 493,217
% of Assets at SBI 80.8 95.8 78.0 46.1 82.5 99.3 25.0 98.8 33.5 U.S. Stock % 66.4 46.5 76.1 46.8 46.5 54.4 22.8 43.0 23.5 74.6 41.3 27.8 43.2 74.5 17.3 31.5 15.7 54.7 33.6 27.8 15.7 52.1 70.5 41.0 25.7 45.5 32.7 38.3 39.5 32.4 26.9 25.2 22.7 30.8
Allocations as of 12/31/11 Int'l Stock Bond Cash % % % 30.6 3.0 12.5 34.1 6.9 5.9 6.1 7.5 27.3 25.9 9.4 7.1 35.6 1.2 8.8 35.2 23.3 53.9 36.5 20.5 10.2 23.3 43.0 22.7 2.7 14.0 21.4 23.1 23.3 33.6 12.9 14.4 22.2 15.9 25.5 19.3 58.5 (0.4) 100.0 24.5 10.2 32.1 9.0 75.3 5.0 13.8 11.1 17.0 30.6 17.1 15.1 28.9 25.6 4.1 7.2 72.7 5.7 15.0 25.9 28.3 1.2 11.9 36.0 5.7 100.0 1.3 28.0 44.9 2.3 43.5 8.4 17.8 26.3 21.1 9.9 41.9 9.5 3.9 19.5 37.0 7.1 52.5 7.6 12.9 12.4 46.5 13.9 20.9 37.9 9.8 54.5 10.7 11.4 42.3 13.8 Other % 4.4 1.4 0.4 0.2 2.4 4.3 5.3 1.7 15.4 1.7 2.6 0.3 1.3 5.4 0.1 0.3 2.1 0.4 0.1 0.4 1.3 2.1 2.3 1.7 2011 2.2 0.7 (2.9) 2.5 (2.2) (3.6) 1.9 3.2 (2.1) 1.9 2.1 (3.1) (3.5) (0.7) 0.7 0.7 (1.4) 3.3 (1.9) (3.0) (2.3) (0.3) (3.7) 1.8 (0.1) (1.3) 1.0 1.0 3.3 (2.8) (1.7) (0.8) 1.3 1.5 (4.2) 3.0 (0.8)
Table 7 Rates of Return and Asset Allocation For the Year Ended December 31, 2011 Rates of Return (%) 2011 (Below) Benchmark Benchmark 2.9 (0.7) 1.0 (0.3) (1.9) (1.0) 3.0 (0.5) (0.2) (2.0) 1.6 (5.2) 1.9 0.0 3.5 (0.3) (1.3) (0.8) 2.4 (0.5) 0.6 1.5 1.5 (4.6) (0.9) (2.6) 0.7 (1.4) 2.0 (1.3) 0.1 0.6 (2.8) 1.4 3.4 (0.1) 0.7 (2.6) 0.0 (3.0) 0.2 (2.5) (0.2) (0.1) (0.3) (3.4) 2.5 (0.7) 0.6 (0.7) 2.2 (3.5) 0.1 0.9 2.7 (1.7) 3.6 (0.3) (1.0) (1.8) 1.7 (3.4) 1.6 (2.4) 2.7 (1.4) 0.1 1.4 (1.1) (3.1) 3.8 (0.8) 1.4 (2.2) 5-Yr 5.4 2.0 (0.4) 2.1 1.0 (2.1) 1.7 2.7 (0.3) 1.1 (0.9) 1.0 1.0 4.1 2.4 2.4 1.5 0.7 2.4 (0.6) 3.4 1.1 (1.1) 1.7 6.4 (2.9) 2.3 1.3 4.0 (0.1) 0.6 0.8 1.7 1.3 0.9 2.3 2.3
10-Yr 5.0 4.2 2.2 3.5 4.1 1.3 2.8 4.3 3.2 3.8 3.3 3.6 3.2 3.7 3.6 2.2 2.9 A 4.6 1.3 4.6 1.9 2.2 3.9 A 1.9 2.3 2.7 5.5 2.3 2.6 1.8 3.2 3.9 2.6 1.9 4.2
Rank (%-ile) 10-Yr Return 96 83 17 61 81 6 33 86 48 71 52 65 48 68 65 17 36 A 90 6 90 12 17 74 A 12 19 31 98 19 27 10 48 74 27 12 83
159
Relief Association Crosby Crosslake Culver Currie Cuyuna Cyrus Dakota Dalbo Dalton Danube Danvers Darfur Dassel Dawson Dayton Deer Creek Deer River Deerwood Delano Delavan Dent Detroit Lakes Dexter Dilworth Dodge Center Donnelly Dover Dovray Dumont Dunnell Eagan Eagle Bend Eagle Lake East Bethel East Grand Forks Eastern Hubbard Easton
Market Value 356,259 881,059 46,451 121,463 161,077 118,652 96,040 332,568 234,297 149,223 83,733 185,583 815,330 310,571 508,905 153,726 339,422 274,972 684,462 170,160 236,713 1,740,637 151,649 608,587 526,649 160,162 217,876 39,890 117,931 120,018 8,196,053 257,050 257,405 1,117,122 772,892 253,665 140,437
% of Assets at SBI 56.6 99.8 63.3 67.7 93.9 7.6 99.6 99.7 U.S. Stock % 30.9 64.2 35.3 38.0 25.9 45.7 23.1 27.2 26.8 41.5 36.6 79.4 36.2 31.5 14.0 18.0 32.5 25.2 53.9 37.5 45.1 47.3 23.5 3.1 46.1 2.9 47.9 59.9 19.4 37.9
Allocations as of 12/31/11 Int'l Stock Bond Cash % % % 19.6 34.0 11.2 6.3 14.7 14.1 11.0 12.3 40.3 100.0 9.5 39.1 13.0 8.4 22.3 43.4 52.3 2.0 27.7 31.6 12.0 100.0 9.8 33.0 29.9 100.0 100.0 13.5 40.0 19.0 19.1 39.4 9.6 53.8 12.7 7.9 17.8 36.2 6.4 9.2 30.0 27.9 13.4 56.5 15.8 7.6 11.7 61.8 25.6 2.5 38.3 9.7 58.9 4.4 100.0 15.9 1.7 27.3 10.8 23.7 27.5 11.4 4.3 31.2 14.1 27.3 11.3 0.3 76.2 100.0 5.4 15.6 74.5 16.1 32.2 4.8 3.2 5.9 87.8 100.0 18.2 31.0 (0.7) 34.9 5.2 8.0 4.1 67.9 15.5 10.3 34.9 Other % 4.3 0.7 1.1 0.4 5.6 0.1 0.7 3.4 1.4 0.3 0.9 1.1 1.8 1.2 0.5 8.0 1.4 0.8 0.2 3.6 0.6 1.4 2011 (1.9) (2.1) (2.1) 2.4 0.8 1.4 3.9 (3.0) 2.0 (0.7) 1.3 1.4 (0.7) 2.0 0.3 0.7 (4.9) (1.4) (0.8) 0.2 (5.3) 1.9 2.0 (2.2) (2.3) (4.3) 0.0 (1.1) 1.1 1.3 (2.9) 0.8 1.0 (4.1) 3.0 0.9 (4.3)
Table 7 Rates of Return and Asset Allocation For the Year Ended December 31, 2011 Rates of Return (%) 2011 (Below) Benchmark Benchmark 0.0 (1.9) 0.5 (2.6) 0.1 (2.2) 0.1 2.3 0.3 0.5 0.6 0.8 4.4 (0.5) 0.7 (3.7) 0.1 1.9 1.1 (1.8) 0.1 1.2 0.1 1.3 1.8 (2.5) 2.5 (0.5) 1.1 (0.8) 1.7 (1.0) (1.1) (3.8) 1.0 (2.4) (1.2) 0.4 0.2 (3.3) (2.0) 3.3 (1.4) 0.1 1.9 (1.5) (0.7) 0.2 (2.5) (0.3) (4.0) 0.5 (0.5) 0.3 (1.4) 0.1 1.0 1.4 (0.1) 0.3 (3.2) 0.0 0.8 0.1 0.9 (0.4) (3.7) 3.3 (0.3) (0.7) 1.6 (1.1) (3.2) 5-Yr (0.6) 1.2 0.5 3.4 2.0 1.5 3.3 1.5 3.4 1.5 2.8 3.0 (0.4) 1.1 0.5 0.6 (1.3) 1.2 (0.9) (3.4) 0.0 4.0 3.3 (0.2) 1.5 0.6 3.0 1.1 2.6 1.4 0.6 2.2 (2.4) 0.0 2.9 0.1 (1.9)
10-Yr 2.7 5.0 A 3.5 3.6 3.2 2.8 5.5 3.3 3.5 3.0 2.7 1.7 2.9 2.4 3.4 2.2 2.8 2.5 0.3 2.8 5.2 3.4 2.9 2.4 3.3 4.4 A 2.7 2.9 3.0 2.3 0.2 3.5 4.7 2.2 1.6
Rank (%-ile) 10-Yr Return 31 96 A 61 65 48 33 98 52 61 41 31 9 36 22 56 17 33 24 2 33 97 56 36 22 52 87 A 31 36 41 19 1 61 92 17 8
160
Relief Association Echo Eden Prairie Eden Valley Edgerton Edina Eitzen Elbow Lake Elgin Elizabeth Elk River Elko New Market Ellendale Ellsburg Ellsworth Elmer Elmore Elrosa Ely Elysian Embarrass Emily Erskine Evansville Eveleth Excelsior Eyota Fairfax Fairmont Fairmont Police Falcon Heights Farmington Fayal Federal Dam Fergus Falls Fertile Fifty Lakes Finland
Market Value 191,019 16,841,826 431,861 253,696 6,943,991 151,953 262,431 292,959 134,530 2,266,438 1,314,721 131,093 C 252,059 78,652 200,248 315,916 534,940 312,043 C 180,278 150,830 156,743 388,571 3,573,611 292,249 253,923 1,383,498 7,260,946 1,194,405 1,566,440 339,232 82,651 2,092,319 254,868 89,992 209,664
% of Assets at SBI 99.3 99.6 58.8 24.5 99.8 99.9 98.8 99.6 U.S. Stock % 30.9 39.2 60.4 73.1 52.9 43.8 11.9 23.5 46.1 29.7 30.4 29.7 24.5 25.7 60.6 19.8 28.6 36.1 24.3 16.7 47.0 34.1 31.9 49.5 49.7 47.6 74.3 47.0 55.8 29.7 -
Allocations as of 12/31/11 Int'l Stock Bond Cash % % % 1.9 6.0 61.2 9.4 41.6 4.3 5.5 15.4 18.0 22.9 4.0 15.2 12.2 19.7 21.4 78.8 13.2 43.0 3.6 4.7 61.9 6.3 55.9 12.8 8.0 24.3 21.3 8.1 52.0 1.7 3.7 38.4 19.1 100.0 11.6 38.2 75.5 6.2 33.4 34.2 6.4 17.6 10.5 4.3 32.4 41.0 12.5 23.9 32.7 16.1 11.2 33.1 7.9 15.1 52.7 3.7 0.3 45.5 25.6 25.4 2.0 36.4 29.5 100.0 9.6 29.9 19.9 100.0 16.6 13.0 20.3 18.6 17.6 12.6 7.5 20.8 24.1 25.7 4.0 44.1 4.9 10.8 20.8 11.6 13.6 6.2 49.2 100.0 Other % 5.5 0.7 (0.2) 17.9 1.5 0.3 8.5 8.4 20.5 0.5 4.9 2.5 2.3 3.5 33.8 8.7 0.6 1.5 1.0 1.3 2011 (0.6) (2.3) (5.8) 2.3 (1.0) 2.3 1.8 0.5 0.9 (2.6) (0.2) (3.0) 0.9 1.8 6.3 0.6 (1.5) (1.9) 1.5 (1.2) (7.1) (2.7) (2.0) (4.5) (1.9) 3.1 1.8 0.5 3.6 (4.2) (5.2) 3.7 (5.3) 3.4 (2.3) 0.8 1.2
Table 7 Rates of Return and Asset Allocation For the Year Ended December 31, 2011 Rates of Return (%) 2011 (Below) Benchmark Benchmark 0.8 (1.4) (0.8) (1.5) 0.6 (6.4) 2.5 (0.2) (0.4) (0.6) 5.1 (2.8) 1.7 0.1 0.1 0.4 1.2 (0.3) (0.8) (1.8) 2.8 (3.0) 3.5 (6.5) 1.0 (0.1) 0.1 1.7 1.2 5.1 0.3 0.3 2.3 (3.8) 0.6 (2.5) 2.5 (1.0) (0.6) (0.6) 0.1 (7.2) (0.5) (2.2) 0.1 (2.1) (1.2) (3.3) (1.7) (0.2) 3.3 (0.2) 0.1 1.7 1.8 (1.3) 2.7 0.9 (1.3) (2.9) (1.5) (3.7) 1.5 2.2 0.8 (6.1) 2.6 0.8 0.7 (3.0) (1.0) 1.8 0.1 1.1 5-Yr 1.1 0.9 0.3 2.0 3.2 5.4 1.7 1.3 0.1 0.6 1.2 (6.0) 0.3 2.8 4.2 (1.1) 1.0 (0.2) 1.5 0.4 0.4 (0.7) 0.5 (1.0) 0.7 3.3 2.5 (0.1) 5.0 1.8 (0.7) 1.1 (0.1) 2.8 0.4 2.1 2.9
10-Yr 3.2 3.9 3.0 4.0 5.3 4.8 2.5 2.4 3.8 3.5 1.9 (1.9) 1.9 2.9 3.7 2.2 2.6 3.3 2.3 1.5 2.5 3.8 2.6 2.8 3.1 4.4 2.5 3.7 5.5 5.5 3.0 3.9 3.8 4.9 3.1 2.8 2.7
Rank (%-ile) 10-Yr Return 48 74 41 79 98 93 24 22 71 61 12 0 12 36 68 17 27 52 19 7 24 71 27 33 45 87 24 68 98 98 41 74 71 94 45 33 31
161
Relief Association Finlayson Fisher Flensburg Floodwood Foley Forada Forest Lake Foreston Fosston Fountain Franklin Frazee Fredenberg Freeport French Township Fridley Frost Fulda Garfield Garrison Garvin Gary Gaylord Geneva Ghent Gibbon Gilbert Glencoe Glenville Glenwood Glyndon Gnesen Golden Valley Gonvick Good Thunder Goodhue Goodland
Market Value 146,392 148,097 121,358 228,617 746,685 251,913 1,641,939 219,674 368,877 96,570 287,581 199,745 210,383 276,925 132,306 3,281,663 175,414 269,061 319,376 631,195 108,303 97,239 394,852 126,995 127,985 294,016 212,629 724,057 161,917 348,834 330,684 225,613 4,005,785 199,985 270,956 675,592 88,005
% of Assets at SBI 16.8 41.0 87.1 31.1 21.8 18.6 91.8 97.0 70.6 38.7 66.5 U.S. Stock % 33.0 20.0 66.2 30.5 48.6 52.4 24.0 15.8 41.0 43.1 13.7 18.8 77.1 43.5 26.6 4.9 33.1 29.5 41.8 21.1 12.1 37.5 12.1 13.6 61.0 43.4 56.5 46.1 54.5 41.8 67.6 38.8 22.4
Allocations as of 12/31/11 Int'l Stock Bond Cash % % % 100.0 6.0 26.5 34.3 12.2 5.6 60.7 0.9 14.0 18.6 11.3 45.5 8.2 6.4 7.1 37.8 17.9 17.7 0.1 15.2 28.7 30.1 100.0 7.2 5.6 71.0 59.0 11.6 33.3 9.7 2.3 51.8 32.2 8.1 21.9 50.8 10.7 0.1 11.8 53.4 3.1 4.0 69.4 0.2 94.9 6.0 9.8 51.0 14.0 32.8 23.2 7.3 7.2 43.2 100.0 1.4 17.6 59.3 7.0 37.5 37.7 10.3 39.7 12.3 6.9 1.6 78.9 11.5 15.3 57.6 5.7 8.3 24.9 15.5 26.5 14.6 38.9 4.6 3.5 47.0 3.3 100.0 9.4 23.6 12.2 3.9 8.3 45.7 4.7 14.5 13.2 23.4 15.9 20.2 24.9 16.2 34.4 Other % 0.2 1.5 0.3 4.5 0.1 11.9 2.0 0.4 2.3 0.4 0.3 0.1 0.5 0.5 0.6 5.7 0.2 0.5 2.0 0.1 0.1 0.3 0.3 1.7 2.1 2011 1.9 (1.2) (0.9) (3.8) (2.4) (3.1) (3.6) (1.0) 0.8 (0.2) 1.4 (2.9) (1.6) 3.2 (1.3) 0.6 1.1 2.7 0.3 (4.0) (1.1) 0.8 (0.1) (2.8) (0.1) 0.0 (1.8) (0.9) (0.9) 3.0 0.6 0.1 4.1 0.4 0.2 (2.7) 2.3
Table 7 Rates of Return and Asset Allocation For the Year Ended December 31, 2011 Rates of Return (%) 2011 (Below) Benchmark Benchmark 0.1 1.8 1.2 (2.4) (1.6) 0.7 2.4 (6.2) 2.7 (5.1) (0.5) (2.6) (2.0) (1.6) (1.0) 0.0 0.1 0.7 (0.2) 0.0 0.5 0.9 3.6 (6.5) (0.1) (1.5) 0.9 2.3 (1.7) 0.4 4.0 (3.4) 0.6 0.5 0.1 2.6 0.1 0.2 1.1 (5.1) 0.0 (1.1) 0.1 0.7 0.2 (0.3) 1.2 (4.0) 1.5 (1.6) (0.6) 0.6 (0.3) (1.5) 0.1 (1.0) (0.1) (0.8) 3.1 (0.1) 3.6 (3.0) 0.1 0.0 0.8 3.3 0.6 (0.2) 0.9 (0.7) (2.1) (0.6) (2.4) 4.7 5-Yr 2.8 1.6 0.9 2.1 1.1 0.3 0.1 (1.0) 2.4 2.5 4.0 (1.5) 0.9 2.0 1.0 3.7 2.2 3.6 0.9 0.9 1.7 2.2 1.2 0.2 1.7 2.1 1.7 1.5 1.1 2.5 4.1 2.6 2.6 1.0 0.7 1.2 0.9
10-Yr 4.6 2.7 3.9 2.3 3.0 3.2 2.7 1.2 2.4 2.7 3.9 2.0 3.9 3.5 2.5 4.2 3.3 4.2 2.7 3.7 3.1 2.1 0.6 2.8 2.5 3.2 2.3 3.4 3.1 4.4 4.5 2.4 5.0 3.1 3.4 5.0 3.9
Rank (%-ile) 10-Yr Return 90 31 74 19 41 48 31 5 22 31 74 13 74 61 24 83 52 83 31 68 45 15 2 33 24 48 19 56 45 87 89 22 96 45 56 96 74
162
Relief Association Goodview Graceville Granada Grand Lake Grand Meadow Grand Rapids Granite Falls Green Isle Greenbush Greenwood Grey Eagle Grove City Grygla Gunflint Trail Hackensack Hallock Halstad Ham Lake Hamburg Hamel Hancock Hanley Falls Hanska Hardwick Harmony Harris Hartland Hastings Hawley Hayfield Hayward Hector Henderson Hendricks Hendrum Henning Herman
Market Value 310,263 176,793 43,923 301,579 339,271 1,763,048 351,897 184,984 212,329 389,052 241,651 172,685 120,486 258,463 577,268 160,334 212,686 1,225,326 514,333 1,095,545 193,190 112,315 182,975 10,944 267,029 147,298 131,515 3,211,079 397,947 295,272 287,468 443,372 185,115 167,713 141,993 272,945 117,240
% of Assets at SBI 46.7 76.2 66.3 32.5 11.2 21.9 15.1 99.9 97.3 65.6 84.7 U.S. Stock % 35.1 21.8 56.3 25.3 59.0 60.2 33.3 35.0 52.7 51.4 41.1 26.7 30.0 33.4 8.9 18.5 26.8 36.9 36.9 0.2 13.4 6.8 11.6 30.1 8.7 37.3 79.0 28.1 92.9 58.4 23.4 16.6 49.2 44.6
Allocations as of 12/31/11 Int'l Stock Bond Cash % % % 14.8 39.6 10.4 0.8 40.3 37.1 3.8 39.9 19.1 54.0 (4.5) 3.6 16.8 19.8 4.1 15.1 20.1 9.7 37.7 17.8 25.9 9.8 27.8 9.1 5.6 31.9 23.5 25.1 15.3 27.4 15.9 12.5 49.1 10.9 12.2 16.7 40.7 19.6 36.1 4.6 9.0 13.9 68.2 11.1 8.1 61.1 100.0 13.1 57.6 0.3 10.7 38.4 10.6 8.0 57.8 (8.4) 58.3 41.2 14.7 20.2 45.9 4.4 88.8 100.0 10.3 78.1 10.6 37.7 18.6 6.3 27.1 56.0 14.6 41.5 6.0 7.0 0.4 13.5 15.1 18.2 33.7 6.1 1.0 34.0 7.6 9.9 21.8 44.3 4.4 79.0 100.0 10.1 20.2 20.5 14.5 25.6 15.3 Other % 0.1 6.1 0.8 0.5 1.5 1.5 0.7 0.3 0.8 0.4 6.3 1.2 2.2 3.4 5.7 0.3 5.8 3.0 1.9 0.6 0.1 4.9 0.6 2011 (1.8) 3.3 (5.6) (0.3) (3.0) (1.9) (1.7) (2.3) (1.5) 2.6 (0.2) 1.1 (0.9) 0.7 1.1 (4.0) 1.9 (2.0) 3.1 (1.0) 4.2 0.4 0.0 1.1 (0.9) (1.3) (1.0) (0.3) (2.4) (5.9) 0.6 3.0 0.6 (0.2) 0.7 (0.5) (0.1)
Table 7 Rates of Return and Asset Allocation For the Year Ended December 31, 2011 Rates of Return (%) 2011 (Below) Benchmark Benchmark 1.1 (2.9) 3.3 0.0 (0.2) (5.4) 0.6 (0.9) 0.3 (3.3) 0.9 (2.8) 1.3 (3.0) (2.8) 0.5 (0.2) (1.3) 2.2 0.4 0.2 (0.4) 2.1 (1.0) 0.6 (1.5) 0.2 0.5 (0.7) 1.8 (0.7) (3.3) 0.1 1.8 2.6 (4.6) 0.9 2.2 2.0 (3.0) 4.9 (0.7) (0.4) 0.8 (0.5) 0.5 (0.1) 1.2 (1.5) 0.6 0.1 (1.4) 1.2 (2.2) 1.0 (1.3) (0.7) (1.7) (0.5) (5.4) 1.0 (0.4) 3.3 (0.3) 0.4 0.2 (0.4) 0.2 0.1 0.6 0.5 (1.0) 0.2 (0.3) 5-Yr (0.3) 2.8 (1.2) 1.5 0.2 1.3 (0.3) 1.0 (0.4) 1.2 2.1 2.1 1.4 2.1 2.7 (0.1) 3.8 1.2 4.9 3.3 4.4 1.5 1.9 2.0 2.1 (0.3) 1.2 2.0 (0.2) 0.3 0.0 2.9 (0.6) 0.8 2.5 0.9 1.9
10-Yr 2.0 3.7 2.7 3.6 3.6 4.6 3.1 2.4 2.9 3.3 4.0 4.0 4.6 4.4 3.4 1.0 2.9 3.7 5.1 3.7 3.7 2.9 2.6 2.8 3.4 1.5 3.5 4.8 3.9 4.1 3.6 4.7 0.8 2.3 2.9 4.0 2.9
Rank (%-ile) 10-Yr Return 13 68 31 65 65 90 45 22 36 52 79 79 90 87 56 4 36 68 97 68 68 36 27 33 56 7 61 93 74 81 65 92 3 19 36 79 36
163
Relief Association Hermantown Heron Lake Hewitt Hibbing Hill City Hills Hinckley Hitterdal Hoffman Hokah Holdingford Holland Hollandale Hopkins Houston Hovland Area Howard Lake Hoyt Lakes Hugo Hutchinson Ideal Industrial International Falls Inver Grove Heights Iona Isanti Isle Ivanhoe Jackson Jacobson Janesville Jasper Jeffers Jordan Kandiyohi Karlstad Kasota
Market Value 905,423 155,621 112,673 338,753 129,516 109,984 497,522 145,034 148,155 106,307 204,075 180,544 76,598 1,934,986 269,020 125,532 402,290 252,106 704,605 1,448,119 596,854 252,761 573,440 3,374,280 71,828 1,095,593 334,134 272,421 557,390 118,063 215,637 141,341 134,573 604,116 288,628 148,666 321,463
% of Assets at SBI 17.1 13.5 14.4 93.1 15.8 94.1 42.1 94.2 80.3 66.5 U.S. Stock % 57.6 27.8 17.1 52.7 13.9 43.0 53.9 15.2 0.4 28.9 30.0 37.5 33.7 48.2 76.7 44.3 22.0 29.9 31.8 32.9 51.5 46.1 63.0 31.1 63.4 56.0 33.3 61.8 43.1 38.3 34.5 44.1 30.8 54.4 41.0
Allocations as of 12/31/11 Int'l Stock Bond Cash % % % 5.6 16.9 19.9 7.2 1.9 62.3 82.9 12.9 11.9 21.9 13.4 22.5 45.2 15.8 3.8 35.1 5.9 11.2 28.3 5.0 68.4 11.3 100.0 2.4 20.9 76.0 8.6 41.9 17.5 32.1 29.6 8.3 20.2 6.0 36.2 18.4 28.2 18.2 7.5 22.7 21.6 10.8 5.7 6.8 8.2 7.8 38.6 27.2 12.5 36.8 2.5 35.2 30.6 7.4 37.1 16.3 14.7 32.5 14.3 28.2 8.3 11.2 30.4 12.3 32.4 4.6 4.4 64.5 30.8 5.8 15.5 7.1 20.8 4.0 0.2 61.7 5.2 18.1 12.9 21.0 9.1 26.8 14.8 15.7 28.9 10.3 12.2 42.5 9.0 12.9 33.8 2.6 8.6 57.6 3.2 28.4 13.8 100.0 22.1 25.3 10.1 Other % 0.8 0.6 5.0 2.3 0.7 0.1 0.3 3.1 0.1 1.5 1.1 1.5 1.8 7.4 5.6 12.0 0.6 0.8 2.0 2.3 0.5 0.2 0.4 0.2 1.5 2011 3.0 (2.4) 1.2 (2.6) (4.4) (6.6) (0.8) 2.0 1.4 (0.3) (0.3) (3.2) (5.3) (2.3) (0.1) (1.1) (2.0) (5.1) (1.5) (0.8) (3.0) 3.9 (1.5) (0.2) (2.0) (5.1) (5.5) (0.8) 4.2 (2.8) 1.9 (1.5) (1.4) 1.5 2.7 1.1 (1.3)
Table 7 Rates of Return and Asset Allocation For the Year Ended December 31, 2011 Rates of Return (%) 2011 (Below) Benchmark Benchmark 1.5 1.5 (0.6) (1.8) 0.3 0.9 (0.4) (2.2) 0.2 (4.6) (1.3) (5.3) (0.3) (0.5) 3.3 (1.3) 0.1 1.3 1.0 (1.3) 1.6 (1.9) (2.8) (0.4) 1.5 (6.8) (0.1) (2.2) 1.1 (1.2) (0.4) (0.7) 0.2 (2.2) (1.2) (3.9) 0.0 (1.5) 2.2 (3.0) 1.1 (4.1) 1.2 2.7 1.4 (2.9) 2.8 (3.0) 0.1 (2.1) (4.2) (0.9) (1.3) (4.2) (0.1) (0.7) 2.4 1.8 (2.5) (0.3) (0.3) 2.2 (0.8) (0.7) 0.4 (1.8) 0.1 1.4 2.3 0.4 0.1 1.0 0.0 (1.3) 5-Yr (0.9) 1.0 3.0 1.5 (1.1) (3.8) 1.3 3.4 2.6 (0.6) 0.7 0.7 (0.1) (0.1) 3.2 (2.4) (1.3) 1.8 (0.3) 2.1 0.4 4.3 1.5 2.2 0.1 (0.8) (0.6) 1.2 (0.7) 0.9 2.1 1.4 (1.9) 3.0 1.5 2.4 1.3
10-Yr 2.9 1.8 3.3 4.1 1.7 0.6 4.2 3.4 2.9 1.5 2.8 4.4 A 3.5 5.0 2.0 1.4 2.6 2.0 5.1 3.0 5.6 3.4 4.0 0.7 4.0 3.4 3.0 1.4 3.6 3.4 3.7 2.2 0.5 3.7 2.5 4.6
Rank (%-ile) 10-Yr Return 36 10 52 81 9 2 83 56 36 7 33 87 A 61 96 13 6 27 13 97 41 99 56 79 3 79 56 41 6 65 56 68 17 2 68 24 90
164
Relief Association Kasson Keewatin Kelliher Kellogg Kelsey Kennedy Kensington Kenyon Kerkhoven Kerrick Kettle River Kiester Kilkenny Kimball Kinney La Crescent La Salle Lafayette Lake Benton Lake Bronson Lake City Lake Crystal Lake Elmo Lake George Lake Henry Lake Johanna Lake Kabetogama Lake Lillian Lake Park Lake Wilson Lakefield Lakeport Lakeville Lakewood Lamberton Lancaster Lanesboro
Market Value 335,667 108,120 164,765 316,827 30,572 112,395 220,789 339,648 204,381 13,487 111,015 143,529 249,570 269,782 175,607 426,346 54,916 321,392 205,871 87,133 778,310 433,786 883,432 133,176 123,995 3,726,607 151,556 117,979 159,893 158,189 334,195 222,642 5,618,283 255,315 158,290 125,764 276,444
% of Assets at SBI 97.1 83.0 73.3 31.9 92.9 57.8 74.5 44.6 91.0 79.9 94.0 U.S. Stock % 54.0 47.4 38.5 32.3 11.2 28.2 49.4 59.1 20.2 77.6 47.7 55.5 54.4 23.6 47.6 10.8 47.7 13.1 66.8 37.5 34.0 43.2 94.0 27.1 41.7 23.4 64.6 32.6 33.1 8.6
Allocations as of 12/31/11 Int'l Stock Bond Cash % % % 8.5 11.7 25.2 10.8 14.6 27.2 100.0 8.2 8.1 45.1 27.7 37.1 2.9 6.7 4.9 76.4 100.0 8.9 12.7 49.7 32.6 18.0 100.0 12.4 28.5 11.7 68.1 2.8 11.0 8.6 8.8 43.5 0.8 5.1 38.6 19.1 26.5 20.2 56.2 4.6 36.6 11.2 100.0 1.1 88.1 28.4 23.9 5.3 35.5 31.6 1.9 10.3 20.4 24.0 6.2 32.3 16.4 12.5 35.9 17.8 15.0 23.0 6.0 40.0 60.0 14.0 29.4 18.7 100.0 7.5 19.7 30.3 8.4 22.4 38.2 5.4 13.6 16.0 15.2 37.8 13.7 16.8 44.0 5.5 100.0 0.7 3.5 87.2 Other % 0.6 0.1 0.8 0.5 14.5 0.6 1.2 1.0 10.8 0.8 7.6 0.4 0.7 0.6 2011 (5.8) (4.5) 3.7 (1.5) (2.2) (1.3) 3.4 (15.2) 3.4 0.3 1.1 (0.8) (1.4) 1.1 (1.4) 1.7 3.4 1.9 0.7 0.9 2.7 (2.8) (0.2) (4.2) (2.6) (2.6) 0.2 1.7 (3.4) 1.2 (2.5) (1.3) (2.0) (0.7) (0.5) 1.8 (2.2)
Table 7 Rates of Return and Asset Allocation For the Year Ended December 31, 2011 Rates of Return (%) 2011 (Below) Benchmark Benchmark (0.7) (5.1) (0.2) (4.3) 0.1 3.6 (1.0) (0.5) (1.0) (1.2) (0.4) (0.9) 0.1 3.3 (5.3) (9.9) 3.5 (0.1) 0.1 0.2 1.7 (0.6) (1.4) 0.6 1.0 (2.4) 1.3 (0.2) 0.4 (1.8) 2.2 (0.5) 1.0 2.4 2.5 (0.6) 0.1 0.6 0.0 0.9 3.2 (0.5) 1.7 (4.5) (0.5) 0.3 0.8 (5.0) (1.2) (1.4) (0.4) (2.2) 1.0 (0.8) 3.4 (1.7) 0.5 (3.9) 0.1 1.1 0.5 (3.0) (0.2) (1.1) (0.6) (1.4) 1.0 (1.7) 1.2 (1.7) 0.1 1.7 (0.5) (1.7) 5-Yr 0.4 2.4 0.2 1.0 (0.3) (0.9) 3.9 (0.3) 2.4 A 2.0 1.9 1.9 1.6 1.3 (1.4) 2.5 1.4 2.4 2.5 3.2 0.5 0.7 0.8 0.5 1.5 (0.5) 2.2 1.6 2.5 0.7 (0.6) 2.1 2.6 0.5 2.9 0.1
10-Yr 4.2 4.3 2.9 3.5 A 0.7 3.7 3.4 4.1 A 3.8 3.2 3.5 3.3 1.9 1.9 4.1 3.6 2.1 2.4 4.4 2.6 2.9 3.5 2.3 4.2 2.9 2.5 2.6 2.6 3.6 2.4 3.8 5.1 3.5 2.9 2.2
Rank (%-ile) 10-Yr Return 83 86 36 61 A 3 68 56 81 A 71 48 61 52 12 12 81 65 15 22 87 27 36 61 19 83 36 24 27 27 65 22 71 97 61 36 17
165
Relief Association Le Center Le Sueur Leaf Valley LeRoy Lester Prairie Lewiston Lewisville Lindstrom Linwood Lismore Litchfield Little Canada Little Falls Littlefork London Long Lake Long Prairie Longville Lonsdale Loretto Lower Saint Croix Valley Lowry Lucan Luverne Lyle Lynd Mabel Madelia Madison Madison Lake Magnolia Mahnomen Mahtowa Makinen Mantorville Maple Grove Maple Hill
Market Value 354,496 671,828 204,974 153,675 C 413,636 214,571 641,562 467,977 135,388 526,767 1,687,941 983,701 217,116 67,831 1,385,617 434,679 721,387 555,974 1,272,449 1,127,861 334,288 97,780 711,708 108,191 78,584 104,993 229,996 133,534 261,080 61,558 302,559 118,356 76,893 287,111 9,202,124 193,635
% of Assets at SBI 53.7 40.1 84.9 99.9 16.8 92.5 81.8 17.8 83.5 U.S. Stock % 30.1 36.4 32.3 24.7 51.3 38.0 50.9 27.2 35.1 61.6 60.9 81.2 74.4 50.0 10.8 21.5 40.3 63.5 35.8 30.8 17.2 64.9 67.8 38.3 29.8 23.6 67.2 66.7 50.9 23.6 48.7 46.1 40.1
Allocations as of 12/31/11 Int'l Stock Bond Cash % % % 4.6 7.7 57.5 19.4 38.5 2.5 13.4 7.8 37.7 27.0 48.3 11.7 24.4 11.6 100.0 15.6 42.1 (0.2) 29.7 19.4 13.9 11.6 46.1 19.4 31.0 13.7 9.0 5.9 22.9 6.4 15.5 16.5 16.4 2.4 25.6 6.6 3.0 39.6 11.2 0.3 77.3 10.8 8.4 58.3 15.2 33.5 8.4 5.1 15.7 15.1 15.4 37.9 8.2 6.8 1.3 60.6 7.9 74.8 3.6 13.8 17.2 7.0 15.5 9.7 12.7 31.0 16.3 5.1 11.9 52.7 6.5 30.9 39.0 12.1 20.7 11.4 10.2 11.2 100.0 8.9 23.7 14.2 20.3 21.4 33.1 100.0 7.6 0.2 39.8 11.3 35.7 6.4 40.1 19.8 Other % 0.1 3.2 8.8 1.0 4.5 1.2 0.8 0.6 0.7 0.8 0.4 1.0 2.6 0.6 2.7 0.5 0.1 0.5 1.7 0.5 0.5 2.3 1.6 3.7 0.5 2011 0.6 (4.1) (0.7) 2.6 (3.7) 0.8 2.1 (3.5) 2.3 0.8 (3.2) (4.1) (3.6) 1.7 (5.3) (4.0) (1.4) 0.6 (4.4) (2.9) (3.4) (0.8) (0.9) (2.1) (0.1) (2.8) (0.3) 3.2 1.0 (4.3) 2.5 (2.2) (2.1) 0.4 (1.0) 0.1 3.2
Table 7 Rates of Return and Asset Allocation For the Year Ended December 31, 2011 Rates of Return (%) 2011 (Below) Benchmark Benchmark 0.2 0.4 1.0 (5.1) (0.7) 0.0 2.7 (0.1) 1.5 (5.2) 0.5 0.3 0.1 2.0 (0.1) (3.4) 3.1 (0.8) (0.9) 1.7 (0.2) (3.0) (0.5) (3.6) (0.3) (3.3) 2.1 (0.4) 0.7 (6.0) (0.4) (3.6) (1.7) 0.3 (1.3) 1.9 1.1 (5.5) (0.7) (2.2) 1.1 (4.5) (0.6) (0.2) (0.9) 0.0 0.7 (2.8) 2.0 (2.1) 0.2 (3.0) 0.7 (1.0) 1.2 2.0 1.3 (0.3) (0.4) (3.9) 0.1 2.4 (0.8) (1.4) (1.2) (0.9) 0.1 0.3 (1.3) 0.3 1.2 (1.1) 3.8 (0.6) 5-Yr 2.5 0.8 (0.9) 3.1 (1.2) 2.1 3.5 1.4 2.2 1.0 0.6 2.0 (0.2) 1.5 (1.8) 0.8 0.3 2.0 (3.0) 0.5 (0.7) 1.0 1.3 1.0 2.0 (0.3) 0.6 3.0 0.8 (0.6) 3.4 1.6 0.5 0.5 0.9 0.4 3.6
10-Yr 3.4 3.6 2.1 3.9 1.8 4.8 4.0 3.4 4.3 3.0 2.3 3.3 2.8 4.1 0.1 3.3 2.1 2.7 1.8 4.4 2.9 3.3 2.6 1.6 2.4 2.7 2.0 3.0 3.2 3.4 3.3 3.4 2.1 2.4 3.2 4.1 3.4
Rank (%-ile) 10-Yr Return 56 65 15 74 10 93 79 56 86 41 19 52 33 81 1 52 15 31 10 87 36 52 27 8 22 31 13 41 48 56 52 56 15 22 48 81 56
166
Relief Association Maple Lake Maple Plain Mapleton Mapleview Maplewood Marble Marietta Marine-On-Saint Croix Marshall Mayer Maynard Mazeppa McDavitt McGrath McGregor McIntosh McKinley Meadowlands Medford Medicine Lake Melrose Menahga Mendota Heights Mentor Middle River Miesville Milaca Milan Millerville Milroy Miltona Minneota Minnesota Lake Minnetonka Mission Montevideo Montgomery
Market Value 894,322 925,123 399,397 166,862 4,250,121 221,303 80,213 412,171 2,551,916 510,813 251,207 198,498 101,750 157,095 476,614 123,211 C 64,305 240,197 688,214 334,818 274,920 2,138,988 84,617 150,860 250,894 667,568 176,311 351,576 140,525 224,973 281,783 225,553 11,933,087 278,400 449,664 441,197
% of Assets at SBI 15.5 99.2 91.3 100.0 86.0 88.5 31.7 85.0 19.5 73.1 99.2 95.1 58.4 54.5 67.3 34.1 49.2 U.S. Stock % 38.0 21.9 40.0 42.9 62.0 29.4 80.4 45.9 41.2 67.0 33.7 41.1 50.6 9.5 23.1 65.0 1.9 82.6 43.4 31.3 16.4 44.8 34.1 10.6 27.6 72.1 37.9 32.1 20.1 39.1 25.5 34.9 20.9 53.5 49.6
Allocations as of 12/31/11 Int'l Stock Bond Cash % % % 0.8 28.2 32.8 14.6 54.6 8.4 7.6 34.3 15.4 13.1 42.1 1.9 7.7 21.6 8.7 15.1 28.8 24.9 17.2 2.4 17.6 12.2 24.3 12.8 36.3 9.4 1.2 29.1 2.7 22.4 19.7 23.0 16.0 16.8 25.7 9.8 22.5 17.1 9.5 81.0 11.0 32.6 32.2 7.0 28.0 0.1 65.4 32.5 12.8 3.3 1.3 21.3 30.4 4.9 10.3 50.2 7.5 60.4 23.2 17.0 32.5 5.7 3.0 10.4 52.0 100.0 10.7 58.2 17.3 16.0 28.7 25.3 1.9 4.3 21.5 12.6 14.8 34.1 9.4 36.9 21.4 12.7 20.1 40.7 16.7 14.2 29.1 9.7 15.9 34.1 15.0 41.0 6.8 3.5 64.8 9.3 18.3 18.1 8.5 12.1 17.0 19.8 Other % 0.2 0.5 2.7 1.8 0.3 1.2 0.4 1.1 0.1 0.7 0.5 3.2 2.4 0.2 0.6 0.2 6.4 0.9 14.8 2.3 1.5 1.6 1.5 2011 (1.0) 1.9 3.5 0.9 0.4 (1.9) 1.7 (1.7) (0.9) 1.5 (1.1) (0.7) 0.6 1.2 (4.3) 0.7 1.3 5.9 (4.5) (1.3) 3.4 5.5 (2.4) (4.9) 1.7 (0.9) (2.0) 1.6 (0.6) (0.1) (1.4) (1.0) (0.4) (0.6) 3.6 (0.3) (3.4)
Table 7 Rates of Return and Asset Allocation For the Year Ended December 31, 2011 Rates of Return (%) 2011 (Below) Benchmark Benchmark 1.6 (2.6) 0.9 1.0 0.4 3.1 2.2 (1.3) 0.9 (0.5) (0.5) (1.4) 2.1 (0.4) (1.3) (0.4) 1.5 (2.4) 2.5 (1.0) (1.6) 0.5 (0.5) (0.2) 1.1 (0.5) 0.9 0.3 0.6 (4.9) 1.3 (0.6) 0.1 1.2 5.8 0.1 (2.9) (1.6) (1.1) (0.2) 2.1 1.3 5.2 0.3 0.1 (2.5) 0.7 (5.6) 0.1 1.6 2.3 (3.2) (0.3) (1.7) 1.6 0.0 (0.6) 0.0 1.3 (1.4) 0.5 (1.9) (1.2) 0.2 0.0 (0.4) 2.1 (2.7) 4.4 (0.8) (0.4) 0.1 (0.4) (3.0) 5-Yr (1.0) 1.9 3.7 2.0 1.5 1.3 1.6 0.4 2.1 1.7 0.7 (0.2) 1.3 2.6 (0.8) 0.8 3.3 4.5 (2.1) 1.3 1.0 4.7 0.1 0.3 3.0 0.3 0.5 0.6 1.4 6.0 0.9 1.0 0.9 1.7 1.8 1.0 2.1
10-Yr 2.3 3.4 4.3 A 4.0 3.9 6.0 3.2 4.0 4.1 2.5 2.2 3.7 3.1 1.9 3.1 3.2 4.4 3.1 3.9 2.8 4.9 2.6 1.5 3.0 2.4 3.2 2.9 3.0 4.6 2.1 4.2 2.5 3.5 2.8 4.9 4.3
Rank (%-ile) 10-Yr Return 19 56 86 A 79 74 100 48 79 81 24 17 68 45 12 45 48 87 45 74 33 94 27 7 41 22 48 36 41 90 15 83 24 61 33 94 86
167
Relief Association Monticello Montrose Moose Lake Mora Morgan Morris Morristown Morse-Fall Lake Morton Motley Mound Mountain Iron Mountain Lake Murdock Myrtle Nashwauk Nashwauk Police Nassau Nerstrand Nevis New Auburn New Brighton New Germany New London New Munich New Prague New Richland New Ulm New York Mills Newfolden Newport Nicollet Nisswa Nodine Normanna North Branch North Mankato
Market Value 1,126,049 505,860 226,839 543,241 423,187 589,558 509,033 57,787 181,832 192,374 4,024,638 212,154 194,391 167,399 194,311 299,235 8,249 150,660 43,533 230,899 138,537 2,850,962 444,779 251,006 115,259 488,994 226,775 1,812,587 159,761 138,848 860,689 276,182 593,964 177,237 C 360,074 1,279,819
% of Assets at SBI 5.9 17.0 92.3 44.7 63.9 58.1 96.2 99.6 18.6 11.8 70.8 100.0 94.9 32.6 U.S. Stock % 32.0 29.2 31.8 53.3 35.2 31.0 72.8 26.8 24.5 53.0 70.3 31.6 58.4 34.0 7.1 64.5 54.3 60.5 54.6 13.8 43.0 49.8 42.5 29.5 61.1 31.6 58.9 49.6 37.0
Allocations as of 12/31/11 Int'l Stock Bond Cash % % % 11.2 36.5 19.7 4.5 12.2 53.9 17.5 22.9 27.3 5.3 41.4 24.0 25.6 13.8 20.8 34.3 13.1 2.8 14.6 9.8 15.7 57.5 3.7 44.2 27.9 13.3 18.7 14.8 3.9 11.4 13.9 15.9 19.4 33.1 100.0 13.0 12.2 15.9 4.8 20.9 39.6 0.2 4.3 88.3 100.0 16.0 15.1 4.4 100.0 13.7 85.8 6.8 4.3 34.6 39.1 0.4 1.0 13.6 30.5 100.0 0.7 85.5 17.2 14.5 19.8 100.0 14.5 9.1 25.6 24.8 32.7 100.0 13.5 34.2 20.2 17.5 13.3 8.1 13.8 29.7 9.3 15.5 11.8 13.8 6.1 14.0 30.0 14.5 39.8 4.5 Other % 0.6 0.2 0.5 1.4 0.8 (0.3) 0.2 0.5 0.5 0.7 0.1 0.5 0.3 5.5 1.0 2.6 15.6 0.3 4.2 2011 (0.5) (5.3) (5.3) (0.7) (3.1) (3.1) 0.8 (0.1) (2.5) (4.0) (2.6) (3.4) 2.0 1.9 2.7 (1.5) 0.0 (1.3) 0.2 2.2 (4.4) 2.8 (0.9) 3.3 0.0 (4.5) 1.0 0.5 3.0 0.5 (3.5) (1.7) (3.7) (2.6) (2.2) (3.6) (3.0)
Table 7 Rates of Return and Asset Allocation For the Year Ended December 31, 2011 Rates of Return (%) 2011 (Below) Benchmark Benchmark 1.7 (2.2) 0.6 (5.9) 0.2 (5.5) (0.2) (0.5) (1.1) (2.0) (0.2) (2.9) 1.4 (0.6) 3.2 (3.3) 1.7 (4.2) (0.6) (3.4) 0.9 (3.5) (0.6) (2.8) 0.1 1.9 (0.5) 2.4 1.3 1.4 0.6 (2.1) 0.1 (0.1) (0.7) (0.6) 0.1 0.1 1.3 0.9 (0.2) (4.2) 3.5 (0.7) 2.1 (3.0) 0.1 3.2 0.2 (0.2) (0.6) (3.9) 0.1 0.9 (0.8) 1.3 2.5 0.5 0.1 0.4 0.6 (4.1) (1.0) (0.7) 1.1 (4.8) 0.4 (3.0) 0.2 (2.4) 0.8 (4.4) (0.7) (2.3) 5-Yr 0.8 (1.5) (0.9) 0.6 1.7 0.7 (0.7) A 1.4 (4.8) 2.1 0.5 2.7 (0.7) 2.0 (0.5) 0.0 0.9 4.7 3.9 1.1 2.9 (1.1) (0.5) 1.2 (1.0) 2.7 2.1 2.4 2.3 (3.4) 1.0 3.7 2.1 0.6 (0.9) 1.7
10-Yr 3.6 1.6 1.8 3.1 5.2 3.7 3.1 A 1.0 1.0 4.8 2.9 2.7 2.6 4.5 2.0 0.2 1.9 A 1.7 2.4 4.9 1.6 1.1 2.2 1.8 3.0 4.5 3.8 2.0 0.0 4.5 4.3 5.2 A 2.1 3.9
Rank (%-ile) 10-Yr Return 65 8 10 45 97 68 45 A 4 4 93 36 31 27 89 13 1 12 A 9 22 94 8 5 17 10 41 89 71 13 1 89 86 97 A 15 74
168
Relief Association North Saint Paul Northfield Northland Northome Northrop Norwood Young America Oak Grove Oakdale Odessa Odin Ogilvie Okabena Oklee Olivia Onamia Ormsby Oronoco Orr Ortonville Osakis Osseo Ostrander Owatonna Palisade Palo Park Rapids Parkers Prairie Paynesville Pelican Rapids Pemberton Pennock Pequaywan Pequot Lakes Perham Pierz Pillager Pine City
Market Value 1,090,613 3,275,651 84,329 131,413 107,427 479,206 946,967 1,976,753 55,866 120,346 186,067 166,798 86,159 264,289 246,501 174,727 197,531 140,395 338,978 461,081 401,308 65,427 1,840,201 118,651 126 949,853 232,579 562,316 376,197 119,667 1,792 C 1,030,654 577,983 365,755 485,947 949,077
% of Assets at SBI 99.4 99.9 88.9 48.2 95.0 99.9 33.1 U.S. Stock % 34.3 82.7 39.5 79.9 34.2 60.7 40.7 25.9 6.9 9.6 65.3 32.4 23.3 50.6 36.7 75.4 53.4 78.1 51.1 29.8 26.9 28.9 37.8 24.1 42.1 29.7 38.4 18.6
Allocations as of 12/31/11 Int'l Stock Bond Cash % % % 9.4 49.3 6.5 14.8 2.5 2.5 50.2 3.7 100.0 17.5 2.6 41.0 24.8 10.5 13.9 14.2 20.9 25.5 10.2 0.5 73.6 100.0 4.2 77.1 1.1 21.0 69.4 100.0 1.3 9.4 23.6 9.8 22.2 34.8 100.0 9.7 5.1 61.9 2.3 47.1 13.8 40.4 7.4 8.5 11.1 5.0 11.0 12.4 21.9 100.0 5.6 10.6 5.7 7.9 5.4 33.7 100.0 15.0 41.2 12.7 8.3 14.4 50.2 24.6 13.5 31.6 10.4 2.1 46.0 100.0 100.0 7.9 68.0 17.2 16.2 23.7 23.4 33.9 9.6 8.6 38.3 2.9 0.5 43.3 37.3 Other % 0.5 4.1 0.7 2.7 10.7 0.4 0.8 1.7 1.3 1.9 1.3 0.2 1.4 3.7 0.8 3.4 11.8 0.3 2011 0.7 1.1 8.0 0.4 1.6 2.5 (3.0) (4.4) 0.0 2.4 0.8 2.6 0.9 (1.9) (0.4) 2.4 2.0 (0.2) (0.4) (0.1) (2.7) 0.7 0.1 (2.7) (0.8) (1.5) (1.4) (6.7) (4.3) 2.1 2.8 (5.7) 1.6 (3.4) (4.3) (1.4) (1.6)
Table 7 Rates of Return and Asset Allocation For the Year Ended December 31, 2011 Rates of Return (%) 2011 (Below) Benchmark Benchmark 2.9 (2.2) 2.1 (1.0) 3.6 4.4 0.1 0.3 2.2 (0.6) 1.3 1.2 (0.4) (2.6) (1.3) (3.1) 0.2 (0.2) 0.1 2.3 5.3 (4.5) 1.8 0.8 0.1 0.8 1.4 (3.3) 0.9 (1.3) 0.1 2.3 0.1 1.9 0.3 (0.5) (0.5) 0.1 0.1 (0.2) (0.1) (2.6) 0.1 0.6 0.6 (0.5) (0.2) (2.5) 0.6 (1.4) 0.3 (1.8) 0.0 (1.4) (2.5) (4.2) (1.1) (3.2) 0.1 2.0 2.9 (0.1) 0.8 (6.5) 1.0 0.6 (0.9) (2.5) 0.6 (4.9) 0.7 (2.1) (0.5) (1.1) 5-Yr 2.8 1.3 3.0 1.7 1.2 (1.9) 1.9 (0.2) 0.0 3.1 2.7 2.8 2.5 (2.8) 1.9 3.3 2.3 0.0 0.0 3.3 2.5 2.3 0.5 1.2 1.1 0.9 1.1 1.9 0.1 3.5 2.4 (1.3) 3.3 0.4 (0.1) (0.2) 0.7
10-Yr 3.9 3.9 5.6 2.5 3.8 1.1 3.7 3.4 0.7 3.3 3.0 3.2 2.5 0.2 2.1 3.6 3.0 2.4 4.5 4.9 4.7 2.5 3.4 2.8 3.1 3.1 3.2 5.9 2.6 3.4 3.3 1.6 2.5 3.9 2.6 2.1 3.8
Rank (%-ile) 10-Yr Return 74 74 99 24 71 5 68 56 3 52 41 48 24 1 15 65 41 22 89 94 92 24 56 33 45 45 48 99 27 56 52 8 24 74 27 15 71
169
Relief Association Pine Island Pine River Pipestone Plainview Plato Plummer Plymouth Porter Preston Princeton Prinsburg Prior Lake Proctor Ramsey Randall Randolph Raymond Red Lake Falls Red Wing Redwood Falls Remer Renville Rice Rice Lake Richmond Robbinsdale Rockford Rockville Rogers Rollingstone Rose Creek Roseau Rosemount Roseville Rothsay Round Lake Royalton
Market Value 382,001 647,849 508,948 561,455 465,830 128,181 6,330,430 299,126 246,028 1,075,982 208,966 2,548,946 315,287 1,834,031 348,929 480,906 211,241 177,694 891,627 646,222 523,061 309,535 346,268 490,856 384,868 1,370,303 449,973 395,192 739,332 87,269 97,598 578,287 2,783,038 7,402,826 306,550 209,524 151,956
% of Assets at SBI 76.2 49.0 100.0 5.4 88.0 41.8 6.9 61.9 96.8 50.2 0.2 72.1 99.0 U.S. Stock % 50.3 28.6 50.5 18.0 45.4 44.5 39.8 78.8 45.3 47.4 11.1 49.1 34.1 33.6 18.1 63.6 21.6 45.0 39.2 35.3 33.3 28.3 64.4 29.1 50.6 35.9 31.7 54.6 42.7 38.6 27.1
Allocations as of 12/31/11 Int'l Stock Bond Cash % % % 23.6 26.1 16.8 38.4 15.7 6.5 26.9 14.7 5.2 11.4 58.3 4.4 8.5 40.8 7.4 29.0 18.2 17.0 36.0 6.8 15.4 5.8 13.5 25.9 13.9 9.5 24.9 17.6 1.1 87.8 22.8 13.8 12.9 13.8 30.3 18.5 11.3 37.9 15.4 11.6 53.8 16.3 7.7 21.8 6.9 24.4 10.9 42.5 41.8 58.2 7.1 35.2 8.8 6.1 43.9 10.3 100.0 25.6 39.1 24.9 32.8 6.0 84.8 14.5 22.1 22.1 26.6 8.9 21.2 5.5 0.3 71.3 14.8 24.7 32.4 11.2 7.1 10.8 31.1 100.0 100.0 20.4 36.0 5.8 (2.0) 18.5 51.5 8.3 36.1 1.0 13.5 7.5 33.0 16.3 33.1 11.7 17.1 14.2 37.3 Other % 0.5 1.4 7.1 0.9 0.9 0.4 1.4 0.6 1.4 3.3 1.8 0.2 0.6 3.9 0.5 3.0 0.7 0.9 13.6 2.6 0.4 1.9 0.3 3.3 0.3 4.3 2011 1.4 1.0 (0.7) (1.0) (5.3) (2.7) (0.5) 1.6 (0.7) (3.8) 2.6 (0.4) (1.2) (1.2) (0.6) (0.1) (0.1) 1.9 2.3 (1.0) 3.8 2.2 (4.6) 5.0 (2.1) 0.1 0.9 (4.9) (3.0) 2.4 0.8 (0.6) 0.7 1.3 (2.8) (4.0) (3.0)
Table 7 Rates of Return and Asset Allocation For the Year Ended December 31, 2011 Rates of Return (%) 2011 (Below) Benchmark Benchmark 1.7 (0.3) 0.8 0.2 2.0 (2.7) 0.4 (1.4) (2.6) (2.7) 0.2 (2.9) 1.6 (2.1) 2.0 (0.4) (0.3) (0.4) 0.6 (4.4) 0.1 2.5 (2.0) 1.6 1.0 (2.2) 2.2 (3.4) 2.8 (3.4) 0.5 (0.6) (2.4) 2.3 1.4 0.5 2.8 (0.5) 3.0 (4.0) 0.1 3.7 2.7 (0.5) 0.7 (5.3) 5.7 (0.7) (2.0) (0.1) 0.5 (0.4) 0.9 0.0 (0.3) (4.6) 0.3 (3.3) 0.1 2.3 (6.8) 7.6 1.1 (1.7) 2.2 (1.5) 1.8 (0.5) (0.8) (2.0) 1.2 (5.2) (1.1) (1.9) 5-Yr 2.5 3.5 1.5 0.7 2.6 (2.5) 2.2 1.3 2.0 0.1 2.1 0.6 1.5 0.0 1.3 (0.1) 0.2 2.9 0.6 2.1 3.6 2.6 0.5 4.5 1.5 1.1 (1.4) (0.5) 1.5 3.5 (3.2) (1.3) (1.9) 1.6 1.1 1.0 0.2
10-Yr 4.0 2.8 4.1 2.9 4.8 2.4 3.2 4.2 4.4 1.6 2.6 3.9 3.3 2.8 3.2 2.3 1.5 3.6 4.7 3.9 4.7 3.8 3.1 3.8 3.8 4.0 1.7 2.8 3.0 2.6 1.0 3.4 1.8 4.6 3.4 3.2 2.2
Rank (%-ile) 10-Yr Return 79 33 81 36 93 22 48 83 87 8 27 74 52 33 48 19 7 65 92 74 92 71 45 71 71 79 9 33 41 27 4 56 10 90 56 48 17
170
Relief Association Rush City Rushford Rushmore Ruthton Sabin-Elmwood Sacred Heart Saint Anthony Saint Augusta Saint Bonifacius Saint Charles Saint Clair Saint Francis Saint Hilaire Saint James Saint Joseph Saint Leo Saint Martin Saint Michael Saint Paul Park Saint Peter Saint Stephen Sanborn Sandstone Sartell Sauk Centre Sauk Rapids Savage Scandia Valley Schroeder Seaforth Sebeka Sedan Shafer Shakopee Shelly Sherburn Shevlin
Market Value 459,288 303,968 92,438 213,233 215,321 146,895 889,001 42,237 451,684 574,646 637,438 595,664 137,097 621,546 493,020 156,797 427,667 760,183 558,563 747,717 367,332 121,445 153,318 775,921 525,986 1,127,579 3,854,881 228,622 111,167 75,890 394,834 50,466 202,156 3,974,012 133,590 511,501 182,304
% of Assets at SBI 40.4 25.9 61.1 39.4 4.4 32.1 89.2 98.9 52.8 55.7 30.9 U.S. Stock % 35.8 23.6 23.8 25.5 35.2 25.9 37.7 48.3 39.9 57.8 49.6 29.6 7.6 17.0 30.7 20.5 31.1 6.1 38.7 34.5 30.7 29.1 31.1 42.9 42.9 65.4 53.6 98.9 36.3 9.9 47.1 28.8 33.4 42.7
Allocations as of 12/31/11 Int'l Stock Bond Cash % % % 7.7 21.6 32.5 10.5 14.3 50.6 4.8 11.8 58.7 3.9 70.6 0.5 58.0 6.1 74.1 14.6 25.3 19.3 19.2 9.5 21.4 16.8 24.3 17.2 18.5 16.2 6.2 10.4 40.0 10.4 26.7 28.2 2.6 4.3 85.2 8.6 40.0 29.7 13.4 38.9 14.7 3.0 0.1 76.1 28.2 12.5 26.8 1.5 9.0 83.4 11.9 46.0 0.2 13.8 10.9 40.3 10.3 17.9 40.4 100.0 5.3 2.8 60.9 9.8 36.5 21.8 5.1 21.9 29.3 12.4 29.7 13.1 2.4 20.5 11.4 31.2 15.2 1.1 100.0 3.4 34.6 19.0 100.0 0.7 2.3 87.1 5.8 31.8 15.1 1.9 28.2 41.3 19.5 47.1 9.8 29.9 17.5 Other % 2.4 1.0 0.9 0.2 3.1 1.6 1.8 1.3 5.1 0.3 4.7 2.3 0.3 1.4 3.2 0.5 0.7 1.9 0.8 0.8 1.9 0.3 6.7 0.2 (0.2) 0.1 2011 0.3 2.6 (1.1) 1.4 2.7 1.2 (5.1) (1.2) (1.5) (4.6) 1.4 (2.5) 1.3 (0.4) (3.8) 1.8 (7.4) (3.2) (0.9) (1.7) (2.2) 1.7 0.4 0.6 4.2 (2.7) (1.2) 2.8 0.1 1.8 2.8 0.2 1.2 0.7 (0.2) 2.1 (2.5)
Table 7 Rates of Return and Asset Allocation For the Year Ended December 31, 2011 Rates of Return (%) 2011 (Below) Benchmark Benchmark 0.7 (0.4) (0.7) 3.3 0.7 (1.8) 0.7 0.7 4.6 (1.9) 0.3 0.9 (0.1) (5.0) 0.1 (1.3) 0.1 (1.6) (0.4) (4.2) 1.3 0.1 0.4 (2.9) 0.1 1.2 1.1 (1.5) 1.1 (4.9) (0.1) 1.9 (2.8) (4.6) 0.4 (3.6) 1.4 (2.3) (1.0) (0.7) 0.8 (3.0) 0.1 1.6 (0.2) 0.6 1.8 (1.2) 1.8 2.4 0.4 (3.1) 1.7 (2.9) 3.3 (0.5) 1.0 (0.9) 0.1 1.7 2.6 0.2 0.1 0.1 0.3 0.9 1.5 (0.8) 3.8 (4.0) 2.0 0.1 1.6 (4.1) 5-Yr (1.1) 2.4 1.1 2.2 6.4 1.0 0.5 A (0.2) 1.2 1.8 0.3 2.3 1.6 0.1 1.9 4.4 (3.2) 0.5 2.1 1.3 2.7 (0.9) 2.8 2.5 0.8 2.4 (2.8) 1.8 3.2 1.1 0.6 2.3 1.6 1.2 2.8 2.8
10-Yr 2.2 3.0 1.5 2.9 6.1 1.9 5.1 A 2.4 3.9 3.4 3.2 2.9 4.2 2.7 3.0 7.6 0.5 3.5 4.2 3.3 2.9 0.3 4.0 3.9 2.5 3.7 1.6 3.9 3.5 5.0 0.9 2.8 3.9 2.4 3.8 4.1
Rank (%-ile) 10-Yr Return 17 41 7 36 100 12 97 A 22 74 56 48 36 83 31 41 100 2 61 83 52 36 2 79 74 24 68 8 74 61 96 4 33 74 22 71 81
171
Relief Association Silica Silver Bay Silver Lake Slayton Sleepy Eye Solway Solway Rural South Bend South Haven Spicer Spring Grove Spring Lake Park Spring Valley Springfield Squaw Lake Stacy-Lent Area Staples Starbuck Stephen Stewart Stewartville Stillwater Storden Sturgeon Lake Sunburg Swanville Taconite Taunton Taylors Falls Thief River Falls Thief River Falls Police Thomson Tofte Toivola Tower Tracy Trimont
Market Value 121,231 463,456 203,095 346,275 814,478 186,800 54,334 289,482 251,050 213,487 145,219 10,346,390 496,975 241,576 177,231 518,245 314,345 171,614 181,503 250,495 1,059,011 3,002,246 167,275 89,639 C 202,304 94,496 74,774 327,314 846,127 101,465 473,784 124,886 151,265 C 303,052 377,071
% of Assets at SBI 89.3 97.9 28.2 22.1 9.0 48.4 53.9 46.6 19.8 44.6 99.1 U.S. Stock % 31.1 60.5 10.7 22.8 61.9 73.9 40.3 26.3 41.5 29.4 42.7 52.9 36.1 22.6 37.3 47.2 33.7 36.3 34.5 34.6 36.2 18.3 20.0 36.2 20.6 20.5 79.1 34.3 37.3 -
Allocations as of 12/31/11 Int'l Stock Bond Cash % % % 12.3 55.8 (3.6) 13.1 13.7 12.7 100.0 2.6 9.7 77.0 80.6 19.4 73.2 4.0 15.5 12.8 9.6 100.0 1.5 20.5 3.7 14.7 12.9 29.5 9.8 12.8 49.9 6.8 32.1 13.7 9.5 23.1 37.4 8.5 12.9 35.7 47.1 20.1 37.0 3.3 7.4 52.3 15.3 4.0 6.2 52.5 5.8 47.0 11.2 55.1 5.8 41.4 13.1 13.9 36.7 11.5 16.7 39.9 8.8 8.4 55.4 13.9 2.3 64.3 6.0 3.1 70.8 100.0 29.6 12.8 21.0 5.1 59.2 14.9 100.0 11.6 24.6 42.2 17.5 3.4 6.9 47.5 10.0 11.9 20.4 30.1 100.0 Other % 4.4 0.2 0.4 2.6 1.2 5.9 0.6 0.2 3.5 2.4 3.4 3.4 1.2 0.1 0.4 0.2 1.1 1.3 0.3 2011 2.3 (1.2) 1.9 0.7 11.6 5.6 (5.3) (10.0) (3.0) (5.8) (0.7) 0.9 (1.7) (2.5) 1.9 (4.8) (2.5) (0.3) 1.9 1.6 (2.0) (2.6) (2.7) 1.6 (2.5) 2.9 2.8 (5.4) 2.0 2.0 3.6 1.9 10.1 0.7 (0.6) 2.7
Table 7 Rates of Return and Asset Allocation For the Year Ended December 31, 2011 Rates of Return (%) 2011 (Below) Benchmark Benchmark 2.1 0.2 (0.4) (0.8) 0.1 1.8 0.6 0.1 5.2 6.4 5.3 0.3 (1.8) (3.5) (0.4) (9.6) 3.0 (6.0) (1.3) (4.5) 0.6 (1.3) 1.5 (0.6) 0.8 (2.5) 1.0 (3.5) 0.6 1.3 0.8 (5.6) 3.5 (6.0) 0.3 (0.6) 0.9 1.0 1.4 0.2 1.0 (3.0) 0.9 (3.5) 0.6 (3.3) 1.2 0.4 0.1 (0.1) (1.2) (1.3) (0.5) 3.4 0.1 2.7 (2.8) (2.6) 3.9 (1.9) 0.1 1.9 1.9 1.7 2.0 (0.1) 1.1 9.0 0.1 0.6 (0.1) (0.5) 0.1 2.6 5-Yr 0.4 1.9 2.3 2.6 6.0 4.6 (3.2) (5.5) (1.8) (1.4) 2.3 2.0 (3.8) 1.1 (0.9) 1.0 0.1 0.4 3.6 2.3 2.0 0.2 0.3 1.3 A 1.0 1.5 3.1 (1.3) 2.4 3.0 1.0 2.0 (0.1) (5.6) 1.1 4.0
10-Yr 4.5 3.7 2.9 3.3 5.4 5.3 1.1 (1.1) 1.3 0.8 2.6 3.9 1.4 3.9 4.7 4.2 3.2 2.6 4.1 3.6 4.9 3.3 3.8 3.2 A 2.8 3.7 3.4 3.6 3.8 3.2 3.2 4.6 2.2 (0.3) 2.1 3.8
Rank (%-ile) 10-Yr Return 89 68 36 52 98 98 5 0 6 3 27 74 6 74 92 83 48 27 81 65 94 52 71 48 A 33 68 56 65 71 48 48 90 17 0 15 71
172
Relief Association Truman Twin Lakes (City) Twin Lakes (VFD) Two Harbors Tyler Ulen Underwood Upsala Vadnais Heights Vergas Vermilion Lake Verndale Vernon Center Vesta Victoria Viking Vining Wabasha Wabasso Waconia Wadena Waite Park Waldorf Walker Walnut Grove Walters Wanamingo Wanda Warren Warroad Waseca Watertown Waterville Watkins Watson Waubun Waverly
Market Value 222,624 213,232 42,143 601,974 191,412 155,790 268,589 143,207 1,013,217 141,898 195,698 356,650 126,735 114,333 783,928 61,535 333,241 182,488 796,675 591,661 700,469 177,589 615,775 131,745 101,267 326,609 93,641 200,996 336,855 1,093,850 609,282 339,903 315,615 151,577 150,833 240,106
% of Assets at SBI 86.1 89.4 73.3 5.6 7.9 95.0 5.1 91.0 94.2 U.S. Stock % 59.9 17.6 34.6 44.0 34.3 50.9 16.9 57.0 43.9 23.7 62.9 25.1 11.7 20.1 67.6 43.2 29.1 28.4 37.2 24.6 37.3 43.2 38.9 37.4 34.0 29.0 43.4 32.5 31.2
Allocations as of 12/31/11 Int'l Stock Bond Cash % % % 24.9 15.2 24.7 75.3 11.0 39.2 30.9 18.0 39.4 8.0 25.6 30.4 9.3 90.2 9.4 17.6 38.7 100.0 9.5 28.5 2.7 8.4 16.3 58.1 33.3 9.7 8.7 18.4 17.2 4.7 10.8 60.7 100.0 5.0 32.1 15.8 8.7 49.8 6.0 46.3 27.0 4.0 8.9 55.1 13.4 8.7 10.3 13.4 33.7 9.1 17.7 26.1 24.0 11.7 7.7 51.2 11.9 29.0 20.8 100.0 8.4 15.9 51.0 27.4 28.3 7.4 100.0 19.7 10.8 25.5 52.1 9.0 9.3 32.9 16.0 28.6 7.0 25.1 7.9 49.1 12.9 16.6 24.0 15.0 27.2 24.8 14.0 100.0 10.6 20.0 38.1 Other % 1.3 0.5 8.4 0.3 11.8 0.1 0.6 9.0 11.9 0.6 3.1 1.0 1.1 0.1 (0.4) 0.8 4.4 5.3 1.1 1.0 1.5 0.1 2011 1.9 6.7 (2.7) (0.3) 2.7 1.8 0.9 0.7 (1.2) (0.4) 3.0 (1.5) (0.1) 1.8 0.9 (3.2) 1.1 (0.3) (1.5) (1.6) (0.5) (2.7) (1.3) 1.9 (0.5) (5.6) 1.5 (5.2) 3.3 2.2 (4.0) 4.7 (2.5) (3.6) 2.7 (0.3)
Table 7 Rates of Return and Asset Allocation For the Year Ended December 31, 2011 Rates of Return (%) 2011 (Below) Benchmark Benchmark 2.9 (1.0) 1.6 5.1 1.5 (4.2) 0.4 (0.7) 2.9 (0.2) 0.8 1.0 0.1 0.8 0.1 0.6 (0.6) (0.6) 0.1 (0.5) 3.3 (0.3) 0.2 (1.7) 0.3 (0.4) 0.9 0.9 1.0 (0.1) (1.8) (1.4) 2.4 (1.3) 0.5 (0.8) (0.3) (1.2) 0.4 (2.0) (0.6) 0.1 (1.0) (1.7) 0.3 (1.6) 0.1 1.8 0.1 (0.6) (1.2) (4.4) 0.1 1.4 (1.5) (3.7) 2.3 1.0 1.7 0.5 (2.2) (1.8) 3.0 1.7 0.3 (2.8) (1.6) (2.0) 0.1 2.6 0.0 (0.3) 5-Yr 2.5 3.7 (4.6) 4.8 2.0 3.6 1.9 2.3 0.7 1.7 2.8 0.0 0.5 2.4 1.3 A 0.5 0.0 0.9 0.4 1.6 1.6 (0.3) 0.5 1.8 (1.6) 0.1 2.9 0.8 2.2 2.6 1.5 2.5 (0.8) 2.9 3.6 (0.2)
10-Yr 4.2 3.4 (0.3) 5.7 2.9 3.8 3.2 2.4 3.3 3.4 4.6 3.9 2.0 3.0 2.0 A 2.1 2.3 2.4 3.0 3.9 3.3 2.3 3.0 2.0 1.3 4.2 2.9 3.5 3.9 4.7 3.3 4.0 3.4 6.6 3.9 2.8
Rank (%-ile) 10-Yr Return 83 56 0 99 36 71 48 22 52 56 90 74 13 41 13 A 15 19 22 41 74 52 19 41 13 6 83 36 61 74 92 52 79 56 100 74 33
173
Market Value 1,887,553 256,753 391,105 170,423 314,268 5,321,184 141,945 479,668 5,223,158 169,735 C 128,651 192,251 386,356 762,125 277,560 372,511 298,255 217,750 123,904 6,363,953 121,844 1,105,847 149,250 127,179 296,070 290,099 485,246 238,882 538,404 $ 432,863,754
Legend A = The relief associations and the Voluntary Statewide Lump-Sum Volunteer Firefighter Retirement Plan did not exist for either the full five-year or ten-year period during which the rates of return were calculated. B = The total rate of return is calculated by dividing total investment earnings by beginning of year total investments. C = These relief associations joined the Voluntary Statewide Lump-Sum Volunteer Firefighter Retirement Plan on January 1, 2012. The assets of these relief associations were transferred to the State Board of Investment at the end of 2011, so there were no market values or asset allocations for these associations.
Relief Association Wayzata Welcome Wells Wendell West Concord West Metro Westbrook Wheaton White Bear Lake Williams Willmar Willow River Wilmont Wilson Windom Winnebago Winsted Winthrop Wolf Lake Wood Lake Woodbury Woodstock Worthington Wrenshall Wright Wykoff Wyoming Zimmerman Zumbro Falls Zumbrota Totals
% of Allocations as of 12/31/11 Rates of Return (%) 2011 (Below) Assets U.S. Stock Int'l Stock Bond Cash Other at SBI % % % % % 2011 Benchmark Benchmark 20.8 12.0 56.9 3.8 6.5 1.3 3.8 (2.5) 100.0 2.7 0.1 2.6 37.7 16.0 4.2 41.7 0.4 (3.3) (1.6) (1.7) 100.0 3.3 0.1 3.2 100.0 1.4 0.1 1.3 61.2 18.1 15.0 3.9 1.8 (5.2) (1.4) (3.8) 9.4 5.0 17.6 66.6 1.4 2.2 0.9 1.3 58.2 6.3 13.6 21.2 0.7 (4.5) 0.7 (5.2) 65.3 3.8 12.9 15.9 2.1 (3.2) 0.3 (3.5) 97.9 71.2 23.4 5.4 2.2 2.6 (0.4) (6.1) 1.4 (7.5) 51.0 45.6 5.4 49.0 1.8 2.0 (0.2) 35.2 14.7 12.9 36.9 0.3 0.3 (0.7) 1.0 33.1 17.6 10.0 37.5 1.8 0.0 (1.4) 1.4 41.8 10.4 36.0 11.9 (0.1) (1.6) 1.5 (3.1) 6.2 27.2 8.3 54.9 1.6 8.0 (0.3) 3.2 (3.5) 22.2 12.3 39.2 25.7 0.6 (3.9) 0.1 (4.0) 31.6 16.6 8.6 40.7 2.5 (0.5) (1.8) 1.3 19.3 6.1 52.9 17.3 4.4 2.3 3.2 (0.9) 32.6 10.8 26.5 28.7 1.4 (3.1) (0.4) (2.7) 100.0 49.6 12.7 7.9 29.8 (1.2) (1.0) (0.2) 74.1 56.2 16.6 27.2 1.7 1.7 0.0 8.1 64.7 13.3 13.3 0.6 (3.3) 0.5 (3.8) 40.0 54.9 7.6 32.5 4.3 0.7 1.5 1.8 (0.3) 69.1 41.4 24.2 34.4 2.5 3.0 (0.5) 23.2 37.5 20.2 22.4 18.5 1.4 (2.5) (1.1) (1.4) 75.0 27.6 45.1 27.3 4.9 3.8 1.1 34.9 1.2 63.9 (0.2) 0.0 (0.2) 86.7 58.2 4.0 21.8 16.0 1.2 1.8 (0.6) 35.8 15.2 11.2 37.1 0.7 (2.4) (1.0) (1.4) B 24.2 % 42.3 % 9.4 % 25.3 % 21.4 % 1.6 % (0.8) %
Table 7 Rates of Return and Asset Allocation For the Year Ended December 31, 2011
5-Yr 10-Yr 3.1 4.2 3.5 3.7 0.9 2.8 3.6 3.9 2.9 3.0 1.3 3.9 2.7 3.4 1.7 4.3 1.5 4.8 1.8 4.1 (3.6) 1.0 2.3 3.7 1.5 2.6 1.8 4.3 0.6 3.9 5.2 5.0 (2.9) 2.0 0.2 1.8 0.7 2.9 (0.6) 2.0 0.4 3.5 2.1 3.5 0.7 3.9 0.6 3.4 2.3 4.2 0.6 3.2 4.6 4.8 2.7 3.3 1.9 4.2 (0.9) 1.8 1.2 % 3.4 %
Rank (%-ile) 10-Yr Return 83 68 33 74 41 74 56 86 93 81 4 68 27 86 74 96 13 10 36 13 61 61 74 56 83 48 93 52 83 10
This page is intentionally left blank.