319 A publication of
CHEMICAL ENGINEERINGTRANSACTIONS VOL. 43, 2015 ChiefEditors:SauroPierucci,JiříJ.Klemeš Copyright © 2015, AIDIC ServiziS.r.l., ISBN 978-88-95608-34-1; ISSN 2283-9216
The Italian Association of Chemical Engineering Online at www.aidic.it/cet
DOI: 10.3303/CET1543054
Simulation, Analysis and Optimization of Sugar Concentration in an In Situ Gas Stripping Fermentation Process for Bioethanol Production Gustavo H. S. F. Ponce*a, Júlio C. C. Mirandaa, Rubens Maciel Filhoa, Rafael R. de Andradeb,Maria R. M. Wolfa a Laboratory of Optimization, Design and Advanced Control. School of Chemical Enginnering. University of Campinas. P.O. Box 6066, 13083-970, Campinas-SP, Brazil. b Department of Exact and Earth Sciences, Federal University of São Paulo, 09972-270, Diadema-SP, Brazil.
[email protected]
Ethanol production in Brazil is carried out through biological routes where yeasts are generally employed. For greater flexibility, ethanol production is linked to the sugar production. In this configuration, the main byproduct of sugar production (molasses containing about 50 % wt in sugars) can be widely used for ethanol production. Nonetheless, due to strong ethanol inhibition, molasses dilution is necessary in order to maintain ethanol concentration in the broth below the threshold of toxicity at the end of fermentation. Hence, large amounts of water are added to the process resulting in higher costs of separation and plant design (since larger equipments are necessary). One way to solve these problems is couple fermentation to a continuous product removal technique such as in situ gas stripping fermentation process. This simple and inexpensive technique, which consists basically of a fermentor, a condenser and a pump for circulating gases, is used to remove volatile inhibitors continuously. In this work, in situ gas stripping on lab-scale was studied using ASPEN PLUS® V.7.3 aiming to evaluate the impact of sugar concentration in feed stream on the overall process. The gas flow rate was varied for three different levels of sugar concentration in the feed (20, 30 and 40 % wt).The main goal was to evaluate the sugar concentration ranges where more ethanol can be stripped compared with water, maintaining the ethanol concentration below the threshold of toxicity in the broth. Optimized sugar concentration were found after analyzing the following output variables: ethanol stripped (%), ethanol concentration in condensate (w/w), ethanol recovered (%), selectivity and ethanol mass fraction in the broth (w/w).
1. Introduction Ethanol is a clear colorless, volatile, and flammable liquid also known as ethyl alcohol. It has been produced and used in aqueous solutions as in alcoholic beverages for thousand years; however ethanol application in the fuel market, as an alternative fuel to fossil fuels, configured its major acting. Ethanol can be produced synthetically from oil/natural gas or biologically through sugar substances, starchy materials and recently lignocellulosic materials (Taherzadeh et al., 2014). The biological route accounts for more than 95 % of all the ethanol produced worldwide. Brazil and US are the dominant industrial players, accounting for 87 % of global fuel production. According to RFA (Renewable Fuels Association), only Brazil produced the equivalent of 21,111 ML of ethanol in 2012, equivalent to 96 % of all ethanol produced in Latin America (Bajpai, 2013). In Brazil, bioethanol is manufactured employing sugarcane as raw material. Fermentation is the main step in the overall process for fuel ethanol production. Due to extensive studies conducted in the area and their time of use in the industry (about 30 y), ethanol fermentation technologies based on sucrose, mainly sugarcane juice and molasses, can be considered relatively mature. However, many research efforts are being made worldwide in order to improve the efficiency of the process. In particular, these efforts are aimed at increasing
Please cite this article as: Ponce G., Miranda J., Maciel Filho R., Andrade R., Wolf Maciel M.R., 2015, Simulation, analysis and optimization of sugar concentration in an in situ gas stripping fermentation process for bioethanol production, Chemical Engineering Transactions, 43, 319324 DOI: 10.3303/CET1543054
320
conversion of feedstock and ethanol productivity, and at reducing production costs, especially energy costs (Cardona et al., 2010). Alcoholic fermentation is subjected to product inhibition. The maximum ethanol concentration in which cell growth ceases is 100 g/L while for concentrations of 105 g/L, the ethanol formation by Saccharomyces cerevisiaeis completely inhibited (Atala, 2004; Palacios-Bereche et al., 2014). Thus, to achieve complete conversion of sugars, fermentation has to be conducted in a relatively dilute sugar solution (15 to 16 % w/v). Hence, sugarcane molasses (about 52 % w/w of sugar) which is the main sugar raw material of fermentation, and by-product of the sugar production, needs to be diluted (conditioned). Such procedure increases costs in the downstream processing of ethanol (evaporation, centrifugation and distillation). By reducing loads on dewatering equipments, less energy could be expended in downstream processes as well (Taylor et al., 2010). In situ removal of ethanol using technologies such as gas stripping, could slow ethanol accumulation and delay product inhibition (Singh et al., 2014). In addition to this, higher sugar fermentation loads are allowed and higher fermentation yields are expected. Gas stripping is a chemical separation process where target compounds are removed from an aqueous solution by bubbling gas from the bottom of the reactor. The mass transfer occurs at the interface of liquid and vapor phases in which the target compounds volatilize faster than water to be separated (Liao et al., 2014). Because of low cost, simple operation and biocompatibility, gas stripping has been used in different biological processes (Ezeji et al., 2012). The main goal of this work was to evaluate the sugar concentration range in the feed stream where more ethanol can be stripped over water maintaining ethanol concentration below the threshold of toxicity in the broth. For this reason, process simulations were carried out employing ASPEN PLUS® V.7.3 software. Sensitivity analysis were performed acting as a significant tool to recognize variable impacts in the final results, helping the outline applicable feed concentration ranges liable to utilization. Best sugar concentrations were found after analyzing the following output variables: ethanol stripped (%), ethanol mass fraction in condensate (w/w), overall separation efficiency/ethanol recovered (%) selectivity and ethanol mass fraction in the broth (w/w).
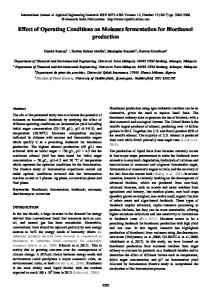
2. Simulation of in situ gas stripping technique The material and energy balances, as well as flow rate information of gas stripping fermentation, were generated using Aspen Plus process simulation software packages. The overall flowsheet of fermentation with in situ gas stripping process is shown in Figure 1, as follows:
Figure 1: Schematic flowsheet of continuous fermentation process with in situ gas stripping Basically, the simulation accounts with a carrier gas (CO2) which is introduced into a bioreactor, inducing ethanol evaporation, which after passing through a condenser is recovered by condensation. The carrier gas
321
is then recycled back to the reactor by a gas pump to be used to recover more ethanol from the fermentation broth (Durre et al., 2013). In the simulation environment, the stripping and condensation steps, which occur originally in the bioreactor and condenser, were simulated with a flash drum block at the same conditions of reactor and condenser (in this order). The Saccharomyces cerevisiae fermentation reactions were carried out in a conversion block. The fermentation step was conducted continuously. The fermentation conversion was set according to industrial data of large scale units. Molasses sugars were approached to being only glucose. Thus glucose utilization was established as 94.63 %, with 1.37 % glucose converted into yeast cells. Ethanol, glycerol, succinic acid, and isoamyl alcohol yields were 0.9048, 0.0267, 0.0029, 0.0119 and 3.1x10⁻⁶ g/(g glucose), respectively (Dias, 2008). A portion of the gas flow rate product (P1) was purged from the system in order to avoid gas accumulation. Hence, small portions of CO2 need to be added to the system. Further details about simulation procedures can be found elsewhere (Ponce et al., 2014). Activity coefficient on the liquid phase was calculated by NRTL (Non-Random Two-Liquid) model. To calculate the non-idealities of the vapour phase, the Hayden-O'Connell model was used (NRTL-HOC package). According to Dias (2008), NRTL model provides the best estimation for the boiling temperature of sucrose solutions, likewise Hayden-O'Connell equation reliably predicts solvation and dimerization, as occurs with mixtures containing carboxylic acids (acetic acid) (Van der Merwe, 2010). 2.1 Variable output calculation To evaluate the performance of the gas stripping fermentation (based on Figure 1), three parameters were calculated basing on the following Eqs (1), (2), (3). The calculation of ethanol stripped from fermentation can be defined as: Strip. Ethanol (%)=(Ethanol flow in A5 stream(Kg/h))/Ethanol flow in A3 stream (Kg/h))
(1)
The ethanol selectivity (α) corresponding to the equilibrium phases was defined as: α =[(x1/(1-x1))/(x2/(1-x2))]
(2)
Where, x1= Ethanol mass fraction in condensate (O1 stream) and x2 =Ethanol mass fraction in the broth (A6). The overall separation efficiency of ethanol can be defined as: Ethanol Recovered (%) = (Ethanol flow in O1 stream (Kg/h))/(Ethanol flow in A3 stream (Kg/h))
(3)
Briefly, the main streams A1, A3, A5, A6, O1, O3, P1, P2, R2 mean, respectively: feed stream; fermented broth; ethanol and water stripped; stripped broth; ethanol and water condensed mixture; broth to downstream process; gas vented; yeast purged; recycled gas.
3. Results and Discussion Simulations were carried out according with conventional values of process variables, respecting to the laboratory applicable ranges (2 L/day of broth fed into the system to produce about 0.2-0.5 L/day of ethanol). Thus, the gas stripping fermentation process was conducted continuously at -2 º C of cooling temperature (at the condenser) and the temperature of fermentation was set to 34 º C. Three different levels of glucose concentration in feed were evaluated: 20, 30 and 40 wt %. Such sugar concentration ranges are quite above those usually used in conventional distilleries, allowing an intensive impacts verification of this values in the process. The behavior of different sugars concentrations in gas stripping fermentation was evaluated by varying the gas flow fed to the system. The gas flow rate is the most important process variable because it is the medium where ethanol reaches equilibrium with vapour phase and leaves the liquid phase. Thus, sensitivity analysis was performed varying the gas flow rate for different loads of sugar in the feed stream (A1- Figure 1), aiming the following outputs: stripped ethanol (%), mass fraction of ethanol in the condensate (w/w), selectivity, ethanol recovered (%) and the mass fraction of ethanol in the broth (w/w). Results are presented qualitatively and can be seen in Figures 2 and 3. From Figure 2.A it is possible to observe that, proportionally, there is no difference in the amount of ethanol stripped from the process regarding different concentrations of sugars in the feed stream, since the profiles are overlapped. The percentage of ethanol stripped follows a parabolic profile (with CO2 flow rate) and it is inversely proportional to the weight fraction of ethanol in the condensate (Figure 2.B). For the gas flow rate of 5 L/min at a temperature of 34 °C (temperature of fermentation), about 65 % of all ethanol is transferred to the gas stream, and the mass fraction of ethanol in the condensate varies between 0.22 – 0.55 wt % ethanol. Following the same example of gas flow rate (5 L/min), the difference in ethanol concentration in the condensate verified in the whole chart of Figure 2.B are well pronounced, reaching on average ~ 20 wt %
322
(0.20 (w/w)) of difference between the levels 40 and 20 wt % of sugar in the feed. It is well noted that higher concentrations of sugars in the feed promotes higher concentrations of ethanol in condensate. On the other hand, as the gas flow rate increases, the ethanol concentration in the condensate decreases (inversely proportional behavior). Lu (2011), using synthetic solutions of butanol, studied how different gas flow rates influenced the recovery rate of butanol as well as its concentration in the condensate. Likewise the simulation results obtained in this work, the author's experimental results (Lu, 2011) showed higher recoveries of solvent (butanol) at higher gas flow rates. The results also showed an inversely proportional effect in the solvent condensate concentration due to increase of gas flow rate. When the gas flow is increased, a greater amount of water is transferred to the vapor phase. Furthermore, a large amount of water compared to ethanol is condensed, and this causes a condensate dilution, which, in turns, decreases ethanol concentration (Ponce et al. 2014). 40 wt%
20 wt%
A
90
Stripped Ethanol (%)
30 wt%
B
75
60
45
30 3
4
5
6
7
8
9
40 wt% 75
Ethanol Reecovered (%)
C
30 wt%
20 wt%
D
65 55 45 35 25 3
4
5
6
7
8
9
Gas Flow Rate (L/min)
Figure 2: Gas flow rate influence for several loads of sugar in the feed stream on behavior of: ethanol stripped to vapour phase (A), condensate mass fraction (B), selectivity (C) and ethanol recovered (D) The ethanol concentration in the carrier gas can be correlated to the Selectivity (Figure 2.C). The selectivity is directly related to the thermodynamic equilibrium between the phases, which in turn, correlates mainly with non-idealities in liquid phase (activity), absolute pressure and saturation pressure to compositions of a specific component in both phases. The selectivity is correlated through a distribution coefficient between liquid and vapor phases, termed in this work by the letter α. Basically, the greater the value of α, higher the concentration of ethanol in vapor phase (in this case this concentration is referred to the ethanol after condensation/ O1 stream in Figure 1) with respect to ethanol concentration in the liquid phase (broth). The selectivity was defined in Eq. (3), therefore, higher values of α portray best separation efficiencies of the process. In Figure 2.C, it is shown how selectivity changes slightly when the gas flow is increased (between 7.0-7.7). Unlike fermentation temperature (which changes the parameters of thermodynamic equilibrium), the gas flow rate has little influence on the equilibrium (values remained at a level of 7). In fact, selectivity showed higher values at lower gas flow rates and sugar loads in the feed. It occurs partly because less water is transferred to the vapor phase proportionally in this situation. On the other hand, at higher sugar concentrations, the effect
323
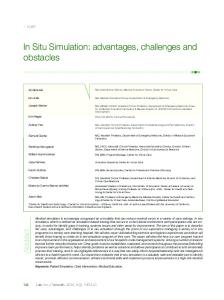
was the opposite, α was increased gradually as the gas flow rates was raised. In general, higher ethanol concentrations in the broth (higher concentrations of sugars in the feed) increase α, mainly because the condensation behavior. Higher ethanol concentrations in the main broth result, proportionally, in a higher ethanol condensation, increasing the selectivity of the process. Again, using 5 L/min of gas flow rate as example, selectivity ranged slightly between 7.2 and 7.4, not reaching more than 7.66 for 40 wt% of sugar concentration and 9 L/min of gas flow rate. The ethanol recovered percentage or overall separation efficiency has shown a different behavior in comparison to the selectivity, even though the two response profiles relate similar variables (concentration of ethanol in condensed and in the broth). The difference in this particular case is that the flow of the stream entering in the flash (A3) and the flow of condensate stream (O1) influence the total amount of ethanol recovered from the process. From Figure 2.D it becomes clear that the increase of the gas flow rate and concentration of sugars in the feed increase the overall separation efficiency of ethanol. In this situation, the percentage of ethanol recovered in the condensate stream could reach values up to 77 % of the total amount of ethanol present in the broth stream (A3). Comparing the Figures of stripped ethanol (%) and overall efficiency of ethanol recovered (Figure 2.A and D, respectively), it can be seen that a significant percentage of ethanol is not recovered in the condensation step. Actually, a portion of ethanol is not condensed and returns back to the fermentor diminishing the overall separation efficiency. The values of recovering ethanol in the condensate are different for each concentration of sugars in the feed. On average, only 70 % of ethanol entering in the condenser effectively condenses in the condensation temperature (- 2 º C), which explains the low ethanol recovery values related to the high amounts of ethanol stripped. It is also necessary to evaluate the effects of different concentration of sugars in the feed regarding the remaining ethanol concentration in the broth after gas stripping. The ethanol concentration must be kept in much lower levels of complete inhibition concentration (105 g/L). Normally the concentration achieved industrially at the end of the alcoholic fermentation in Brazil is about to 8 wt % (Palacios-Bereche et al., 2014). It was shown in Figure 3 that the increase of gas flow rate applied to the system diminished the mass fraction of ethanol in the broth. Another feature was that such profiles (ethanol concentration in the broth) also showed a curved behavior. In addition, higher values of ethanol in the broth are always observed for higher loads of sugars in the feed. Utilizing about 6 L/min of carrier gas flow rate (at 34 ° C) it was possible to reduce the ethanol concentration below the threshold of toxicity and keep it next to 8 wt % for 20 wt % and 30 wt % of sugar concentrations in the feed. Analyzing the feed load of 40 wt % of sugars, it was not possible to keep ethanol concentration at allowable levels for Saccharomyces cerevisiae. For this case, to reach 8 wt % of ethanol in the main broth it is necessary to feed 10.4 L/min of gas flow rate in the system.
Figure 3: Gas flow rate influence in ethanol mass fraction in the broth for several loads of sugar in the feed stream Operations at higher sugar concentration in the feed and lower gas flow rate leads to ethanol concentration in the fermentor closer to the threshold of toxicity. In the same way, ethanol reaches low concentrations in the
324
broth when higher gas flow rate and lower concentration of sugar in the feed are applied. The weight fractions of ethanol in the condensate and in the broth (Figure 3) are the main variables that should be taken into account when the optimization of the sugar concentration in feed stream is performed. The concentration of ethanol has to be specially evaluated since low concentrations in condensate raise the energy requested in the end-of-pipe alcohol recovery process to produce ethanol fuel (Ponce et al., 2014). This work showed that the optimal operating condition for the gas stripping fermentation are 30 wt % for sugar concentration, and nearly 6 L/min for gas flow rate. This choice was because such values bring a better relation between the concentration of ethanol in the condensate and the ethanol recovered in the process without exceeding the inhibition concentration limits for yeast metabolism.
4. Conclusion In this work it was evaluated the influence of sugar concentration in the feed stream in a continuous gas stripping fermentation. Response graphs varying the gas flow for three different levels of sugars in the feed stream were obtained. Sugar concentration presents a peculiar behavior regarding to the different analysis of the observed responses. Observing mainly the weight fraction of ethanol in the condensate and ethanol recovery (%) in the process, respecting the threshold of toxicity of ethanol in the broth, sugar loads nearly of 30 wt % in the feed and gas flow rate about 6 L/min lead to a better efficiency of the process as a whole. Acknowledgments The authors are grateful to CNPq and FAPESP for the financial support. References Atala D.I.P., 2004, Assembly, instrumentation, control and experimental development of an extractive fermentation process for ethanol production. PhD Thesis. Campinas, SP, Brazil: Faculty of Food Engineering, University of Campinas [in Portuguese]. Bajpai P., 2013, Advances in Bioethanol, SpringerBriefs in Applied Sciences and Technology, DOI: 10.1007/978-81-322-1584-4_7. Cardona C.A., Sanchez O.J., Gutierrez L.F., 2010, Process Synthesis for Fuel Ethanol Production. CRC Press, Boca Raton, the USA. Dias, M.O.S., Ensinas, A.V., Nebra, S.A., Maciel, R.F., Rossell, C.E.V., Wolf, M.R.M., 2009, Production of bioethanol and other bio-based materials from sugarcane bagasse: integration to conventional bioethanol process. Chemical Engineering Research and Design, 87, 1206-1216. Durre P., Schiel-Bengelsdorf B., Montoya J., Linder S., 2013, Butanol Fermentation. Environmental Technology, 34, 1691-1710. Ezeji T.C., Qureshi N., Blaschek H.P., 2013, Microbial production of a biofuel (acetone-butanol-ethanol) in a continuous bioreactor: impact of bleed simultaneous product removal. Bioprocess Biosystem Engineering, 36, 109-116. Liao Y.C., Lu K. M., Li S.Y., 2014, Process parameters for operating 1-butanol gas stripping in a fermentor. Journal of Bioscience and Bioengineering, 118, 558-564. Lu C.M.S., 2011, Butanol Production from LignocellulosicFeedstocks by Acetone-Butanol-Ethanol Fermentation with Integrated Product Recovery. PhD Thesis, University of Ohio, Unites States. Palacios-Bereche R., Ensinas A., Modesto M., Nebra S.A., 2014, New alternatives for fermentation process in the ethanol production from sugarcane: Extractive and low temperature fermentation. Energy, 70, 595-604. Ponce G.H.S.F., Miranda J.C.C., Alves M., Wolf M.R.M., MacielFilho R., Andrade R.R., Conto L.C. Simulation, 2014, Analysis and Optimization of an In Situ Gas Stripping Fermentation Process in a Laboratory Scale for Bioethanol Production. Chemical Engineering Transactions, 37,295-300. Singh V., Tumbleson M.E., Rausch K.D., Huang H., Shihadeh J.K., 2014, Vacuum Stripping of ethanol during high solids fermentation of corn, Applied Biochemical Biotechnology, DOI 10.1007/s12010-014-0855-9. Taherzadeh M.J., Lennartsson P.R., Teichert O., Nordholm H., 2014, Bioethanol Production Processes. Biofuels Production, Scrivener Publishing LLC, 211-254. Taylor F., Marquez M.A., Johnston D.B., Goldberg N.M., Hicks, K.B., 2010, Continuous high-solids corn liquefaction and fermentation with stripping. Bioresource Technology, 101, 4403-4408. Van der Merwe A., B., 2010, Evaluation of different process design for biobutanol production from sugarcane molasses, MSc Dissertation, University of Stellenbosch, South Africa.