Scientific Bulletin. Series F. Biotechnologies, Vol. XX, 2016 ISSN 2285-1364, CD-ROM ISSN 2285-5521, ISSN Online 2285-1372, ISSN-L 2285-1364
OPTIMIZATION OF HYDROLASE ENZYME DOSAGE IN THE PROCESS OF CELLULOSE HYDROLYSIS OF REJECT PULP AND BIOETHANOL FERMENTATION BY MICROBIAL CONSORTIUM RATU SAFITRI1, ATHENA DINANTY1, GUSTAN PARI2, MOH. NURZAMAN1 1
Department of Biology, Faculty of Mathematics and Natural Sciences, Padjadjaran ¬University. Jl. Raya Sumedang-Jatinangor Km-21, West Java, Indonesia. 1 Study Program of Biotechnology, Postgraduate Study, Universitas Padjadjaran, Jl. Dipati Ukur no. 35, Bandung, West Java 2 Centre for Research and Development of Forest Products. Jl. Gunung Batu No.5, Bogor, Indonesia. Corresponding author email:
[email protected] Abstract The purpose of this study was to obtain effective dose of hydrolase enzyme (α-amylase, hemicellulase, cellulase and amyloglucosidase) to produce highest levels of reducing sugars and dextrose equivalent (DE), and also to obtain the best microbial consortium in the fermentation of cellulose from pulp waste to produce bioethanol. This research used descriptive and experimental methods. The descriptive method was used in the optimization of hydrolase enzyme dosage, while the experimental method was used in cellulose of reject pulp fermentation. Parameters used in this study consist in ethanol content, reducing sugar content, microbial population and DE. Our results showed that the highest levels of reducing sugars in the optimization process of α-amylase enzyme was obtained at a dose of 0,52 µL g1whereas hemicellulase enzyme was at a dose of 2/3 or 0.00067 g g-1 and cellulase as well as amyloglucosidase was at a dose of 1 + 1 or 0.83 µL g-1 and 0,56 µL g-1, respectively. Additionally, the most effective and optimum fermentation was obtained by a consortium of Kluyveromyces marxianus and Zymomonas mobilis (K2), with ethanol content and fermentation efficiency as much as 6.27 and 59.48%, respectively. High levels of ethanol produced was also supported by the lowest reducing sugar content of 1.32% with the average of DE 1.69. Moreover, ethanol yield (Yp/s), maximum specific ethanol productivity (qp) and cell yield (Yx/s) were also obtained at 21, 76 and 26%, respectively. We observed that consortium K. marxianus and Z. mobilis (K2) reached the highest logarithmic phase at 36th hour, with a population of 11,80x10¹⁰ cfu mL-1. Key words: Reject Pulp, Hyrolase Enzyme, Microbial Consortium, dextrose equivalent (DE). Abbreviations: DE = dextrose equivalent; ADH = alcohol dehydrogenase ; YEPDA = yeast extract peptone dextrose; YEPDB = yeast extract peptone dextrose broth; SFS = Simultaneous Saccharification and Fermentation
INTRODUCTION The use of fossil fuels continues to increase along with a wide range of human needs, such as industrial activities, usage for power generation and as fuel for transportation. The elevated usage of fossil fuels has given unfavourable impact on the environment. One of the solutions to overcome this problem is to use alternative fuels that are environmental friendly. Currently, ethanol has been recognized as one source of energy that can replace fossil fuels. Ethanol is usually made chemically, but this method is less environmental friendly. Therefore, ethanol needs to be produced using microorganisms through fermentation.
Ethanol produced by microorganisms, is recognized as bioethanol. This substance is a liquid that is produced through the fermentation of sugars from the decomposition of carbohydrate sources with the help of microorganisms (Retno and Nuri, 2011). Basic ingredients for creating bioethanol can be obtained from biomass waste, which contains a lot of carbohydrates or lignocellulose, such as agricultural waste (banana stem and palm oil), industrial waste (paper and pulp) and others. Organic components of lignocellulose is abundant in nature and consists of three types of polymers, namely cellulose, hemicellulose and lignin (Maulana et al 2013).
300
Laboratory of Chemical and Energy Management of Forest Products, Research and Development Center of Forest, Bogor. They consisted of distilled water, alcohol (75%), [NH4]2SO4 (4%, b/v), 1 N HCl, H2SO4, commercial enzyme of cellulase, α-amylase, hemicellulase and amyloglucosidase, isolates of S. cerevisiae isolates of Z. mobilis, isolates of K. marxianus, potassium dichromate, 1 N NaOH, peptone, DNS reagent, yeast extract, YEPDA (yeast extract peptone Dextrose), and YEPDB (yeast extract peptone dextrose broth).
Reject pulp is a lignocellulosic biomass derived from wood pieces that are not perfectly processed in the digester of pulp and paper industry. From preliminary research, it was known that the lignocellulose in the reject pulp contains cellulose (57.89%), hemicellulose (11%), starch (9.03%), lignin (16.41%), extractive (1.16%) and ash (1.09%). High content of cellulose and hemicellulose, make the reject pulp as one of the potential source to be used as raw material for bioethanol. The production of bioethanol from lignocellulosic containing industrial waste such as reject pulp can be made through the conversion of carbohydrates into sugar or glucose by several methods, for instance, by acid and enzymatic hydrolysis. Enzymatic hydrolysis has been used more frequent because it is considerably more environmental friendly than the acid catalyst. An enzyme catalyst has been used more often in the process of hydrolysis enzymatic. For instance, the α-amylase enzyme, hemicellulase, cellulase and amyloglucosidase were used in different dosage: 1, 2/3 and 1/3 of the recommended dose of commercial enzymes. Glucose obtained from the hydrolysis is then processed through fermentation by adding yeast and fermentative bacteria to obtain bioethanol. The combination of yeast and bacteria in a microbial consortium is able to optimize the fermentation process from lignocellulosic waste into bioethanol. This is due to the combined action of the alcohol dehydrogenase enzyme (ADH) that is more active in yeast, such as the yeast Saccharomyces cerevisiae and Kluyveromyces marxianus as well as the enzyme pyruvate decarboxylase more active in fermentative bacteria such as the bacterium Zymomonas mobilis. Thus, in the present study, the reject pulp fermentation is processed by using microbial consortium with a combination of bacteria and yeasts, with variations in microbial consortium, the consortium of S. cerevisiae and Z. moblis (K1), a consortium of K. marxianus and Z. mobilis (K2), and a consortium of S. cerevisiae-K. marxianus-Z. mobilis (K3).
Methods In general, this study was devided into two phases: 1) optimization of enzyme dosage of αamylase, hemicellulase, cellulase, amyloglucosidase (Produces by SIGMA) for enzymatic hydrolysis and 2) fermentation of reject pulp into ethanol using three types of consortium: consortium of S. cerevisiae and Z. mobilis (K1); consortium of K. marxianus and Z. mobilis (K2); consortium of S. cerevisiae + K. marxianus + Z. mobilis (K3). The fermentation stage was carried out by using the Simultaneous Saccharification and Fermentation (SFS).
MATERIALS AND METHODS The materials required in this research were the reject pulp that has been was obtained from the
301
Procedures Optimization of Hydrolase Enzyme Dosage: Dose optimization consisted of three stages enzyme addition. The first stage was the addition of α-amylase enzyme, which was incubated for 60 minutes at 104oC with agitation 500 rpm. The second stage was the addition of hemicellulase enzymes, which was incubated for 360 minutes at 55°C with agitation 500 rpm. The third stage was the addition of cellulase enzymes and amyloglucosidase, which was incubated at 60o-62oC for 48 h with agitation 500 rpm. The four types of enzymes are added into the hydrolyzate with doses of 0, 1/3, 2/3, and 1 of the recommended dose commercially. The parameters measured in this process were a reducing sugar content (by DNS method) and dextrose equivalent (DE) value. Fermentation Process: SFS hydrolyzate produced by enzymatic hydrolysis was then fermented by using consortium of S. cerevisiae (5%, v/v) and Z. mobilis (5%, v/v) (K1); K. marxianus (5%, v/v) and Z. mobilis (5%, v/v)
respectively. These results is consistent with the effective dose of the α-amylase enzyme to hydrolyze 11.27% starch content in the newsprint waste, which was equivalent to a dose of 1 or 0.52 µL g-1 (Pangaribuan, 2014). Reducing sugar levels and high DE value is influenced by the increasing number of enzymes used. In addition, α-amylase will be more easily dispersed completely into a solution that has a high viscosity (Havier, 2007).
(K2); S. cerevisiae (3.3%, v/v) + K. marxianus (3.3%, v/v) + Z. mobilis (3.3%, v/v) (K3) to produce bioethanol. The fermentation process was conducted for 3 days (72 h) and parameters were measured every 12 h. Data analysis The parameters measured in fermentation process were ethanol content (dichromate oxidation method), reducing sugar content (DNS method), microbial population (TPC method), and the DE value. All data were statistically analyzed using analysis of variance (ANOVA) and when the difference is significant, it was then followed by Duncan's Multiple Range Test with significance level of 5%. RESULTS AND DISCUSSIONS Optimization of Hydrolase Enzyme Dosage. The aim of optimization of hydrolase enzyme dosage was to obtain an effective dose of an enzyme that enables to produce the optimum value of reducing sugars. The enzyme concentration was proportional to the rate of reaction, thus the higher enzyme concentration, the faster the rate of reaction.
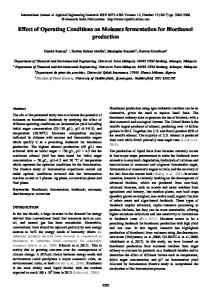
Figure 1. Reducing Sugars Level (RSL) and Dextrose Equivalent (DE, %) Value of Optimization of α-Amylase Enzyme Dosage.
Optimization of α-Amylase Dosage The purpose of liquefaction of starch gel melting process was to obtain a lower viscosity by hydrolyzing starch into simpler molecules such as oligosaccharides or dextrins through the help of α-amylase enzyme (Robi'a and Sutrisno 2015). In this study, α-amylase enzyme was used by SIGMA production, according to the dosage recommended by the product of the enzyme. Liquefaction process was lasted for 60 minutes, at 104oC and pH 6 using three variations dosage of α-amylase enzyme: dose 1 (0.52 µL g-1), dose 2/3 (0.346 µL g-1), and dose 1/3 (0.173 µL g-1). Reducing sugar levels and DE obtained as a result of optimization of amylase dosage was shown in Figure 1. Highest reducing sugar levels and DE values were observed in the reject pulp as a result of the addition of α-amylase enzyme at a dose 1 (Fig. 1). At this dose, levels of reducing sugars and DE produced was 6.89% and 8.836,
302
Optimization of Hemicelullase Dosage Hemicellulose is one of heteropolimer that is composed by polysaccharides, and many are composed by 1,4-β-xylose. In addition, these molecules are found in three groups, namely: xylan, mannan and galactans (Taherzadeh, and Karimi, 2007). Hemicellulase enzyme is known to break monomers in hemicellulose xylan into xylose (Samsuri et al., 2007). Hemicellulase enzyme used in this study is provided by SIGMA, the hydrolysis process lasted for 360 minutes, at 55°C with pH 6. Variation in enzyme dosage used was based on the recommended dosage of the enzyme product. Three variations of the enzyme dose were 1 (0.001 g g-1), 2/3 (0.00067 g g-1) and 1/3 (0.00033 g g-1). Results obtained from hemicellulose hydrolysis step were shown in Figure 2. Figure 2 showed that the highest levels of reducing sugar and DE values in the waste substrate reject pulp, were obtained by the addition a hemicellulase dose equivalent to 2/3 or 0.00067 g g-1. At this dose, the production levels of reducing sugar were 12.52% and followed by a DE value of 16.067.
and 0.56 µL g-1), 2/3 dose (equivalent to 0.553 µL g-1 and 0.373 µL g-1), and 1/3 dose (equivalent to 0.277 µL g-1 and 0.187 µL g-1). Results obtained in the optimization of enzyme dosage of cellulase and amyloglucosidase can be seen in Figure 3.
Figure 2. Reducing Sugars Level (RSL) and Dextrose Equivalent (DE, %) Value of Optimization of Hemicellulase Enzyme Dosage
This result was consistent with this dose of hemicellulase enzyme. At similar dose, the most effective in hydrolyzing hemicellulose was also obtained for banana pseudostem waste with levels of 16.02%, when a dose of 2/3 of recommended dosage for this product was used (Lubiana, 2014). In addition, the hemicellulase enzyme dosage by 2/3 of dose was recognized effective in hydrolyzing hemicellulose in stem pith of sago starch substrate, and it was able to produce a reducing sugar content by 26.6% (Fadia, 2008).
Figure 3. Reducing Sugar Levels (RSL) and Dextrose Equivalent Value (%) of Optimization of Cellulase and Amyloglucosidase Enzymes Dosage.
In Figure was shown that the the dose of the enzyme that producing the highest reducing sugar levels and DE values was obtained at dose 1+1 of cellulase and amyloglucosidase, or the equivalent to 0.83 and 0.56 µL g-1, respectively. The levels of reducing sugars produced was 71.362% with DE 91.580. In accordance with the study (Pangaribuan, 2014), the cellulose content of 43.17%, was also contained in the newspaper waste and it was effectively hydrolyzed by using a dose of 1 + 1 cellulase and amyloglucosidase enzymes with a reducing sugar levels and the resulting final DE value: respectively by 70.42 and 86.28%. In addition, the process of saccharification produced reducing sugar levels and the highest DE values with a dose of 0.5 µL g/1, or about the dose of 1 (Musanif, 2014). Based on the data listed in Table 1 it was shown that the consortium Kluyveromyces marxianus and Zymomonas mobilis (K2) was the consortium that produced the highest levels of ethanol during bioethanol fermentation of reject pulp, reaching the amount of 6.274%. The increased levels of ethanol during bioethanol fermentation of reject pulp is presented in Figure 4.
Optimization of Cellulase and Amyloglucosidase Dosage Optimization of cellulase and amyloglucosidase enzymes dosage (saccharification process), was the final stage of the optimization of hydrolase enzyme dosage. At this stage, dextrin produced in the liquefaction process was broken down into glucose by amyloglucosidase. In addition, the cellulose molecules still being contained in the reject pulp were able to be broken down by the cellulase. Cellulase and Amyloglucosidase (AMG) enzymes used were provided by SIGMA. These two enzymes have worked synergistically and reached an optimum value at pH 4.8 at 60o-62oC for ± 48 h. Both of these enzymes were incorporated into the reject pulp waste substrate simultaneously in different dosage: dose of 1 (equivalent to 0.83 µL g-1
303
Table 1. Parameter of Analysis of Bioethanol Fermentation of Reject Pulp using Microbial Consortium
Parameter
Consorsium S. cerevisiae & Z. mobilis (K1)
Consortium K. marxianus & Z. mobilis (K2)
Consortium S. cerevisiae-K. marxianusZ. mobilis (K3)
Reducing Sugar Levels (0h, %)
22.410
22.347
22.535
Reducing Sugar Levels (72h, %)
1.565
1.315
1.440
Dextrose Equivalent Value (72h)
2.01
1.69
1.85
Ethanol Content (72h, %)
5.819
6.274
6.083
55.01
59.48
56.99
10.94 x 10¹⁰
11.80 X 10¹⁰
13.19 X 10¹⁰
20
21
19
62
76
72
21
26
23
Efficiency of Fermentation (%) Microbial Population in Logarithmic Phase (x 1010 CFU mL-1) Yp/s (ethanol yield, %) qp (maximum ethanol productivity, %) Yx/s (cell yield, %)
Jarusalem artichoke tuber origin showed a reduction in sugar yield (168 g kg-1) with ethanol production by 9.9% (v/v) after the distillation process was made (Szambelan, Nowak, and Jelen, 2005). Additionally, efficiency of fermentation (EF) of different microbial consortium during bioethanol fermentation process on the reject pulp was calculated. Our findings showed that the highest EF was obtained in K2 (59.48%). Whereas K1 and K3 had lower value of EF (55.01 and 56.99%). These results indicated that the consortium K2 were the best in the fermentation process from the reject pulp, which is confirmed by the highest production of ethanol and EF. The microbial consortium was capable to produce a combined activity of various enzymes of microorganisms so that the ethanol production run more optimally (Howard, Masoko and Abotsi, 2003). K. marxianus yeasts was able to utilize glucose, xylose, mannose and galactose, and turned it into higher amount of ethanol compared to the one produced by the yeast Saccharomyces cerevisae (Rouhollah et al., 2007, Gao et al., 2015). The activity of yeast K. marixanus that was used to produce ethanol was also supported by the ability of fermentative bacteria Z.
Figure 4. Graphic of Ethanol Content (%) During Bioethanol Fermentation from Reject Pulp Process.
Consortium of K. marxianus and Z. mobilis (K2) produced the highest ethanol content (6.274%), whereas consortium of S. cerevisiaeK.marxianus- Z. mobilis (K3) produced lower ethanol content (6.083%). Additionally, the consortium of S. cerevisiae and Z. mobilis (K1) produced the lowest ethanol during fermentation (5.819%). Study conducted by Gunasekaran and Kamini (1991), observed that the use of the consortium K. fragilis (synonymous with K. marxianus) (Rosa et al., 1986) and Z. mobilis was able to produce 64.4 g L-1 ethanol in 200 g L-1 of lactose medium. The use of consortium of K. marxianus and Z. mobilis in the ethanol production from
304
reject pulp fermentation process due to its ability in using 94% sugar substrates for its growth as well as generating the highest levels of ethanol compared to the two other microbial consortium.
Mobilis, which enable to convert sucrose, fructose and glucose to ethanol via the EntnerDuodoroff (Abate et al., 1996). Reducing Sugar Levels Consortium of K. marxianus and Z. mobilis (K2) became a consortium that has reached the highest level RSL during bioethanol fermentation process of the reject pulp (Table 1.) RSL observed at 0 h was 22.347% and decreased to 1.315% at 72 h. The decreased in RSL indicated the conversion of glucose into pyruvic acid via the Embden-Meyerhof-Parnas lane. This pyruvic acid enables to transform decarboxylated into acetaldehyde, then it underwent dehydrogenation into ethanol. In general, this process was catalyzed by enzymes produced by microbes. Decrease in RSL during fermentation was shown in Figure 5.
Microbial Populations Table 1 showed that consortium K3 at 48 h was the consortium with the largest population of microbes during fermentation bioethanol of reject pulp (13.196 x 10¹⁰ CFU mL-1). However, this large number of microbial populations in K3 was not accompanied by higher ethanol production compared to consortium K2 (Figure 4). A consortium of microbial population growth during bioethanol fermentation process was presented in Figure 6.
Figure 5. Graphic of Reducing Sugar Levels (%) During Bioethanol Fermentation from Reject Pulp.
Figure 6. Graphic of Microbial Consortium Populations (x1010 CFU/mL) During Bioethanol Fermentation from Reject Pulp
Consortium K. marxianus and Z. mobilis (K2) produced the lowest RSL, from 22.347% (0 h) to 1.315% (72 h) (Fig.5) Decrease in RSL observed in consortium K2 was significantly lower compared to the consortium of K1 and K3. In addition, the total RSL used by consortium K2 was approximately 94.11%. This result was similar to the study from (Szambelan, Nowak and Jelen (2005), that the consortium of K. fragilis and Z. mobilis used 99% of reducing sugar in ethanol production from Jarusalem artichoke tuber origin, where ethanol production was quite high (9.9%) after distillation process. Lower RSL produced by microbial fermentation indicates that the microbes perform optimum in fermentation process (Pandey, 2009). Therefore, the consortium K2 is considered as the best in the
At the beginning of the fermentation process, the addition in cell mass has been caused by adaptation or adjustment to the new environment. Then, the three consortiums enter in logarithmic phase at different times. Consortium K1 and K3 enter the logarithmic phase at the same time (48 h). However, the microbial population produced by K3 was larger than K1 (13.196 x 10¹⁰ and 10.944 x 10¹⁰ CFU mL-1, respectively). Moreover, consortium K2 entered the logarithmic phase at 36 h, with a population of 11.798 x 10¹⁰ CFU mL-1. Number of microbial population produced by consortium K3, was caused by the composition of the consortium itself, which consisted of three microbes. It was previously confirmed that microbial populations of mixed cultures in fermentation process is higher than
305
acetaldehyde (Fadia, 2008). The low yield of ethanol produced in this study could be caused by the formation of by product compounds from ethanol fermentation process. However, consortium K2 was the best consortium in bioethanol fermentation from pulp waste because it can produce the highest ethanol yield compared to the two others microbial consortium. Highest ethanol yield was supported by the growth of microbial biomass produced.
in single culture. However, microbial population was not proportional to ethanol production (Figure 4). Thus, consortium K3 were less effective in bioethanol fermentation from reject pulp. Furthermore, consortium K2 produced relatively less microbial populations compared to the two other consortium variations. Nevertheless, this consortium was able to produce higher ethanol content (Figure 4). Therefore, consortium K2 was considered as the best consortium in bioethanol fermentation due to their ability to take advantage of reducing sugar and to produce a high ethanol content despite their low microbial population.
Dextrose Equivalent (DE) Value Table 1 showed that the consortium K2 produce the lowest DE (1.690) during the bioethanol fermentation from reject pulp. This was due to consortium K2 were able to consume glucose available on the substrate of reject pulp as source of nutrients. DE value during bioethanol fermentation process from reject pulp was presented in Figure 7.
Relation between Reducing Sugar Level, Ethanol Content, and Microbial Populations To identify the relationship between RSL, ethanol content and microbial population, the ethanol yield (Yp/s), maximum productivity of ethanol-specific (qp) and the yield of microbial biomass (Yx/s) were calculated. Yp/s or ethanol yield represents the concentration of ethanol in comparison to the concentration of glucose consumed in the substrate. While Yx/s value or microbial yield indicates microbial biomass formed per mass of substrate consumed. Additionally, qp value or the maximum ethanol productivity represents the concentration of ethanol produced per unit of time, where higher concentration of ethanol resulting higher productivity of ethanol (Mulyanto et al., 2009). Consortium K2 gained the highest value of Yp/s, qp and Yx/s compared to other consortium (i.e. 21%, 76% and 26%, respectively). However, several studies on bioethanol fermentation using consortium of K. marxianus and Z. mobilis showed that it was able to produce ethanol yield by 42-48% (g ethanol/g substrate) (Gunasekaran and Kamini, 1991, Szambelan, Nowak and Jelen, 2005). Theoretically, from 1 g of glucose, ethanol produced was only half of the consumption of glucose, with clean ethanol coefficient (yield) for about 51% of ethanol. When the net was above 51%, there are number of substrates that are not measurable. But if the net coefficient below 51%, allegedly in the fermentation process, in addition to producing ethanol, also produced byproduct compounds, such as acids, volatile organic such as lactic acid, acetic acid,
Figure 7. Graphic of Dextrose Equivalent (DE) Value During Bioethanol Fermentation from Reject Pulp Process.
DE or the degree of conversion indicates the ability of each microbial fermentative in conversion of sugar into ethanol during the biethanol production from the reject pulp, from the total sugar content of substrate (77.92%). DE generated by each consortium of the decreased microbes (Figure 7). This decline was proportional to the decreased of (RSL) that occured during bioethanol fermentation. DE in consortium K2 decreased to the lowest point from 28.68 (0 h) to 1.69 (72 h). Consortium K1 and K3 were also able to decrease DE, for instance, from 28.76 (0 h) to 2.01 (72 h) and from 28.92 (0 h) to 1.85 (72 h) for K1 and K3, respectively.
306
Based on the impairment of DE during the bioethanol fermentation, consortium of K. marxianus and Z. mobilis was considered as the best and the most effective consortium, due to their lower DE during fermentation process. Lower DE value was achieved by better and more optimum of microbes used for fermentation process (Pandey, 2009).
Gunasekaran, P., dan N.R. Kamini. 1991. High Ethanol Productivity from lactose by immobilized Cells of Kluyveromyces fragilis and Zymomonas mobilis. World Journal of Microbiology and Biotechnology. Vol (7). Havier, M.R. 2007. Sago Starch Hydrolysis (Metroxylon sago Rottb.) And its fermentation by Saccharomyces cervisiae FNCC 3012 and stren Bacteria isolated from Tape. [Essay]. Department of Biology, State University of Padjadjaran. Jatinangor. Howard R.L., P. Masoko and E. Abotsi. 2003. Enzyme Activity of Phanerochaete chrysosporium Cellobiohydrolase (CBHI.1) Expressed as a Heterologous Protein From Escherichia coli. African J. Biotechnology, 2(9):296-300. Lubiana, Kamila. 2014. Simultaneous saccharification and Separated Waste pseudostem of Pisang Ambon (Musa x paradisiaca var. Sapientum L.) And its hydrolyzate Fermentation for Bioethanol Production. [Essay]. Jatinangor: Department of Biological Science Unpad Maulana, Arbi., Chairul, Muhammad Iwan Fermi. 2013. Effect of pH in fermentation Bioethanol from reject pulp using a method of co-fermentation Simultaneous Saccharification (SKFS). Chemical Engineering Department, University of Riau. Mulyanto., Tri Widjadja, Abdul Hakim M., Eko Frastiawan. 2009. Productivity Ethanol from molasses by Continuous Fermentation Process Using Zymomonas mobilis by Cell Immobilization Technique K-carrageenan in Packed-Bed Bioreactor. Proceedings of the National Seminar XIV-FTI-ITS. ISBN: 979-545-043-3. Musanif, J. 2014. Bioetanol. Kementrian Pertanian Indonesia. Nugroho, A. 2007. Population Dynamics Consortium hydrocarbonoclastic bacteria In Case Study Biodegradation of Petroleum Hydrocarbons Laboratory Scale. Journal of Basic Science. 8 (1): 13-23. Pandey, A. (ed). 2009. Handbook of Plant-Based Biofuels. CRC Press. USA. Pangaribuan, Franky Gamaliel. 2014. Optimization of Enzyme dose and concentration of sulfuric acid (H2SO4) Hydrolysis Against Waste Paper, and its hydrolyzate fermentation. [Essay]. Jatinangor: Department of Biology, State University of Padjadjaran Retno, D.T. & W. Nuri. 2011. Bioethanol manufacture of Banana peel. Proceedings of the National Seminar on Chemical Engineering "Kejuangan": Development of Chemical Technology for Processing of Natural Resources for Indonesia. Robi'a., Aji Sutrisno. 2015. Characteristics of Wheat Glucose Syrup Sweet Purple (Study of liquefaction temperature and concentrations of Alpha-Amylase): Reader Review. Journal of Food and Agro-Industry, Vol 3 (4). p: 1531-1537. Rosa, M. F., A. M. Vieira, dan M. L. Bartolomeu. 1986. Production of High Concentration of Ethanol from Mash, Juice, and Pulp of Jerusalem Artichoke tubers by Kluyveromyces fragilis. Enzyme Microb. Technol, Vol(8).
CONCLUSIONS Based on this study, the effective dose in the optimization of α-amylase enzyme dosage was dose of 1 with RSL 6.88% and a DE value 8.84; hemicellulase enzyme dosage was 2/3 dose with RSL 12.52% and DE value 16.07; and cellulase and amyloglucosidase enzymes dosage was dose of 1 with RSL 71.36% and DE value 91.58. Consortium Kluyveromyces marxianus and Zymomonas mobilis (K2) was the best consortium in the fermentation process of reject pulp for bioethanol since it was able to generate the highest levels of ethanol (6.274%) with 59.48% fermentation efficiency. ACKNOWLEDGEMENTS This research work was carried out with the support of Ministry of Research and Technology –Higher Education (KEMENRISTI) was financed by Hibah Stranas. REFERENCES Abate, C., D. Callieri, E. Rodrigues, O. Garro. 1996. Ethanol Production by Mixed Culture of flocculent strains of Zymomonas mobilis and Saccharomyces sp. Appl Microbiol Bioethanol. 45:580-583. Aryani, Dian., Tjahjadi Purwoko, Ratna Setyaningsih. 2004. Ethanol fermentation of sweet potato (Ipomoea batatas) by Mixed Culture of Rhizopus oryzae and Saccharomyces cerevisiae..Jurnal Bioteknologi. 1(1): 13-18, ISSN: 0216-6887. Fadia, H.N. 2008. Hydrolysis Sago pith Trunk powder (Metroxylon sago Rottb.) By Enzymatic and its hydrolyzate fermentation into ethanol by Saccharomyces cerevisiae DI / P3GI. [Essay]. Jatinangor, Department of Biology, State University of Padjadjaran. Gao, Jiaoqi., Wenjie Yuan, Yimin Li, Ruijuan Xiang, Shengbo Hou, Shijun Zhong, & Fengwu Bai. 2015. Transcriptional Analysis of Kluyveromyces marxianus for Ethanol Production From Inulin Using Consolidated Bioprocessing Technology. Biotechnology for Biofuels. 8:115
307
Rouhollah, H.; N. Iraj; E. Giti; dan A. Sorah. 2007. Mixed Sugar Fermentation by Pichia stipitis, Saccharomyces cerevisiae, and an Isolated Xylose Fermenting Kluyveromyces marxianus and Tehir Cocultures. African Journal of Biotechnology Vol. 6 (9), pp. 1110-1114. Samsuri, M.; M. Gozan; R. Mardias; M. Baiquni; H. Hermansyah; A. Wijanarko; B. Prasetya; dan M. Nasikin. 2007. Utilization of cellulose Bagas For Ethanol Production Through Simultaneous Saccharification And Fermentation With xylanase enzyme. Makara, Teknologi, Vol. 11, No. 1, April 2007: 17-24.
Szambelan, K., J. Nowak, dan H. Jelen. 2005. The Composition of Jerusalem Artichoke (Helianthus tuberosus L.) Spirits Obtained from Fermentation with Bacteria and Yeast. Eng. Life Science.Vol(5). No(1). Taherzadeh, M.J. dan K. Karimi. 2007. Enzyme-Based Hydrolysis Processes for Ethanol from Lignocellulosic Material.a Review. [Online]. Tersedia: http://www.ncsu.edu /bioresources/BioRes_02/BioRes (Diakses pada: 25/01/2015).
308