Original paper/Artykuł oryginalny
Reumatologia 2014; 52, 6: 369–376 DOI: 10.5114/reum.2014.47230
Serum IgG galactosylation in psoriatic arthritis patients undergoing a biological treatment. A preliminary report Galaktozylacja surowiczej IgG u pacjentów z łuszczycowym zapaleniem stawów, leczonych biologicznie. Doniesienie wstępne Anna Jakubiak-Augustyn1, Renata Sokolik2, Maria Duk1, Jacek Szechiński2, Piotr Wiland2, Elwira Lisowska1, Maciej Sobczyński3, Hubert Krotkiewski1 1
Ludwik Hirszfeld Institute of Immunology & Experimental Therapy, Wroclaw Department of Rheumatology, Wroclaw Medical University, Wroclaw 3 Department of Genomics, University of Wrocław, Wroclaw 2
Key words: psoriatic arthritis, immunoglobulin G, IgG galactosylation, N-glycans. Słowa kluczowe: łuszczycowe zapalenie stawów, immunoglobulina G, galaktozylacja IgG, N-glikany.
Summary
Streszczenie
Aim of the study: A group of psoriatic arthritis patients (PSA, 11 cases) has undergone a treatment. For each patient two serum samples were collected: before the treatment (sample before) and after the treatment (sample after). Performed investigation aimed to provide an information whether a treatment of the PSA patients improves the galactosylation of IgG N-glycans, which previously was shown for rheumatoid arthritis (RA) patients. Material and methods: Immunoglobulin G (IgG) was isolated from serum of PSA patients, before and after the treatment, using affinity chromatography on Protein A-Sepharose, and was further analyzed regarding the galactose content, using gas chromatography-mass spectrometry (GC-MS) method and ELISA test, performed with two lectins: Ricinus communis (RCA-I) and Griffonia simplicifolia (GSL-II). Based on ELISA results an agalactosylation factor (AF) was calculated for each before and after IgG sample. Results: Obtained data regarded galactose content in IgG, AF calculation and estimation of two laboratory indices of inflammation: erythrocyte sedimentation rate (ESR) and C-reactive protein (CRP) concentration in serum. Based on statistical methods it was shown that average difference (d) of after and before measures of AF for PSA patients was MedHL = –0.097 (95% CI: –0.49–0.25), which means that applied treatment did not affect AF value for this group of patients in a statistically significant manner (p = 0.2936). Conclusions: The study demonstrated that, in the contrary to RA patients, IgG galactosylation in PSA patients, undergoing a treatment, showed no statistically significant changes.
Cel pracy: Grupa pacjentów z łuszczycowym zapaleniem stawów (ŁZS, 11 osób) została poddana leczeniu. Od każdego pacjenta pobrano dwie próbki surowicy: przed leczeniem (próbka before) i po zakończeniu leczenia (próbka after). Wykonane badanie miało na celu uzyskanie informacji, czy leczenie pacjentów z ŁZS poprawia galaktozylację N-glikanów w IgG, co zostało uprzednio wykazane dla pacjentów z reumatoidalnym zapaleniem stawów (RZS). Materiał i metody: Immunoglobulinę G (IgG) izolowano z surowicy pacjentów z ŁZS, przed i po leczeniu, stosując chromatografię powinowactwa na kolumnie białko A-sefaroza. Następnie analizowano w niej zawartość galaktozy, stosując metodę chromatografii gazowej (GC-MS) oraz test ELISA z użyciem dwóch lektyn: Ricinus communis (RCA-I) i Griffonia simplicifolia (GSL-II). Na podstawie wyników testu ELISA dla każdej analizowanej próbki IgG obliczono współczynnik agalaktozylacji (AF). Wyniki: Uzyskane wyniki dotyczyły zawartości galaktozy w próbkach IgG, obliczenia współczynnika AF oraz oznaczenia dwóch parametrów laboratoryjnych: odczynu Biernackiego (OB) oraz stężenia białka C-reaktywnego (CRP) w surowicy. Na podstawie metod statystycznych wykazano, że średnia różnica (d) wartości współczynnika AF próbek IgG before i after dla pacjentów z ŁZS wyniosła MedHL = –0.097 (CI95%, –0,49–0,25), co oznacza, że zastosowane leczenie nie wpłynęło na wartość współczynnika AF w tej grupie pacjentów w sposób znamienny statystycznie (p = 0,2936). Wnioski: Badania wykazały, że w przeciwieństwie do pacjentów z RZS, galaktozylacja IgG u pacjentów z ŁZS, poddanych leczeniu, nie wykazała zmian statystycznie znamiennych.
Address for correspondence: Prof. Hubert Krotkiewski, PhD, Ludwik Hirszfeld Institute of Immunology & Experimental Therapy, Weigla 12, 53-114 Wrocław, e-mail:
[email protected] Submitted: 11.06.2014
Reumatologia 2014; 52/6
370
Introduction In the clinical settings the prerequisite condition towards an effective treatment of a patient is a proper diagnosis; in order to correctly diagnose a patient an estimation of a specific biological marker is usually very helpful. This biological marker (biomarker) is a molecule, or a fragment of the molecule, which amount raises over a background quantities, typical for the healthy individuals and enhances its quantity together with a progression of a disease [1]. On the other hand, the biomarker, during effective clinical treatment of a patient, lowers its quantity indicating a positive effect of the treatment. Serum immunoglobulin G (IgG) was recognized in 1985 as a biological marker in rheumatoid arthritis [2], i.e. the conservative N-glycans in IgG molecule, present in CH2 domain of Fc fragment in both heavy chains, exhibit decreased galactosylation. This diminished presence of galactose residues in N-glycans is proportional to the severity of the disease and was shown to be a result of a lower activity of a relevant galactosyltransferase [3]. These conservative N-glycans, present in the heavy chains of serum IgG, are biantennary-type, which means that maximum two galactoses may be present there (G(2) glycoform); accordingly G(1) and G(0) glycoforms are also present, when one galactose or two galactoses are absent, respectively. The data published so far show that the status of galactosylation of the IgG conservative N-glycans is proportional to the stage of rheumatoid arthritis (RA) in the following way: more advanced disease – less galactoses and vice versa: less advanced disease – more galactoses in IgG [4]. Recently, some additional data have appeared, regarding the decreased galactosylation of serum IgG in other diseases. Increased levels of the galactose-deficient IgG glycoforms was found in the sera of the patients infected with hepatitis C virus [5] and the studies revealed that only antibodies directed against α-Gal epitope were affected by decreased galactosylation. Anti-alpha Gal antibodies in human serum exist naturally and in healthy subjects constitute ca 1% of the total serum IgG fraction [6]. Recently, a decreased IgG galactosylation has been reported for the gastric cancer patients [7]; it was shown that diminished galactosylation of the conservative IgG N-glycans regarded antibodies against Thomsen-Friedenreich (TF) antigen and antibodies against α-Gal epitopes. For these studies the reaction of IgG with Concanavalin A (ConA) was applied [8], because experimental results, published before, showed an increased reactivity of ConA with IgG with defective galactosylation [9]. Moreover, it was shown that this increased reactivity with ConA was concomitant with the worse survival prognosis of the gastric cancer patients. To obtain more precise results the LC-ESI-MS technique
Reumatologia 2014; 52/6
Anna Jakubiak-Augustyn, Renata Sokolik, Maria Duk et al.
was applied to profile the N-glycans in the form of short glycopeptides [10]. Altogether 32 IgG-derived N-glycans were analyzed and a significant increase of agalactosylated structures was found. The aim of the present paper was to perform a statistical evaluation of the changes of two laboratory indices of inflammation [erythrocyte sedimentation rate (ESR) and C-reactive protein (CRP)] concentration in serum and two immunochemical parameters (galactose content in IgG and calculated agalactosylation factor – AF) regarding psoriatic arthritis (PSA) patients undergoing a clinical treatment. We previously found that galactosylation of IgG in rheumatoid arthritis (RA) patients improved after therapy [11]. Therefore, we performed here a statistical comparison of the results, regarding both PSA and RA groups of patients. The preliminary results concerning analysis of IgG galactosylation from the PSA patients was presented elsewhere [12].
Material and methods Patients The serum samples were derived from the group of 11 PSA patients; for each patient two blood samples were collected: one before the biological treatment (sample before) and one after the clinical treatment (sample after). The time intervals between collecting before and after SERUM samples ranged from 57 to 474 days. Patients were treated with anti-TNF-α agents – adalimumab (n = 8), disease-modifying anti-rheumatic drugs (DMARDs) – methotrexate (MTX) 17.5 mg per week (n = 3) and MTX in dose 25 mg per week (n = 6) and non-steroid anti-inflammatory drugs (NSAIDs) (n = 11). Four patients were treated with stable dose of glucocorticoids (GCS). The age of the PSA patients was between 25 and 62 years old (mean 42.5 years). For the statistical, comparison purposes the data, previously published by us for the group of 11 RA patients [11], were used. The RA patients were of the age between 26 and 65 years old (mean 45.5 years); they were treated with MTX alone or with MTX plus anti-TNF-α agent (adalimumab). The sera samples from the patients were analyzed together with the controls from healthy individuals. Sera samples of the patients, who signed a written consent, were obtained from the Rheumatology Department under the permission of the Local Commission of Bioethics (Medical University, Wroclaw, Poland).
IgG isolation Immunoglobulin G was isolated from the sera samples using an affinity column Protein A-Sepharose 6 MB (1.5 ml, Sigma, USA) as described [13]. Immunoglobulin G,
371
IgG galactosylation in psoriatic arthritis
retained on the affinity column, was eluted with 0.1 M glycine/HCl, pH 2.7; the eluate was immediately neutralized with 1 M Tris to avoid any degradation of IgG molecules. Elution profile was determined by measuring the absorbance at 280 nm. The selected fractions were analyzed for the presence and purity of IgG using SDS-PAGE [14]; the protein bands were visualized by CBB staining. The fractions containing pure IgG were pooled and concentrated using Amicon Ultra-15 centrifugal filter unit with ultracel-100 membrane (Millipore). The yield of purified IgG ranged from 5.2 to 16.5 mg/ml of the serum.
Protein determination Immunoglobulin G concentration in the solution was determined spectrophotometrically on a polystyrene 96-well plate using a bicinchoninic acid (BCA) colorimetric micromethod [15]. Briefly, to the 10 μl sample of IgG solution, diluted if necessary with water, an aliquot of 200 μl mixture solution of stock A and B solutions in the proportion 50 : 1 was added and the plate was incubated at 37ºC for 30 minutes under the cover. As a standard protein the bovine serum albumin (BSA) in the range 1–10 μg/well was used; the absorbance of the samples was read at 562 nm against the blank.
Gas chromatography-mass spectrometry Gas chromatography-mass spectrometry (GC-MS) method was used to determine the monosaccharide composition of the N-linked glycans in IgG. The samples of purified IgG (0.3 mg protein, determined by BCA method) were hydrolyzed in 4 M trifluoroacetic acid (TFA) at 100ºC for 4 h; xylose was added as an internal standard after hydrolysis. The monosaccharides were converted into alditol acetates after reduction with sodium borohydride and peracetylation, as described [16]. Analysis was performed in the gas chromatograph ThermoScientific Focus GC, equipped with a mass detector ITQ 700 and a column Rxi-5 ms (30 m × 0.25 mm); temperature program 150–280ºC with a gradient 8ºC/min was used. The sugar peaks were identified based on retention times and mass spectra of the standards, quantification of the peaks was based on the total ion current (TIC).
ELISA test The ELISA test was used to determine the galactosylation status of serum IgG from the patients and healthy controls, as described previously [11]. As the specific reagents, recognizing the carbohydrate structures, two biotinylated lectins were used: Ricinus communis (RCA-I), which recognizes terminal galactose residues and Griffonia simplicifolia (GSL-II), which recognizes the terminal GlcNAc residues. The lectins were biotinylated
with a specific reagent (biotinamidocaproate N-hydro xysuccinimide ester), according to the described procedure [17]. The IgG samples were analyzed in triplicates and three separate IgG samples from the healthy individuals served as the control samples. To perform the ELISA test based on the same amount of analyzed immunoglobulin, IgG samples from the patients and the controls were coated on the plate (0.5 μg/well). The uniformity of coating in individual wells was controlled using an anti-human IgG HRP-conjugated goat antibody in a separate ELISA experiment. Before performing the reaction with the lectins the IgG aliquots, coated in the wells, were reduced by incubation with dithiotreitol (2 mg/ml) in 0.1 M Tris-HCl, pH 8.0 at 37°C for 70 min. The relative binding of two lectins: RCA-I and GSL-II to the IgG samples, coated in the wells, was expressed in a proportion to the binding of these lectins to the control sample, which was set to 1.0. The ratio of the relative GSL-II/RCA-I binding was termed as agalactosylation factor (AF) [11] and was determined for each analyzed IgG sample.
C-reactive protein determination C-reactive protein concentration in the sera samples was determined using a routine method and the results were expressed in mg/dl; the physiological range is 1–5 mg/dl.
Statistical analysis For AF, CRP concentration in serum, erythrocyte sedimentation rate (ESR) and the content of galactose in the N-glycans, calculated in moles per 3 moles of mannose, differences d between measures after and before treatment of the patients were computed as d = after – before. Hodges-Lehman estimator (pseudo-median MedHL) was used as estimator of location parameter.statistic, defined via the equation: Sn = med {med|xi – xj|; j = 1...n}, was computed as the measure of variability [18] can be seen as an average distance between two measurements among group. Studentized 95% confidence intervals (CI95%) were estimated with smoothed bootstrap approach. Correlation coefficient between differences d and age of patients was tested with permutation method. P-values were computed exactly by Monte Carlo simulations.
Results Two laboratory indices of inflammation were determined for the group of PSA patients: ESR and CRP concentration in serum; both parameters were determined before and after treatment of the patients. An average level of ESR for PSA patients was MedHL = 12 (CI95%:
Reumatologia 2014; 52/6
372
Anna Jakubiak-Augustyn, Renata Sokolik, Maria Duk et al.
5.5–28) for the samples before and MedHL = 7.4 (CI95%: 6–12) for the samples after the treatment. Average distance of ESR values between two patients (i.e. variability) was Sn = 7 for the samples before and Sn = 4 for the samples after the treatment. Average difference d between the after and before measurements was MedHL = –3.0 (CI95%: –4.87–1.27) with variability Sn = 3. There was no proof found that ESR values, determined after the treatment, represented significant differences in comparison with ESR values, determined before the treatment for PSA patients (p = 0.1891). Analogously, for the group of RA patients [11] the corresponding statistical results were as follows: MedHL = 51.7 (CI95%: 20.3–94.6) for the samples before and MedHL = 27.3 (CI95%: 14.5–48.5) for the samples after the treatment. Average distance of ESR values between two patients (i.e. variability) was Sn = 34.5 for the samples before and Sn = 15 for the samples after the treatment. Average dif-
ference d between the after and before measurements was MedHL = –19.8 (CI95%: –49.9–8.2) with variability Sn = 31. Similarly to the statistical results calculated for PSA patients there was no proof for the RA patients that ESR values, determined after the treatment, represented significant differences in comparison with ESR values, determined before the treatment (p = 0.2052). All statistics and comparisons of ESR and CRP measurements, for PSA and RA patients, are presented in Table I. It can be seen that, from the statistical point of view, there are no proofs (p > 0.14) that the applied treatment of both groups of patients introduced significant differences of the level of ESR and CRP concentration in serum. Galactose content in IgG samples was determined using GC-MS method after hydrolysis of individual IgG aliquots, each containing 0.3 mg protein; results are expressed in moles of galactose per 3 moles of mannose. This determination was performed for IgG samples, iso-
Table I. Comparison of clinical parameters: erythrocyte sedimentation factor (ESR) and concentration of C-reactive protein (CRP) in serum, together with galactose content in IgG and agalactosylation factor (AF), determined for IgG samples from the patients with rheumatoid arthritis (RA) and psoriatic arthritis (PSA) ESR
CRP [mg/dl]
moles Gal/3 moles Man
AF
MedHL Sn CI95%
MedHL Sn CI95%
MedHL Sn CI95%
MedHL Sn CI95%
Rheumatoid arthritis (RA) n = 11 before
51.7 34.5 20.3–94.6
4.43 3.6 0.58–11.2
1.09 0.16 0.9–1.26
2.54 1.39 1.13–5.67
after
27.3 15 14.5–48.5
1.54 1.25 0.33–4.19
1.17 0.11 1.04–1.29
1.66 0.59 1.18–2.68
difference
–19.8 31 –49.9–8.2
–2.57 3.6 –7.1–0.96
0.12 0.18 –0.06–0.31
–1.9 2 –3.61–0.15
p = 0.2052
p = 0.1431
p = 0.1812
p = 0.0161
Psoriatic arthritis (PSA) n = 11 before
12 7 5.5–28
2.56 1.49 0.53–7
1.55 0.25 1.18–1.95
1.57 0.876 0.97–3.08
7.4 4 6–12
1.91 1.65 0.31–10.9
1.39 0.41 0.99–1.78
1.423 0.763 0.87–3.49
–3 3 –4.87–.27
–0.75 0.66 –2.41–0.92
0.082 0.2 –0.12–0.32
–0.097 0.42 –0.49–0.25
p = 0.1891
p = 0.1742
p = 0.4164
p = 0.2936
after
difference
MedHL – location parameter (pseudo-median) Sn – average dispersion CI95% – confidence interval at significance level α = 0.05 CRP physiological range 1–5 mg/dl
Reumatologia 2014; 52/6
373
IgG galactosylation in psoriatic arthritis
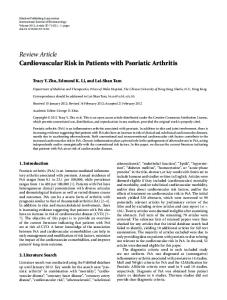
lated in this investigation from the sera of PSA patients and was analogously performed in the previously published paper on the IgG samples, derived from RA patients [11]. Two IgG samples were analyzed for each patient: a sample before and a sample after the treatment. The statistical data based on these determinations is presented in Table I. The data indicate that there are no statistical proofs that the treatment of the patients influences average level of galactose content in IgG, both for PSA and RA patients, although in the case of RA patients the galactose content difference, as measured for the IgG samples after and before the treatment, is clearly bigger as compared with PSA patients. Briefly, an average difference d between galactose content in IgG samples isolated after and before the treatment for the patients in RA group was estimated MedHL = 0.12 (CI95%: –0.06–0.31; p = 0.1812), whereas for the patients in PSA group it was estimated MedHL = 0.082 (CI95%: –0.12–0.32; p = 0.4164). It is clearly seen from the diagram in the Fig. 1, which presents the differences d between Gal content in IgG samples after and before the treatment, both for the PSA and RA patients. In our previously published paper [11] we introduced a numerary parameter (AF), which enables to estimate, by comparing the different IgG samples from the patients, agalactosylation status of the IgG N-glycans. Agalactosylation factor is a relative value and may be
a
used as a measure of both: the severity of disease (the before IgG samples) and the biochemical effect (galactosylation of the IgG N-glycans) of a clinical treatment of a patient (the after IgG samples). Agalactosylation factor was previously determined for IgG samples, isolated from the sera of patients with RA [11] and, in the present investigation, for the IgG samples from psoriatic arthritis patients. Agalactosylation factor calculation is based on the results of ELISA test, performed with IgG samples reacting with two lectins in two independent experiments: RCA-I (Ricinus communis) lectin and GSL-II (Griffonia simplicifolia) lectin. Binding of these two lectins to two IgG samples from one patient (samples before and after) is reciprocal, because RCA-I recognizes terminal Gal residues in the N-glycans, whereas GSL-II recognizes the terminal GlcNAc residues, which are generated as a result of galactose residues absence in the N-glycans. The galactose deficiency in IgG N-glycans is known to be proportional to disease severity in RA [2, 4, 19], as well as in other rheumatic diseases [20]. In the present investigation we intended to get insight into the problem of IgG galactosylation in the PSA patients undergoing a clinical treatment. The statistics of AF values, both for PSA and RA patients, is shown in Table I. In the group of PSA patients the average level of AF was MedHL = 1.57 (CI95%: 0.97–3.08) for IgG samples before the treatment and MedHL = 1.423 (CI95%: 0.87–3.49) for
b
0
–0.5
0.5
GalAfter–GalBefore
GalAfter–GalBefore
0.5
0
–0.5
Fig. 1a, b. Differences between galactose content in IgG, expressed in moles Gal per 3 moles Man, determined for IgG samples after and before treatment of the patients; the measure was estimated separately for the patients with rheumatoid arthritis (a) and psoriatic arthritis (b).
Reumatologia 2014; 52/6
374
Anna Jakubiak-Augustyn, Renata Sokolik, Maria Duk et al.
IgG samples after the treatment. An average difference (d) between after and before measures of AF for PSA patients was MedHL = –0.097 (CI95%: –0.49–0.25), which means that there is no proof that the applied treatment clearly affected the average level of AF in this group of patients (p = 0.2936, Table I). Moreover, there was no significant correlation between AF differences d and age of the patients studied (not shown). For the group of RA patients the average level of AF was MedHL = 2.54 (CI95%: 1.13–5.67) for the IgG samples before and MedHL = 1.66 (CI95%: 1.18–2.68) for the IgG samples taken after the treatment of the patients. An average difference d between after and before measurements was MedHL = –1.9 (CI95%: –3.61–0.15) with variability Sn = 2, and it could be observed that AF values for IgG samples after the treatment were significantly smaller than those calculated for the IgG samples from the RA patients before the treatment (p = 0.0161), which means these differences are statistically significant. We present also the diagram showing the differences d between AF values, estimated for IgG samples after and before the treatment, both for the patients with PSA and RA (Fig. 2).
Discussion Much clinical data, available until now, indicate that serum IgG is a characteristic biomarker in RA patients, be-
b 2
2
0
0
–2
AFAfter–AFBefore
AFAfter–AFBefore
a
cause its carbohydrate moiety changes in a characteristic way in this disease [e.g. 2, 4, 19]; much less data is available on the sugar moiety of serum IgG from PSA patients. In the present paper we analyzed IgG samples from PSA patients in order to establish, if in this disease diminished galactosylation of IgG N-glycans improves as a result of treatment of a patient. Based on our previous study on the outcome of a treatment of the RA patients [11], we decided to statistically compare the results obtained for both groups of the patients: PSA and RA patients. We focused on a statistical evaluation of the observed changes, which regarded two laboratory indices of inflammation: ESR and concentration of CRP in serum, together with two immunochemical parameters: galactose content in IgG and calculated AF, respectively. To estimate the effect of the clinical treatment in these two diseases: PSA and RA, two samples of serum IgG from each individual patient were collected and analyzed: the first serum sample (sample before) was taken from a patient before starting the treatment and the second serum sample (sample after) was taken when the treatment was finished. As can be seen from Table I and Fig. 2 the RA patients showed, as a result of their treatment, a partial, recognizable reconstitution of galactosylation of their IgG N-glycans, which is strongly pronounced by 1° the change of the mean value of AF (d = –1.9), which is statistically significant (p = = 0.0161) and weakly pronounced by 2° the change of the
–2
–4
–4
–6
–6
Fig. 2a, b. Differences between agalactosylation factor (AF) values, calculated for IgG samples after and before treatment of the patients; the measure was estimated separately for the patients with rheumatoid arthritis (A) and psoriatic arthritis (B).
Reumatologia 2014; 52/6
375
IgG galactosylation in psoriatic arthritis
total galactose content in IgG samples (d = 0.12). Accordingly, the PSA patients showed, on average, a very weakly pronounced reconstitution of serum IgG galactosylation: the change of agalactosylation factor was as low as d = –0.097 (statistically not significant, p = 0.2936) and the change of galactose content in IgG was d = 0.082 (statistically also not significant, p = 0.4164). Although the number of the patients in both groups is not numerous, we decided to present obtained results as a preliminary report, which shows a statistical comparison of the outcome of the treatment, applied for the mentioned two groups of patients: PSA and RA patients. Concerning the galactosylation of IgG molecules from the serum it also should be kept in mind that, despite the conservative N-glycans in CH2 region of both heavy chains, there are also some N-glycans present in Fab fragment of the IgG molecule [21]. These oligosaccharides are mostly sialylated, therefore, their contribution to the IgG agalactosylation status in rheumatological diseases, seems to be negligible. It was shown that, on average, in the human IgG molecule the number of N-linked glycans present in Fab fragment is approximately 0.4 [22]. In the previously published paper [11] we presented the data obtained for RA patients, treated with MTX alone or with MTX plus anti-TNF-α agent (adalimumab). From the analyses described there, which included GCMS determination of galactose content in IgG samples, ELISA test with two lectins (RCA-I and GSL-II) and SPR analysis in a biosensor BIAcore, performed with the same two lectins, it was shown that in most cases galactosylation of IgG, isolated from sera of the RA patients, improved after the applied treatment. Our observations were confirmed by Croce et al. [23] on a group of RA patients treated with infliximab. The authors of this paper claimed that the applied treatment reduced the concentration of G(0) subfraction of N-glycans in serum IgG of the patients with active RA, which means that galactosylation of these N-glycans increased. The data obtained in the present investigation show that in the psoriatic arthritis patients the N-glycans in IgG molecules are partially agalactosylated, like in RA patients, but the reconstitution of galactosylation of these N-glycans is not significant during the clinical treatment, as revealed by statistical evaluation. This is in contrary to the results obtained for IgG samples from the patients with RA under the treatment, where a marked increase of galactosylation of N-glycans in IgG was noticed [11]. The early histopathological symptoms in RA and PSA are almost undistinguishable, therefore, it would be of interest to investigate in the future if the lack of reconstitution of IgG galactosylation, in the case of PSA patients undergoing a treatment, may be due to the less pro-
nounced inflammation, characteristic for this disease in comparison with RA. The treatment of PSA patients was recently mentioned in the literature [24, 25], which indicates this clinical subject starts to be more popular as a goal in the medical investigations.
The authors declare no conflict of interest. The research was carried out thanks to a statutory grant of the Ludwik Hirszfeld Institute of Immunology and Experimental Therapy, Polish Academy of Sciences in Wrocław. References 1. Hagen TJ. Recent trends in biomarker research and development. Biochem Anal Biochem 2012; 1: 1-4. 2. Parekh RB, Dwek RA, Sutton BJ, et al. Association of rheumatoid arthritis and primary osteoarthritis with changes in the glycosylation pattern of total serum IgG. Nature 1985; 316: 452-457. 3. Furukawa K, Matsuta K, Takeuchi F, et al. Kinetic study of a galactosyltransferase in the B cells of patients with rheumatoid arthritis. Int Immunol 1990; 2: 105-112. 4. Gindzienska-Sieskiewicz E, Klimiuk PA, Kisiel DG, et al. The changes in monosaccharide composition of immunoglobulin G in the course of rheumatoid arthritis. Clin Rheumatol 2007; 26: 685-690. 5. Mehta AS, Long RE, Comunale MA, et al. Increased levels of galactose-deficient anti-Gal immunoglobulin G in the sera of hepatitis C virus-infected individuals with fibrosis and cirrhosis. J Virol 2008; 82: 1259-1270. 6. Galili U, Anaraki F, Thall A, et al. One percent of human circulating B lymphocytes are capable of producing the natural anti-Gal antibody. Blood 1993; 82: 2485-2493. 7. Kodar K, Kurtenkov O, Klaamas K. The Thomsen-Friedenreich antigen and αGal-specific human IgG glycoforms: Concanavalin A reactivity and relation to survival of cancer patients. Immunol Invest 2009; 38: 704-717. 8. Baenziger JU, Fiete D. Structural determinations of Concanavalin A specificity for oligosaccharides. J Biol Chem 1979; 254: 2400-2407. 9. Klaamas K, Kodar K, Kurtenkov O. An increased level of the Concanavalin A – positive IgG in the serum of patients with gastric cancer as evaluated by a lectin enzyme-linked immunosorbent assay (LELISA). Neoplasma 2008; 55: 143-150. 10. Kodar K, Stadlmann J, Klaamas K, et al. Immunoglobulin G Fc N-glycan profiling in patients with gastric cancer by LC-ESIMS: relation to tumor progression and survival. Glycoconj J 2012; 29: 57-66. 11. Pasek M, Duk M, Podbielska M, et al. Galactosylation of IgG from rheumatoid arthritis (RA) patients – changes during therapy. Glycoconj J 2006; 23: 463-471. 12. Duk M, Jakubiak-Augustyn A, Sokolik R, et al. Effect of Adalimumab treatment of psoriatic arthritis patients (PSA) on galactosylation of serum IgG. A preliminary report. EULAR Meeting 2012; Berlin, 6-9 June, abstract AB 0945.
Reumatologia 2014; 52/6
376
13. Ey PL, Prowse SJ, Jenkin CR. Isolation of pure IgG1, IgG2a and IgG2b immunoglobulins from mouse serum using protein A-Sepharose. Immunochemistry 1978; 15: 429-436. 14. Laemmli UK. Cleavage of structural proteins during the assembly of the head of bacteriophage T4. Nature 1970; 227: 680-685. 15. Smith PK, Krohn RI, Hermanson GT, et al. Measurement of protein using bicinchoninic acid. Anal Biochem 1985; 150: 76-85. 16. Sawardeker JS, Sloneker JH, Jeanes A. Quantitative determination of monosaccharides as their alditol acetates by liquid chromatography. Anal Chem 1965; 37: 1602-1604. 17. Lisowska E, Duk M, Wu AM. Preparation of biotinylated lectins and application in microtiter plate assays and western blotting. Bio Methods 1996; 7: 115-129. 18. Rousseeuw PJ, Croux C. Alternatives to the median absolute deviation. JASA 1993; 88: 1273-1283. 19. Endo T, Furukawa K. Rheumatoid arthritis and serum IgG. In: Glycoproteins and disease. Montreuil J, Fliegenthart JFG, Schachter H (eds.). 1996; 277-289. 20. Watson M, Rudd PM, Bland M, et al. Sugar printing rheumatic diseases: a potential method for disease differentiation using immunoglobulin G oligosaccharides. Arthritis Rheum 1999; 42: 1682-1690. 21. Youings A, Chang SC, Dwek RA, Scragg IG. Site-specific glycosylation of human immunoglobulin G is altered in four rheumatoid arthritis patients. Biochem J 1996; 314: 621-630. 22. Wormald MR, Rudd PM, Harvey DJ, et al. Variations in oligosaccharide-protein interactions in immunoglobulin G determine the site-specific glycosylation profiles and modulate the dynamic motion of the Fc oligosaccharides. Biochemistry 1997; 36: 1370-1380. 23. Croce A, Firuzi O, Altieri F, et al. Effect of Infliximab on the glycosylation of IgG of patients with rheumatoid arthritis. J Clin Lab Anal 2007; 21: 303-314. 24. Targońska-Stępniak B, Majdan M, Seweryn R, Kiełbik Z. Adalimumab treatment in patients with rheumatoid arthritis, ankylosing spondylitis and psoriatic arthritis in therapeutic programmes – personal experience. Reumatologia 2013; 51: 9-14. 25. Majdan M, Siwiec A, Gryta A. Certolizumab pegol – new option in the treatment psoriatic arthritis. Reumatologia 2014; 52: 181-188.
Reumatologia 2014; 52/6
Anna Jakubiak-Augustyn, Renata Sokolik, Maria Duk et al.