Portland Cement Association
RADIANT HEAT WITH CONCRETE by Ingrid Mattsson and Gary Fries* Volume 18/Number 1 April 1997 5420 Old Orchard Road Skokie, Illinois 60077-1083 Phone: (847) 966-6200 Fax: (847) 966-8389 Web Site: www.portcement.org
Contents Radiant Heat with Concrete
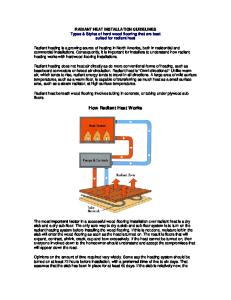
Efficiency often drives the evolution of our market places. Think back to the cars driven 20 years ago compared to those of today. Back then, bigger was better, and gas guzzling was not a concern. As fuel became more expensive and even scarce during certain periods, the auto industry was forced to create cars that were smaller and more efficient. A similar evolution is occurring in the heating industry. As a result, the efficiency of the residential furnace has risen dramatically over the last 15 years. As fuel costs continue to climb, the effectiveness of our heating systems must continue to improve. One of the new stars on the heating market is radiant floor heating (see Fig. 1). Although North Americans are just starting to realize its benefits, radiant floor heating has been used
successfully in Europe for over 50 years. The concept is simple: warm water circulates through tubing that is buried in the floor, keeping the heat where it is needed most. Building occupants are then comfortable at a lower thermostat setting (see Fig. 2), leading to a reduction in fuel costs of up to 40% (see first reference). Comfort and efficiency are two reasons North Americans are turning to radiant heat. More conventional forms of heating address the heat loss of the structure, while radiant floor systems address the heat loss of the human body. Radiant floors take advantage of concrete’s thermal mass: they absorb and store heat, then conduct it directly to the feet and to objects in the room that in turn re-radiate heat. Radiant heat warms objects, not just the air. Air quality is improved since there is no
Fig. 1. Radiant heating is hidden within the floor, where it provides exceptional heating without the clutter of radiators or the drafts of forced air.
*Marketing Coordinator, Heating Division Wirsbo Company, and Regional Sales Manager, Wirsbo Company, 5925 149th Street West, Apple Valley, Minnesota 55124, (800) 321-4739.
Controlling ASR Laboratory Notes: Thermal Analysis by TGA, DTA and DSC New Literature
R e t u r n To I n d e x
Concrete Technology Today hot air blowing dust and allergens throughout the building. Also, less air escapes each time windows or doors are opened. A distinct advantage for both comfort and efficiency of radiant floor heating is the ability to zone the heat, placing it exactly where it is wanted and needed. Since the flexibility of these systems is increased due to zoning, they are especially well suited to retrofit or remodeling construction.
in the U.S. as the material of choice for these applications. Just as not all metals are alike, not all forms of PEX are alike. Different manufacturing processes produce different products with varying degrees of quality. When specifying PEX products, engineers should check on the quality of the manufacturer and manufacturing process, history of producing PEX and type of PEX product. The specified material should conform to the applicable ASTM and other consensus standards (see references).
ment (see Fig. 3). In commercial applications, tubing is often placed 300 mm (12 in.) on center. PEX tubing for radiant heating has an outside diameter of 13 to 19 mm (1/2 to 3/4 in.).
Tubing Although steel, copper, and rubber have been used as tubing in radiant floor heating systems, one material is most compatible with concrete in the slab: cross-linked polyethylene or PEX. Unlike other plastic and metal tubing materials, PEX tubing cast in concrete is capable of lasting the life of the structure. PEX tubing was introduced in Europe in the 1960s and offers properties not available with other plastics. PEX is extremely durable due to the strengthened molecular structure it acquires during cross-linking. Because of its flexible nature, it can be installed quickly and easily, and its creep-resistance reduces friction levels and the stress of linear expansion when embedded in concrete. PEX tubing was first introduced in America in the early 1980s. Ideally suited to radiant floor heating and plumbing, PEX is gaining popularity Ceiling Radiant Heating Curve Ideal Heating Curve
60°
70°
Forced Air Heating Curve
80° 90° 100°F
Floor
Fig. 2. Heat profiles from floor to ceiling show how radiant heat provides close to the ideal temperature, whereas conventional heating deviates from the ideal.
A Large Radiator Engineers are discovering that concrete supplies a perfect complement to the benefits of radiant floor heating. Slabon-grade applications provide an easy method of tube installation and concrete slabs are uniquely capable of recovering the thermostat setting after an influx of cold air. Open doors, large windows and even high air changes will not affect the building’s temperature as much as with a forced air heating system. The heat is retained in the concrete, so the room stays warmer longer without extreme temperature fluctuations. This makes radiant floor heating in concrete slabs ideal for both commercial and residential applications. With the recommended high density insulation placed below the slab, the floor becomes a large, mild radiator.
Design and Construction The key to designing a radiant floor system for a concrete slab is accurate heat loss calculations. The concrete slab acts as a giant radiator to heat the building, so it is important to reduce heat losses by using insulation. Most radiant floor heating manufacturers have computer programs that calculate the heat loss of particular concrete slabs. These programs are very thorough: they take into account everything from water table temperatures to slab depth to floor cover R-values to determine heat loss. Once the design is complete, installation of a radiant floor system in a concrete slab is simple. Typically, the PEX tubing is either stapled to the insulation or tied to the wire mesh or rebar. The tubing is fastened to the substrate or reinforcement to hold it in its layout configuration and prevent it from floating to the surface during concrete place-
2
R e t u r n To I n d e x
Fig. 3. Concrete is placed over tubing for a radiant floor. PEX tubing is extremely durable and capable of handling the majority of activity on the job site. Normal care will provide adequate protection. If concrete buggies or pumping lines are being moved across the tubing, planking laid over key areas will protect the tubing. This will also protect the tubing layout pattern from being disturbed and causing delays during the concrete placement. PEX tubing should have a minimum of 50 mm (2 in.) of concrete over the top of the tubing. Refer to the appropriate building codes for additional requirements.
Long-Term Performance The benefits of radiant floor heating are well-documented and easily recognizable in the residential marketplace both in new construction and retrofit applications. As the radiant industry grows, it continues to expand into the commercial arena where its advantages in efficiency are quickly evident, particularly when heating spaces with large cubic volumes of air. Radiant floor heat in concrete makes sense. Numerous applications over many years have shown that PEX tubing does not degrade when embedded in concrete, eliminating concerns about long-term durability. Well known for the superior comfort and efficiency it delivers, radiant floor
April 1997 heating increases the value of any structure in which it is placed. If you’re placing a concrete floor, consider installing PEX tubing, because it can always be hooked up at a later date. Radiant heating can also be added to existing floors by embedding the tubing in a floor topping. See PCA's Resurfacing Concrete Floors (IS144) for information on overlaying concrete floors. Two interesting case studies that follow illustrate the uses and benefits of radiant heat for both interior and exterior use.
The Casper, Wyoming, Service Center Warehouse The city of Casper, Wyoming, saw firsthand the difference radiant floor heating made for comfort and energy efficiency. The city moved a maintenance and storage facility for utility equipment from the old 2300 m2 (25,000 sq ft) site to a new 6500 m2 (70,000 sq ft) building in 1987. The older building had 7.6 m (25 ft) ceilings and was heated with forced air while the new building has 12.2 m (40 ft) ceilings and is heated with a radiant floor in the concrete slab. The chart below shows the seasonal averages of energy consumption for the two buildings. The data for the old building was collected from December 1983 through February 1987. The data for the new building was collected from August 1987 through February 1991. Despite the fact that the floor space nearly tripled and the ceiling height almost doubled, the fuel consumption only doubled. Radiant floor heating makes the best use of the large slab Annual Usage Old New Change, % Total CCFgas 26,340.000 57,684.000 +119 1.050 0.820 -22 CCFgas/SFspace 0.042 0.021 -51 CCFgas/CFspace $0.016 $0.008 -51 $/CFspace Total Cost $10,273.00 $22,497.00 +119
area used in warehouse-type structures. Comfort levels also remain consistent as large volumes of warmed air are not escaping to the outside each time loading dock doors are opened. Since radiant heat primarily warms objects, not air, the recovery time is fast when the doors close.
The Holland, Michigan Snow & Ice Melt Project Flexibility refers not only to the prop-
Fig. 4. Clear streets and sidewalks are safer for walking and driving and attract business to the area. erty of the tubing but also to the many applications of radiant slab heating. Its efficiency and comfort extend to another area—snow and ice melting. In the summer of 1988, the city of Holland, Michigan began planning a renovation project for their downtown area. The intent of the city fathers and local businesses was to beautify the downtown area with pavers, planters, and other landscaping to add to the area’s historic features. The problem was that Holland receives between 2.0 and 2.5 m (75 and 100 in.) of snow each winter. In a relatively short period of time, the new improvements might look old and beaten from the salt and snow removal equipment. The local electric power utility was also faced with the task of reducing their water temperature prior to releasing the water back into the river. Working together, the two parties found a mutually beneficial solution. Today, five city blocks of street, adjacent sidewalks, and two parking lots are free of ice and snow all winter (see Fig. 4). The system operates with water at a temperature of 26°C to 32°C (80°F to 90°F). The water is heated through an exchanger from the power plant. The water is then cooled as it circulates through the streets, returning back to the river at about 13°C (55°F). In essence, the city gets free heat and the streets have become the cooling tower for the power plant. This has proven to be an economic boon for the area. People can park and walk without slipping or having to climb over mounds of piled snow. Locals bring visiting friends and relatives downtown to see the system.
Much of their time is spent walking the city streets, shopping and stopping for a bite to eat. Because the system is under constant circulation, the streets and sidewalks remain clear and never experience the stresses caused by freeze-thaw cycles. This, and the elimination of snow removal equipment and deicing chemicals, contributes to reduced maintenance costs and a longer pavement life.
References A Comparative Energy Efficiency Analysis of Wirsbo Hydronic Floor Radiant Heating Systems: Final Report, Londe-Parker, Inc., (Ballwin, Missouri), September 1991. ASTM F 876, Specification for Crosslinked Polyethylene (PEX) Tubing ASTM F 877, Specification for Crosslinked Polyethylene (PEX) Plastic Hot- and Cold-Water Distribution Systems CAN/CSA Standard B137.5M-96, Standard for PEX Tubing ANSI/NSF Certification 14 (Ingredients, materials, products, quality assurance, and marking for thermoplastic and thermoset piping systems) ANSI/NSF Certification 61 (Toxicity for plumbing materials) ICBO Evaluation Report No. 4407 (Piping with oxygen diffusion barrier) ICBO Evaluation Report No. 5142 (Piping with no oxygen diffusion barrier)
• • •
• • • • • • •
Partial list of items to consider when specifying and constructing radiant heated concrete floors: Perform heat loss calculations Specify minimum length of tubing per square floor area Plan spacing (typically 300 mm or 12 in.) and layout of tubing (zig-zag, looped, or other configuration) Use extruded polystyrene for subfloor insulation, specify minimum thickness Staple tubing to subfloor/insulation or tie to wire mesh or steel reinforcement Prevent crushing of tubing Maintain minimum 50-mm (2-in.) cover over tubing Use a conventional concrete mix, 20 MPa (3000 psi) minimum Specify ASTM F 876 and F 877 Consult local building code
3
R e t u r n To I n d e x
Concrete Technology Today
Controlling ASR Aggregates containing certain constituents can react with alkali hydroxides in concrete. The reactivity is potentially harmful only when it produces significant expansion. Alkaliaggregate reactivity (AAR) has two forms—alkali-silica reaction (ASR) and alkali-carbonate reaction (ACR). ASR is much more common than ACR and is the focus of this article. Even though potentially reactive aggregates exist throughout North America, ASR distress in structural concrete is not common. There are a number of reasons for this: • Most aggregates are chemically stable in hydraulic-cement concrete. • Aggregates with good service records are abundant in many areas. • The concrete in service is dry enough to control ASR. • The use of certain pozzolans or slags controls ASR. • In many concrete mixtures, the alkali content of the concrete is low enough to control harmful ASR. • Some forms of ASR do not produce significant deleterious expansion.
Visual Symptoms of Expansive ASR Typical indicators of ASR presence might be a network of cracks, closed or spalled joints, or relative displacements of different portions of a structure (see Fig. 1). Because ASR deterioration is slow, the risk of catastrophic failure is low. ASR can cause service-
ability problems and can exacerbate other deterioration mechanisms such as those that occur in frost, deicer, or sulfate exposures.
Mechanism of ASR The alkali-silica reaction forms a gel that swells as it draws water from the surrounding cement paste. Reaction products from ASR have a great affinity for moisture. In absorbing water, these gels can induce pressure, expansion, and cracking of the aggregate and surrounding paste. The reaction can be visualized as a two-step process: 1. Alkali + reactive silica➝gel reaction product (alkali-silica gel) 2. Gel reaction product + moisture➝ expansion The amount of gel formed in the concrete depends on the amount and type of silica and alkali hydroxide concentration. The presence of gel doesn’t always coincide with distress, and thus, gel presence doesn’t necessarily indicate destructive ASR.
Factors Affecting ASR For alkali-silica reaction to occur, three conditions must be present: • reactive forms of silica in the aggregate, • high-alkali (pH) pore solution, • sufficient moisture. If one of these conditions is absent, ASR cannot occur.
Test Methods for Identifying ASR Distress
Fig. 1. ASR has led to damage and relative displacement of this parapet wall.
It is important to distinguish between the reaction and damage resulting from the reaction. In the diagnosis of concrete deterioration, it is most likely that a gel product will be identified. In some cases, significant amounts of gel are formed without causing damage to concrete. To pinpoint ASR as the cause of damage, the presence of del-
4
R e t u r n To I n d e x
eterious ASR gel must be verified. A site of expansive reaction can be defined as an aggregate particle that is recognizably reactive or potentially reactive and is at least partially replaced by gel. Gel can be present in cracks and voids and may also be present in the area around aggregate particle edges. A network of internal cracks connecting reacted aggregate particles is an almost certain indication that ASR is responsible for cracking. A petrographic examination (ASTM C 856) is the most positive method for identifying ASR gel in concrete. Prepared sections of concrete are examined under a microscope by an experienced petrographer to determine the presence and location of reactive aggregates and gel. Petrography, when used to study a known reacted concrete, can confirm the presence of reaction products, and verify ASR as an underlying cause of deterioration.
Control of ASR in New Concrete The best way to avoid ASR is to take appropriate precautions before concrete is placed. Standard concrete specifications may require modification to address ASR. These modifications should be carefully tailored to avoid limiting the concrete producers' options. This permits careful analysis of cementitious materials and aggregates and choosing a control strategy that optimizes effectiveness and the economic selection of materials. The flow chart in Fig. 2 illustrates a process of determining if potential for reaction exists and of selecting materials to control ASR. If the aggregate is not reactive by historical identification or testing, no special requirements are needed.
Identification of Potentially Reactive Aggregates Field performance history is the best method of evaluating the susceptibility of an aggregate to ASR. For the most definitive evaluation, the existing concrete must have been in service for at least 15 years. Comparisons should be made between the existing and proposed concretes for mixture proportions, ingredients, and service environments. This process will tell
April 1997
NO
Expansion after 14 days, percent
Is there an adequate field performance history for the aggregate? YES
YES
Based on field history, is the aggregate potentially reactive? NO
Will new concrete contain materials similar to those used in the field?
NO
YES Test the aggregate Will the environment be more severe than that in the field history?
YES Petrography ASTM C 295 and Mortar-bar test ASTM C 1260
NO
Does testing indicate reactive aggregate?
NO
No special requirements NO
OPTIONAL YES Concrete-prism test ASTM C1293
NO
YES
Does testing indicate reactive aggregate?
Use special requirements
Limit concrete alkalies
0.50 FBJH cific cement-aggreRhyolitic tuff gate combinations 0.45 ASTM C 1260 to resist ASR. 0.40 When these methB CSF ods indicate no J CSF 0.35 potential for H FA 0.30 reactivity, no speJ H cial requirements F FA F 0.25 are needed. If the FA B quick methods in0.20 GBFS dicate reactivity, 0.15 there is an opJ H ASTM C 1260 limit tional test, C 1293 0.10 F (CSA A 23.2-14A, H B J F 0.05 F H B the concrete prism test), that can be 0 0 10 20 30 40 50 60 70 run over the pePercent mineral admixture riod of a year to help resolve unFig. 3. ASR expansion versus dosage for various Fig. 3. Fly ash (FA), slag (GBFS), certainties about mineral admixtures including condensed silica fume and fume (SF)(GBFS). can be used results from (CSF), silica fly ash (FA), and slag to control ASR expansion. C 1260. When reactivity is indicated by either field history or testing, special use has been successful with slightly requirements reactive to moderately reactive aggremust be used to gates. However, low-alkali cements control ASR. are not available in all areas. Thus, the use of locally available cements in Materials and combination with pozzolans, slags, or Methods to blended cements is preferable for conInhibit ASR trolling ASR. When pozzolans, slags, or blended The most effective cements are used to control ASR, their way of controlling effectiveness must be determined. expansion is to deTwo testing options, A or B, are outsign mixes specifilined in Fig. 2 . Where applicable, difcally to control ferent amounts of pozzolan or slag ASR, preferably should be tested to determine the opusing locally availtimum dosage. Expansion usually deable materials. The creases as the dosage of the pozzolan following options or slag increases (see Fig. 3). are not listed in
Are pozzolans, slags, or blended cements available?
NO
YES Proven effectiveness Option A ASTM C 1260
Option B OR
ASTM C 441
priority order and, although usually not necessary, they can be used in combination with one another. In North America, current practices include the use of a mineral admixture or blended cement proven by testing to control ASR or limiting the alkali content of the concrete. Mineral admixtures include fly ash, ground granulated blast furnace slag, silica fume, and natural pozzolans. Blended cements use slag, fly ash, silica fume, and natural pozzolans to control ASR. Low-alkali portland cement (ASTM C 150) with an alkali content of not more than 0.60% (equivalent sodium oxide) can be used to control ASR. Its
Fig. 2. Flow chart listing steps to control ASR.
whether special requirements are needed, are not needed, or whether testing of the aggregate is needed. The use of newer, faster test methods provides for initial screening. Where uncertainties arise, lengthier tests can be used to confirm results. Currently, when it is necessary to test aggregates, use ASTM C 295 (petrographic analysis) and C 1260 (the rapid mortar-bar test), as the quickest indicators of potential reactivity of an aggregate. ASTM C 1260 is by intent an extremely severe test. It is not intended or suitable for selecting spe-
Excerpt The above article is a brief excerpt taken from Diagnosis and Control of AlkaliAggregate Reactions in Concrete (IS413), published by PCA in 1997. This 24-page document explains alkali-aggregate reaction, tells how to recognize AAR distress, tells how to properly use tests to identify potentially reactive aggregates, and gives guidance on how to control AAR. This publication (IS413) resulted from the the involvement of many experts in the concrete industry in North America. It bears the logos of the American Concrete Pavement Association, the National Ready Mixed Concrete Association, and the National Aggregates Association, in addition to the Portland Cement Association.
5
R e t u r n To I n d e x
Concrete Technology Today
Laboratory Notes: Thermal Analysis by TGA, DTA, and DSC by Paul D. Tennis*
* Materials Research Engineer, Product Standards and Technology, Portland Cement Association **A Celcius temperature scale is used throughout as it is standard practice in the laboratory. For conversion, °F␣ =␣ 32 + (9/5) °C
TGA Thermogravimetric analysis (TGA) is a technique that measures the mass (weight) of a sample as it is being heated (or cooled) at a controlled rate. The sample is placed in a crucible and heated in a thermobalance. The weight change of the sample depends on the composition of the sample, the temperature, the heating rate, and the type of gas in the furnace (air, oxygen, nitrogen, argon, etc.). A change in mass within spe40 Volatiles retained, %
Thermal analysis techniques have been used for many years on cement and concrete to provide insight into the chemistry of the hydraulic reactions and the interactions of cement with both mineral and chemical admixtures. In general, these tests can be performed in a short amount of time. This article provides a brief introduction to three common methods, shows a typical output of each test, and gives examples of their use by analytical laboratories in the construction industry. In all three techniques, a small sample is heated at a controlled rate to high temperature (up to 1000°C or more).** As compounds in the sample react or decompose, these analytical tools record the changes that occur as a function of time or temperature. As the sample’s temperature changes, various reactions can occur that will cause a change in the sample’s weight, temperature, or energy: a solid can melt, vaporize, decompose to a gas with a residual solid, or react with a gas (at elevated temperatures) to form a different solid or a different solid and another gas. Typical uses for these analytical techniques might include: • solving early stiffening problems with concrete or mortar; • analyzing durability problems with concrete; • identifying impurities in raw materials; • identifying which hydration products have formed and in what quantities; • quantifying the amount of carbonation that has taken place in an exposed sample; • determining the amount of weathering in clinker or cement; • estimating the reactivity of pozzolanic materials; • identifying the organic matter content and variations in quarry composition (for several case studies, see Reference 1).
30 20 10 0
100
300 500 700 Temperature, °C
900
Figure 1. The weight loss in a wellhydrated portland cement paste as a function of temperature. Reference 2. cific temperature ranges identifies the presence of different chemical compounds. The magnitude of the weight change indicates the amount of the compound in the sample. Figure 1 shows a thermogravimetric analysis curve of a sample of hydrated cement paste. The sample’s free water will evaporate, lowering the mass of the sample, as the temperature is raised from room temperature (about 23°C ) to about 100°C. The sample will also lose some of the water bound in hydration products, particularly some of the water in the aluminate hydrates. Between about 100°C and 400°C, water bound in the hydration products, primarily the C-S-H gel, will be lost, together with the remainder of water in the aluminate hydrates. Between about 400°C and 500°C, calcium hydroxide provides a relatively distinct weight loss as it decomposes
6
R e t u r n To I n d e x
to calcium oxide (a solid) and water vapor. The amount of this weight loss can be used to determine how much calcium hydroxide was originally present in the sample. Above 500°C, a small amount of additional water may be lost from the hydration products. Carbonated phases lose carbon dioxide around 800°C. By quantifying the amount of calcium hydroxide, a TGA gives an indication of the degree of hydration that has taken place in a sample. The reactivity of pozzolans can be assessed by tracking the disappearance of calcium hydroxide due to the pozzolanic reaction.
DTA Differential thermal analysis (DTA) is an analytical method in which the difference in temperature between a sample and a control is measured as the samples are heated. The control is usually an inert material, like powdered alumina, that does not react over the temperature range being studied. If a sample undergoes a reaction at a certain temperature, then its temperature will increase or decrease relative to the (inert) control as the reaction gives off heat (exothermic) or adsorbs heat (endothermic). A thermocouple measures the temperature of each material, allowing the difference in temperature to be recorded. DTA can be performed simultaneously with TGA. Figure 2 shows two DTA curves for a portland cement paste: (a) after 15 minutes of hydration, and (b) after 24 hours of hydration. Three small inverted peaks (valleys) in the upper curve indicate endothermic reactions. These are due to the loss of some of the water chemically bound in ettringite, in calcium sulfate (gypsum), and in calcium hydroxide. By 24 hours, the peaks in the lower curve due to gypsum have disappeared, while one for (C-S-H) has appeared. The magnitude of the peaks due to ettringite and calcium hydroxide have increased, indicating that the amounts of those two phases increased as the cement hydrated.
DSC In differential scanning calorimetry (DSC), the heat adsorbed or released is measured directly (and compared
April 1997
C
Exothermic
A E
100
∆T
(b) b
C
200 300 400 500 Temperature, °C
Figure 2. Differential thermal analysis curves for a neat cement paste after (a)␣ 15␣ minutes and (b)␣ 24␣ hours of hydration. A␣ =␣ calcium silicate hydrate (C-S-H); C␣ =␣ calcium hydroxide; E␣ =␣ ettringite; G␣ =␣ gypsum, Adapted from Reference␣ 3.
a(a) C S G
b(b)
S C
E 100
20 mw
Exothermic
E
200 300 400 500 Temperature, °C
Figure 3. Differential scanning calorimetry thermogram of a portland cement paste at (a) 15 minutes and (b) 24 hours of hydration. C␣ =␣ calcium hydroxide; E␣ =␣ ettringite; G␣ =␣ gypsum; S=syngenite. Reference 4.
to a reference) as a function of temperature or time. An advantage of DTA and DSC methods is that no mass change is required; thus if a sample melts without vaporizing, measurements can still be obtained.
S (b)
E 100
0.2 W/g
E
(a)
Exothermic
(a) a G
Like DTA, DSC can be used to determine what compounds are present at different stages of hydration. Figure 3 shows two differential scanning calorimetry curves or thermograms. The upper curve (a) shows a portland cement paste after 15 minutes of reaction. The peaks in the curve between 100°C and 200°C are due to the endothermic (heat adsorbing) decomposition of gypsum and ettringite, while the peak around 270°C is due to syngenite (potassium calcium sulfate hydrate). Near 450°C, a smaller peak can be seen. As with the other methods described above, this is due to calcium hydroxide. The lower curve (b) in Figure 3 shows the same cement paste after 24 hours of hydration. Note the disappearance of the peak due to gypsum, the reduction in the size of the peak due to syngenite and the growth of those due to ettringite and calcium hydroxide. The size of the areas under the curves are related to the quantity of the material in the sample. Several case studies of the use of DSC in cement manufacturing are given in Reference 1.
C
200 300 400 500 Temperature, °C
Figure 4. DSC curves of a cement paste mixed with (a) tap water and (b) a contaminated groundwater. Note the reduction in the area under the curve of the contaminated sample. The units on the vertical axis have been normalized to the sample weight. C␣ =␣ calcium hydroxide; E␣ =␣ ettringite; S=syngenite. Reference 4.
Concrete Applications
References
Thermal analysis has been used to help identify the cause of distress in field concrete. As an example, in one investigation, a zero-slump concrete was placed in contact with groundwater and began to show signs of distress soon thereafter. Cored samples of the distressed concrete were sent for analysis. DSC and TGA results indicated that the cement was severely retarded. This can be seen in Figure 4, where separate samples of the cement were mixed with tap water and with groundwater from the field site. The retardation effect is evident in the (roughly) 30% reduction in the calcium hydroxide peak. Peaks for ettringite are also reduced. Similar reductions were noted in the cement paste from the cored concrete. In conjunction with petrographic examination and other chemical analyses, it was determined that the zero-slump concrete probably imbibed groundwater contaminated with sulfates and other chemicals that severely retarded the setting of the cement. This led to the distress noticed in the field concrete.
1. Shkolnik, E., and Miller, F.M., “Differential Scanning Calorimetry for Determining the Volatility and Combustibility of Cement Raw Meal Organic Matter,” World Cement Research and Development, May 1996, pages 81-87. 2. Taylor, H.F.W., Cement Chemistry, p. 207, Academic Press Limited, London, 1990. 3. Bensted, J., and Varma, S.P., “Some Applications of Infrared and Raman Spectroscopy in Cement Chemistry,” Cement Technology, September/October, 1974, pages 440-442, 444-445, 448-450. 4. DSC curves courtesy of E. Shkolnik, Construction Technology Laboratories, Skokie, Illinois, (847) 965-7500 ext. 222.
Editor’s Note: “Laboratory Notes” is a new section to Concrete Technology Today that will appear periodically to review test methods used for testing concrete or concrete ingredients. Readers are encouraged to send suggested topics to the editors for future issues.
7
R e t u r n To I n d e x
Concrete Technology Today
Sent to you compliments of: Portland Cement Association 5420 Old Orchard Road Skokie, Illinois 60077-1083 Route to
New Literature The following publications are now available. To purchase any of these in the United States, contact Portland Cement Association, Order Processing, P. O. Box 726, Skokie, IL 60076-0726; telephone 1-800/8686733, or fax 847/966-9666 (24 hours a day, 7 days a week). In Canada please direct requests to the nearest regional office of the Canadian Portland Cement Association (Halifax, Montreal, Toronto, and Vancouver).
Diagnosis and Control of Alkali-Aggregate Reactions in Concrete, IS413 See article “Controlling ASR”on pages 4 and 5.
Design Criteria for Insulating Concrete Form Wall Systems, RP116 This 50-page report discusses the results of a research program to investigate and develop design crite-
ria for residential concrete walls built using insulating concrete forms. Results of an analytical study of several wall systems under a wide variety of loading conditions are reported. Results of experiments on six wall panels are presented and compared to the analytical study. Existing design methodologies are investigated and design criteria for insulating concrete form wall systems for residential construction are suggested.
The Use of Limestone in Portland Cement: A State-ofthe-Art Review, RP118 This 38-page report summarizes published literature and laboratory reports concerning limestone additions to portland cement. Topics include effects on particle size distribution, workability, hydration behavior, heat evolution, microstructure, setting time, strength, durability (permeability, carbonation, freeze-thaw resistance, sulfate attack, chloride resistance, and alkali-
silica reaction), and interactions with chemical and mineral admixtures.
Development of an Early Stiffening Test, RP346 This 36-page report discusses research in which several commercial cements with known early stiffening problems in concrete, as well as supplemental cements prepared in the laboratory, were tested by ASTM C359, “Early Stiffening of Portland Cement (Mortar Method),” and ASTM C451, “Early Stiffening of Portland Cement (Paste Method).” The lack of reliability of these two methods led to consideration and development of the mini-slump cone test as an alternative method. The test was found to be sensitive not only to varying degrees of false set but also to the type of stiffening usually observed in concrete, making it a viable alternative method for predicting the early stiffening behavior of portland cements.
This publication is intended SOLELY for use by PROFESSIONAL PERSONNEL who are competent to evaluate the significance and limitations of the information provided herein, and who will accept total responsibility for the application of this information. The Portland Cement Association DISCLAIMS any and all RESPONSIBILITY and LIABILITY for the accuracy of and the application of the information contained in this publication to the full extent permitted by law. Our purpose is to show various ways of using concrete technology to your Intended for decision makers associadvantage and avoiding problems. If ated with design, management, and there are problems or ideas readers construction of building projects, would like discussed in future issues, Concrete Technology Today is published please let us know. Items from this triannually by the Construction Infor- newsletter may be reprinted in other mation Services Department of the publications subject to prior permisPortland Cement Association. sion from the Association.
PUBLISHER'S NOTE:
Printed in U.S.A. 8
Direct all correspondence to Steve Kosmatka, Editor Jamie Farny, Assistant Editor Concrete Technology Today Portland Cement Association 5420 Old Orchard Road Skokie, Illinois 60077-1083 Phone: 847/966-6200 Fax: 847/966-8389 E-mail:
[email protected] E-mail:
[email protected]
PL971.01B
R e t u r n To I n d e x