TECHNICAL FEATURE This article was published in ASHRAE Journal, May 2014. Copyright 2014 ASHRAE. Posted at www.ashrae.org. This article may not be copied and/or distributed electronically or in paper form without permission of ASHRAE. For more information about ASHRAE Journal, visit www.ashrae.org.
Figure 1: Infosys SDB-1 Hyderabad. Half of the building has radiant cooling and half has VAV cooling.
VAV vs. Radiant Side-by-Side Comparison BY GURUPRAKASH SASTRY AND PETER RUMSEY, P.E., FELLOW ASHRAE
Infosys, one of India’s top three software companies, implemented a program in 2011 to find the best way to cool its buildings, while creating lower energy buildings that better suited the needs of its employees. The resulting building, Software Development Block 1 (SDB-1) in Hyderabad, not only became the first radiantly cooled building in India, but also resulted in the world’s largest HVAC side-by-side comparison. The SDB-1 building includes two cooling systems. Half of the building has an optimized variable air volume (VAV) system. The other half has a radiant cooling with dedicated outdoor air system (DOAS). The building was highly instrumented to measure the impacts of the two systems. After two years of operation, the radiant system has used 34% less energy as compared to the VAV system. The cost of the radiant system was slightly lower than the VAV system and comfort surveys found improved thermal satisfaction with the radiant system.
The Idea The SDB-1 building was designed with an envelope that minimizes heat and solar loads, while allowing fully daylit office spaces. The result is a building that has insulated walls with thermal breaks as well as an exemplary
sun shading system. The directive for the sunshades was straightforward. The sunshades and lightshelves needed to provide for 95% daylight autonomy with no direct sunlight entering the building. Daylight autonomy is the percent of the year that a space can be fully daylit during working hours. As a consequence, the floor plate of the building needed to be relatively narrow and lightshelves that doubled as sun shades were used throughout. The detailed daylight model verified that no internal shades were needed in the space since glare from direct sunlight was designed out of the building. Overall, the window-to-wall ratio is 30%. However, as a visitor recently observed, the SDB-1 building feels like a building with a much higher window-to-wall ratio because of the lack of blinds and the quality of the building envelope design.
Guruprakash Sastry is a regional manager of Infrastructure and Green Initiatives at Infosys. Peter Rumsey, P.E., is founder of Point Energy Innovations. 16
A S H R A E J O U R N A L a s h r a e . o r g M AY 2 0 1 4
TECHNICAL FEATURE
When it came time to design the HVAC system, the design team recommended radiant cooling with a dedicated outdoor air system (DOAS). While the Infosys team was eager to try something that had never been done before, they did want the ability to compare the radiant system to their best in class variable air volume (VAV) system. At the time VAV systems were the standard in all new buildings. Infosys decided to take the 250,000 ft2 (23 226 m2) building and divide it into two halves, one with radiant cooling and the other with the optimized VAV system.
Cooling Systems The two cooling systems in the building, VAV and radiant, are designed to operate independently and to represent the best possible design of both systems. To have a fair comparison, the SDB-1 building is split symmetrically. Both sides of the building have the same orientation and, therefore, the same solar loads. All parameters such as type of lighting, number of occupants and building envelope are kept the same on both sides.
VAV Air-Conditioning System • High efficiency VSD chiller (275 tons [967 kW]), VSD pumps, VSD AHUs and VSD cooling tower; • Chilled water design temperatures: supply 46°F (7.8°C), return 60°F (15.6°C) high DT design; • Primary variable flow pumping; • Cooling tower approach: 4°F (2.2°C); • AHUs with energy recovery wheel, evaporative cooling section and free cooling option for different ambient condition advantages; • Low pressure piping and ducting design; and VAV Cooling • VAV boxes with low minimum for controlling airflow in office spaces. No reheat coils were used due to hot climate and low VAV minimums.
FIGURE 2: South façade sun shading and lightshelf detail, full daylight, no direct solar or glare.
• Chilled water design temperatures: supply 57°F (14°C), return 63°F (17°C); • DX coil with the DOAS AHU for achieving dehumidification; • Desiccant energy recovery wheel in DOAS; • Primary variable flow pumping system; • Cooling tower approach: 4°F (2.2°C); • Low pressure piping and ducting design; • Radiant in slab tubing 0.5 in. (12.5 mm) (inner diameter) cross-linked polyethylene (PEX) with overlapping 6 in. (150 mm) on center layout and manifolds with on/off control valves; • Passive chilled beams in conference rooms for fast response and high loads; and • Overhead ceiling fans for air movement. The weather in Hyderabad is either hot and humid or hot and dry. There is no cold season. Last year, the maximum Radiant Cooling
Radiant Cooling System • High efficiency VSD chiller (275 tons [967 kW]), VSD pumps, VSD DOAS AHU and VSD cooling tower;
FIGURE 3: Infosys SDB-1 Hyderabad, typical floorplan.
M AY 2 0 1 4 a s h r a e . o r g A S H R A E J O U R N A L
17
TECHNICAL FEATURE
temperature was 115°F (46°C) and the peak dew point was 77°F (25°C). This is a difficult climate for any HVAC system. More importantly, this hot and humid climate is an important test of the cooling ability and humidity control of radiant with DOAS.
Cooling Tower
DOAS AHU
To Radiant Manifolds
Assessing the Impact The team designed the building in a way that would facilitate the measurement of energy use of the two cooling systems. To this end, they built two fully independent cooling systems: one for the VAV portion of the building and one for the radiant portion. The design creates separate chilled water and air-handling systems for each half of the building. Every pump, air handler, chiller and cooling tower has a stand-alone power meter. The team used accurate full bore magnetic flow meters and accurate temperature sensors to observe the instantaneous chilled water system efficiency in kW/ton or COP. After one year of operation, the Technical University of Braunschweig (Technische Universität Braunschweig) reviewed the energy data for accuracy and measured the indoor air quality and comfort conditions. The comfort impacts were assessed using the University of California at Berkeley (UCB) Center for the Built Environment, which conducted the occupant satisfaction survey that assessed comfort in the building. This survey has been used on more than 35,000 building occupants on several hundred buildings.
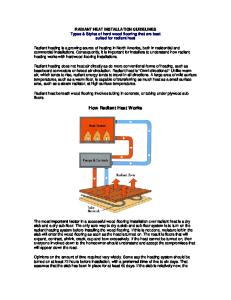
Chiller –55°F Ventilation Air to the Building
Air Cooled Chillers FIGURE 4: Radiant system diagram.
Radiant Cooling in Slab
Ceiling Fan for Air Movement Neutral Dehumidified Ventilation Air
Advanced Lightshelf Sun Shade
FIGURE 5: Radiant system configuration.
Results Energy The building was fully occupied in February 2011. The comparison results from the energy meters in the building are shown in Figure 9 (Page 22) for the period April 2011 to March 2012. In 2011–12, the energy consumption for HVAC in the VAV air-conditioning system totaled 440,000 kWh or 12.3 kBtu/ft2 (38.7 kWh/m2) and 269,000 kWh or 8.1 kBtu/ft2 (25.7 kWh/m2) for the radiant cooling system. The radiant cooling system used 34% less energy. The distribution of energy shows that the percentage breakdown of air-handling energy is lower and pumping higher in the radiant system. The average chiller plant (including chiller, pumps and tower) efficiency was 0.6 kW/ton for the VAV air-conditioning system with low-temperature chilled water system. The medium temperature chiller plant serving the radiant portion 18
A S H R A E J O U R N A L a s h r a e . o r g M AY 2 0 1 4
FIGURE 6: Radiant slab system before concrete pour.
of the building operated at an average of 0.45 kW/ton (again, including chiller, pumps and tower).
Comfort and Air Quality To assess air quality and comfort, the Braunschweig team used a portable cart with temperature, humidity,
TECHNICAL FEATURE
air velocity, CO2 and mean radiant temperature sensors. Using the European Standard DIN EN 7730, the radiant side of the building had a predicted percent dissatisfied rating of 7.9% as compared to 8.7% for the VAV portion of the building. They did find that the CO2 levels in the radiant side of the building were slightly higher than the VAV side of the building. This has since been rectified through a small increase of the amount of outdoor air provided by the DOAS AHU. Later, detailed monitoring of IAQ was conducted by SGS India Pvt. Ltd. Its report found that all comfort parameters were within the limits of ASHRAE Standards 55-2004 and 62.1-2007. The most important finding is based on the survey of the building’s occupants. The University of California, Berkeley Center for the Built Environment survey found increases in occupant comfort. The group that fell in the “satisfied or very satisfied” category grew from 45% on the VAV portion of the building to 63% on the radiant portion.
Mar. 27 108°F
110°F Dec. 10 97°F
100°F
Jul. 2 93°F
Feb. 15 93°F
90°F
Sept. 15 93°F Oct. 28 88°F
80°F Apr. 21 73°F
70°F
50°F
Mar. 4 57°F Dec. 28 50°F Dec. Jan. Feb. Mar. Apr.
Sept. 9 70°F
Jun. 25 70°F
60°F
Oct. 19 66°F
Nov. 17 52°F
May
Jun.
Jul.
Aug. Sep. Oct. Nov.
FIGURE 7: Dry-bulb profile, Hyderabad, India, November 2012 through October 2013. Source: Weatherspark.com
80°F
Nov. 27 72°F
70°F
Apr. 24 75°F
Aug. 17 77°F
Jun. 8 73°F
Jul. 13 64°F Nov. 6 54°F
Oct. 3 75°F
Feb. 15 64°F
60°F 50°F
Cost
May 22 115°F
120°F
May 31 57°F
Aug. 24 63°F Oct. 18
46°F One of the most important elements of any 40°F new technology is the capital cost. Higher Apr. 17 30°F capital cost usually means higher risk and, 34°F Dec. 26 30°F therefore, slow adoption. In the case of radiMar. 3 20°F ant cooling in the SDB-1 project, the capital 23°F Dec. Jan. Feb. Mar. Apr. May Jun. Jul. Aug. Sep. Oct. Nov. cost of the system was slightly lower than the VAV system. A detailed breakdown of the HVAC costs incurred for the building is FIGURE 8: Dew-point profile, Hyderabad, India, November 2012 through October 2013. Source: Weatherspark.com shown in Table 1 (Page 23). This lower cost is a major factor in drivlighting. Chiseling into the ceiling and repairing the leak ing the radiant cooling technology for occurred quickly and easily. future Infosys buildings. One of the main objectives Condensation was not a problem in the buildthat Infosys set out to achieve through this building except for on the uninsulated manifolds. Once ing was to test the cost implications of lower energy identified as a problem, the manifolds were quickly buildings. insulated. Lessons Learned Turning the slab off one to two hours before unoccuThe contractor had two leaks in the radiant tubing over pied hours and back on one to two hours before occuthe whole 125,000 ft2 (11 613 m2) of the building when pancy used less energy than running the slab at lower an electrical contractor drilled into the ceiling to install loads throughout the day. 20
A S H R A E J O U R N A L a s h r a e . o r g M AY 2 0 1 4
TECHNICAL FEATURE
22
A S H R A E J O U R N A L a s h r a e . o r g M AY 2 0 1 4
Percent Respondents
Percent Respondents
kWh/m2
The lowest cost way to serve high latent 45 load areas such as conference rooms is 38.7 40 35.9 through increased ventilation air while 34.2 35 occupied. Conventional 30 The Technical University of Radiant 25.7 Braunschweig team provided input that 25 the space dew point was best kept below 20 17.2 the chilled water supply temperature, 14.4 15 not the slab surface temperature. They 10 8.1 8.8 pointed out that over time moisture could migrate through the slab toward the 5 chilled water tubing. 0 Lighting Misc. Power Computers HVAC Infosys tested several temperature control strategies. The simplest and most robust FIGURE 9: 2011 – 2012 energy index of different load components in the building. strategy was found to be one that controlled the manifold valves based on a fixed return VAV System Radiant System water temperature. The radiant system needed one air handler Air Handlers instead of the six used by the VAV system. Cooling 13% Towers 3% This saved considerable space and construcAir Handlers tion costs. 30% Pumps The original DX dehumidification coil 13% Chillers Chillers/DX in the DOAS air handler did not dehu60% Unit Cooling Pumps 71% midify the air as precisely as hoped. As Towers 7% the compressors in the DX unit staged 3% on and off, water would condense and re-evaporate into the airstream. In addiFIGURE 10: Distribution of energy use. tion, the DX unit was air cooled and, therefore, inefficient. After the first year of operation, Infosys decomMean 0.77 missioned the DX unit and 50 Mean 0.14 50 added a chilled water coil 40 33% that was connected to the 40 30 low-temperature chiller on 30 24% the VAV system. To track the 18% 21% 20 20 13% 12% 14% 14% energy impact of this modi9% 9% 12% 10 6% 7% 7% 10 fication, the energy team 0 included a Btu meter in the 0 –3 –2 –1 0 1 2 3 –3 –2 –1 0 1 2 3 piping and took this into 24% 13% 63% 33% 21% 45% account in future energy cal Dissatisfied Neutral Satisfied Dissatisfied Neutral Satisfied culations. After this change, Radiant System VAV System humidity control in the FIGURE 11: Center for the Built Environment occupant survey results. radiant side of the building improved, and energy use declined. The resulting energy savings of the radiant Conclusion The radiant portion of the SDB-1 building in system compared to the VAV system in the second Hyderabad provides further proof that radiant cooling, and third year of operation has been 42%.
TECHNICAL FEATURE
properly designed, is more efficient than VAV cooling. This comparison, based on actual measurements instead of simulations, is more reliable and accurate than studies that use energy modeling software. The building has been awarded a LEED India Platinum rating. Those in India looking for guidance on low energy buildings visit it frequently. The building also was featured in the Best Practices Guide for High Performance Office Buildings in India published by the Lawrence Berkeley National Lab. One of the more exciting stories of the building was when a large software company from Silicon Valley came to visit. They wanted to see a large-scale radiant building in a challenging climate with software engineer employees. The SDB-1 building was one of only a handful of buildings in the U.S., Europe and Asia that they visited. Based on the visit and some other research, they decided to proceed with radiant cooling in their own building. It is indeed a surprise when a U.S. company visits India for validation of innovative ideas and technologies. Infosys has found and proved to itself that radiant cooling improves comfort, lowers HVAC energy use and saves HVAC construction costs. Infosys has combined the radiant energy savings with better building envelopes and lighting to produce buildings that use 60% to 70% less energy than the generation of buildings from just five years ago. As a result of the SDB-1 building, Infosys has transformed its building standards. It is now completing more than 2 million ft2 (185 806 m2) of radiantly cooled buildings. Most of those use the in-slab system, but they also have a 500,000 ft2 (46 452 m2) building with radiant panels. They have started to use the medium temperature chilled water design in these buildings. A new campus in Pune has a central plant with two different chilled water temperatures distributed throughout the campus. That
TABLE 1 � Cost comparison of conventional & radiant cooling system. VAV
RADIANT
CHILLER
3,145,200
3,145,200
COOLING TOWER
1,306,400
1,306,400
HVAC LOW SIDE WORKS
22,839,000
15,310,000
AHUS, DOAS, HRW
5,118,200
2,878,900
RADIANT PIPING, ACCESSORIES, INSTALLATION, ETC.
0
9,075,800
BUILDING AUTOMATION SYSTEM
6,184,000
6,584,000
TOTAL COST (IN RUPEES)
38,592,800
38,300,300
AREA (M 2)
11 600
11 600
RUPEES/M 2
3,327
3,302
HVAC SYSTEM COST $/FT 2
$5.15/FT 2
$5.11/FT 2
Advertisement formerly in this space.
M AY 2 0 1 4 a s h r a e . o r g A S H R A E J O U R N A L
23
TECHNICAL FEATURE
plant has two sets of chillers, including one dedicated to medium temperature chilled water at 55°F to 60°F (12.8°C to 15.6°C). All new buildings use thin floor plates with excellent daylighting and shading. In addition, Infosys has realized that many of its older buildings can be retrofitted for lower energy. It has
begun a large chilled water plant and lighting upgrade program. Over the last five years, Infosys has lowered energy use per capita throughout the company by more than 40%. The cumulative value of these savings is more than $50 million.
Bibliography Olesen, B.W. 2008. “Radiant Heating and Cooling by Embedded Water Based Systems.” Technical University of Denmark. REHAU. 2013. “REHAU Radiant Heating Systems Design Guide.” REHAU AG, Germany. http://tinyurl.com/kzbu4ct. Singh, R., D. Sartor, G. Ghatikar. 2012. “Best Practices Guide for High-Performance Indian Office Buildings.” Lawrence Berkeley National Laboratory. Technische Universitat Braunschweig. 2011. “Infosys SDB-1 Hyderabad, Evaluation of Efficiency and User Comfort.”
Advertisement formerly in this space.
Wang, Z.,et al. 2009. “Modeling Thermal Comfort with Radiant Floors and Ceilings.” 4th International Building Physics Conference. Weeks, K., D. Lehrer, J. Bean. 2007. “A Model Success: The Carnegie Institute for Global Ecology.” Center for the Built Environment, University of California, Berkeley. Zmrhal, V., J. Hensen and F. Drkal. 2003. “Modeling and Simulation of a Room with a Radiant Cooling Ceiling.” IBPSA.
Acknowledgments Rohan M Parikh, Head of Green Initiatives, Infosys Limited, Bangalore, India. V V S Suryanarayana Raju, Senior Manager— Infrastructure, Infosys Limited, Bangalore, India. Punit H Desai, Senior Manager—Green Initiatives, Infosys Limited, Bangalore, India. Stefano Mattioli, Rehau Polymers Private Limited, India. Tanmay Tathagat, Managing Director, Environmental Design Solutions, New Delhi, India. John Weale, Principal, Integral Group, New York.
24
A S H R A E J O U R N A L a s h r a e . o r g M AY 2 0 1 4