PROJECT FUNDED BY THE JAPAN FUNDS IN TRUST Disclaimer: The views expressed in the reports in this publication are those of the authors and do not necessarily reflect those of the WIPO Secretariat or any of its Member States.
. . Ta b l e o f C o n t e n t s
Preface
3
Contributors
4
(I) Impact of Intellectual Property System on Economic Growth: Fact-Finding Surveys and Analyses in the Asian Region. General Report - Hiroshi Kato and Futoshi Yasuda
9
China - Ping Zhang
26
India - Sanjay Kumar Verma
45
Japan - Hiroshi Kato and Futoshi Yasuda
60
Korea - Jiyoung Han
74
Malaysia - Heng Gee Lim
89
Vietnam - Mai Phuong Nguyen
111
General Report - Sadao Nagaoka and Kazufumi Yaji
127
China - Xiang Yu
154
Japan - Sadao Nagaoka and Kazufumi Yaji
211
Korea - Sun Hee Yun
242
Singapore - Wee Loon Ng-Loy
261
Thailand - Wisanu Subsompon
277
[ Table of Contents ]
(II) Institutional Infrastructure for IPR-Based Development in Asia, with a Focus on National Patent Systems.
Preface
During the 17th ordinary session of the WIPO General Assembly in September 2005, the Commissioner of the Japan Patent Office (JPO) proposed the establishment, and offered to host, a WIPO Office to coordinate research on intellectual property (IP) and development, in cooperation with the United Nations University (UNU). In September 2006, the WIPO Japan Office was officially established in Tokyo as a center for research on IP and development.
3
The first research project organized by the Office was entitled Impact of Intellectual Property System on Economic Growth: Fact-Finding Surveys and Analyses in the Asian Region. The objective of this research, completed in 2007, was to measure the impact of the IP system on economic growth. National experts from China, India, Japan, Korea, Malaysia and Vietnam participated in this first research project. The second research project, completed in 2009, was entitled Institutional Infrastructure for IPR - Based Development in Asia, with a Focus on National Patent Systems. National experts from China, Japan, Korea, Singapore and Thailand participated in this second research project. This research reviewed and analyzed the most recent developments in the institutional setup and management practices of patent offices in these countries with a view to helping develop best practices. Both studies were carried out in cooperation with the UNU and funded by the Japan Funds-in-Trust. In each project, the research followed a single methodology and was guided by a chief expert, who was also responsible for the general report which summarized the key points of the national reports and provided further analysis of the data collected at the national level. Each national expert and his/her research teams were in charge of the research in their country and the corresponding national report.
[ Preface ]
This publication is a compilation of the general and national reports from both research projects. It is hoped that they will be of interest to policy makers and positively contribute to the on-going debate regarding the relationship between intellectual property and economic development.
[ Contributors ]
4
(I) Impact of Intellectual Property System on Economic Growth: Fact-Finding Surveys and Analyses in the Asian Region. Jiyoung Han Dr. Han has been a Professor at Chosun Univ., Korea since September 2006. He received his Ph.D. (Jur. Dr.) from Ludwig-Maximilian University (LMU) Munich, Germany in 2003 and was a researcher at the Max-Planck-Institute for Intellectual Property Rights in Munich from 1998-2003. From July to November 2004 he was invited as Researcher at the Institute of Intellectual Property (IIP) in Tokyo, Japan. He was also a researcher at GRIPS, Tokyo (April 2005 to August 2006) and the University of Cambridge, U.K. (July to August 2005) Hiroshi Kato Dr. Kato is a Professor at the College and Graduate School of Law of Nihon University. He holds both a Bachelor’s and a Master’s degree from the University of Tokyo and a Ph.D. from the University of Tohoku. From 1990 to 2009 he held several positions at the Japan Patent Office (JPO) particularly in areas relating to the examination of patents. He was also a lecturer for developing countries and served in 1995 and 1999 as a WIPO Expert in the Philippine Intellectual Property Office. Dr. Kato has conducted intellectual property research at Harvard University (1997) and was an Associate Professor at the National Graduate Institute for Policy Studies (2005).
[ Contributors ]
Heng Gee Lim Dr. Lim is a Professor of Law at the Faculty of Law, Universiti Teknologi MARA, Shah Alam, Malaysia, specializing in Intellectual Property Law. Besides his academic duties, Dr. Lim is a resource person at the Intellectual Property Training Centre, Malaysia. He also serves as a member of various Advisory Committees on Intellectual Property Laws in the Intellectual Property Corporation of Malaysia, advising on various amendments to the intellectual property laws. He is also a member of the Steering Committee on Intellectual Property Commercialization of the Innovation and Commercialization Division of the Ministry of Science, Technology and Innovation. In September 2008, Dr. Lim was appointed a Board Member of the Malaysian Intellectual Property Corporation for a two-year term. Mai Phuong Nguyen Mai Phuong Nguyen is a policy researcher at the National Institute for Science and Technology Policy and Strategy Studies (NISTPASS) since 2000. Her background is law, with specialization on intellectual property rights. In 2003, Miss Mai obtained her Master’s Degree in Science and Technology Policy Study from Maastricht University (the Netherlands) and Linkoping University (Sweden). She has research experience in the fields of IPRs, technology transfer, innovation systems, and issues related to small and medium enterprises. Apart from research projects for the Ministry of Science and Technology, Vietnam, she has also been involved in many international research projects for Sida, IDRC, UNESCO, United Nations University (Maastricht, the Netherlands), etc.
Sanjay Kumar Verma Dr. Verma obtained a Master's degree in Botany and a Ph.D in Environmental Biotechnology from Banaras Hindu University, Varanasi. He then worked as a post-doctoral research fellow at the University of Hyderabad in the area of microbial and molecular genetics. Dr. Verma has handled several research projects related to bioremediation and biodegradation of toxic industrial waste, development of biosensors for environmental applications, isolation of bioactive compounds from natural isolates and IPR-related issues. He is currently Associate Professor and Chief Warden at the Birla Institute of Technology & Science, Pilani. His main research interests include biochemistry and molecular biology of cyanobacteria, environmental biotechnology and IPR-related issues.
5
Futoshi Yasuda Futoshi Yasuda is currently a Director of Examination Policy Planning Office at the Japan Patent Office (JPO). An electrical engineer by training, with a Bachelor’s and a Master’s degree from Nagoya University, he began his career as an engineer at Toyota Industries Corporation (1990-1991). From 1991 to 2007 he held several positions at the JPO, in particular within the field of patent examination. Mr. Yasuda was also a visiting scholar at the University of California, Santa Barbara (2000-2001) and an Associate Professor at the National Graduate Institute for Policy Studies (2007-2009)
[ Contributors ]
Ping Zhang Dr. Zhang is a professor at Peking University Law School, and an active researcher on intellectual property frontiers since 1991. She has undertaken many key research projects for the Chinese government and multinational corporations. She also serves as the Secretary General of the Intellectual Property Association of Chinese Universities since 1998 and as an expert arbitrator on the Asian Domain Name Dispute Resolution Center (ADNDRC) and the Beijing Arbitration Commission.
6
(II) Institutional Infrastructure for IPR Based Development in Asia, with a Focus on National Patent Systems. Sadao Nagaoka Dr. Nagaoka has been a Professor of the Institute of Innovation Research at Hitotsubashi University since 1997. He is also a Research Counselor at the Research Institute of Economy Trade and Industry of Japan. He obtained both his Ph.D. in Economics and M.S. in Management from the Massachusetts Institute of Technology (MIT) and his B.E. in Engineering from the University of Tokyo in 1975. His fields of specialization are innovation and industrial organization. Wee Loon Ng-Loy Wee Loon Ng-Loy is the Director of LLM (Intellectual Property and Technology) program at the Law Faculty, National University of Singapore. Amongst her works of scholarship is the book Law of Intellectual Property of Singapore (2008, Sweet & Maxwell). She has served on the Board of Directors of the Intellectual Property Office of Singapore. She was also instrumental in setting up the IP Academy of Singapore, a national institute focused on the teaching and research in IP law and related fields. She now sits on its Board of Governors. She is also currently a member of the Copyright Tribunal of Singapore.
[ Contributors ]
Wisanu Subsompon Dr. Subsompon graduated with First Class honor in Civil Engineering in 1990 from Chulalongkorn University. He then earned an M.S. and Ph.D. at Carnegie Mellon University, in 1993 and 1996 respectively. After finishing his studies, he returned to teach and conduct research as a lecturer at Chulalongkorn University. He served as an Assistant to the President of the University during 20002004. He has been the Director General of Chulalongkorn University Intellectual Property Institute since 2004. Kazufumi Yaji Dr. Yaji is currently an Appeal Patent Examiner at the Japan Patent Office (JPO) where he has held several positions relating to the examination of patents since 1994. From 2001-2003, he served as Deputy Director in Japan’s Ministry of Economy, Trade and Industry (METI). Dr. Yaji obtained his Ph.D. from Tohoku University in 2006 through research on patents. He has served as Associate Professor, Graduate School of International Corporate Strategy, Hitotsubashi University (20072009), and visiting scholar at the University of Southern California (1999-2000). He has also taught part-time at the Graduate School of Nihon University (2006) and the Graduate School of Gunma University (2004). Xiang Yu Dr. Yu is a full professor at the School of Management of Huazhong University of Science & Technology (HUST) in Wuhan China (since June 2002), and the director of the Chinese-German Institute for Intellectual Property in HUST (since January 2005). He is a member of the European Academy of Sciences and Arts (Class V – Social Science, Law and Economics, since March 2009). Professor Yu has done research work at Max-Planck Institute for Intellectual Property, Competition and Tax Law in Munich, Germany for about four years (from April 1999 to December 2004,
separately as DAAD Scholarship, Max-Planck-Society Scholarship, and Alexander-von-Humboldt Scholarship holder), and did research work in Hokkaido University in Japan for one year (from September 2006 to September 2007, as a JSPS Scholarship holder).
7
[ Contributors ]
Sun Hee Yun Sun Hee Yun is a Professor of Law at Hanyang University. He has been a member of the Korea Industrial Property Law Association since 1997 and is currently serving a term as its President until 2013. Professor Yun has authored several books on intellectual property law in Korea.
[ Impact of the Intellectual Property System on Economic Growth ]
8
Impact of the Intellectual Property System on Economic Growth General Report Hiroshi Kato and Futoshi Yasuda*
9
1. Methodology 1.1. Background 1.2. Research Methodology 2. Results of the Research 2.1. Survey on Reforms toward IP-Based Economic Development 2.2. Case Studies on Companies utilizing the IP System to Develop Business or Increase Economic Activity 2.3. Analysis of Reforms that exerted Influence on Economic Development underpinned by the IP System using Economic Models 3. Discussion and Proposal
1. Methodology 1.1. Background Proponents maintain that the IP system is an effective way to enhance creativity, promote technological innovation, improve trade and enhance competitive positioning. However, its efficacy as a means to achieve economic development is still to be confirmed. Some developing nations questioned whether the IP system is the most effective and appropriate way to fuel the economy.
A Chief Expert from Japan, assisted by a number of other eminent IP and economic experts from China, India, Korea, Malaysia and Vietnam, coordinated the research project between Japan, the UNU and WIPO. Each expert worked on the preparation of a report based on an empirical study of his/her country’s IP system or IP policy and respective situation and experience. The research projects focused on areas particularly relevant to the economic impact of intellectual property on developing countries, analyzed the relationships between intellectual property and technology transfer, and focused on the protection of genetic resources and traditional knowledge.
1.2. Research Methodology This research included three kinds of research methodology as set out in 1.2.1 – 1.2.3.
1.2.1. Survey on Reforms toward IP-Based Economic Development Many developing countries have been working to improve their IP systems through various measures including the implementation of the TRIPS Agreement and revisions to their national laws/regulations in line with the efforts made by WIPO and other international organizations toward harmonization of international systems. In this survey, major reforms that are expected to have an important influence on economic development were identified.
*
The views expressed in this report are those of the authors and do not necessarily reflect those of the WIPO Secretariat or any of its Member States.
[ Impact of the Intellectual Property System on Economic Growth ]
There is a strong demand for empirical data, verification and detailed information on possible impacts that the IP system might have on economic development, which will enable the above question to be answered.
10
Economic changes were specifically analyzed, comparing the situation before and after IP system reforms (see a) through e) below), and the significance of these changes was assessed. a) Trends in the numbers of application filings/registrations - (percentage changes in the numbers of application filings/registrations, the share of filings by major applicants, etc.). b) Changes in corporate activities - (R&D, sales, IP-related budgets, IP-related lawsuits, etc.). c) Trends in license agreements - (license fees, trends in the number of licensing agreements, technical balance of trade, etc.). d) Trends in domestic economies - (GDP, numbers employed, unemployment rates, etc.). e) Trends in investment by foreign capital corporations - (GDP, amounts of domestic investment, number of domestic investments, nationalities of foreign capital companies, etc.). (Note) The economic effects resulting from the use of an IP system were analyzed from the perspectives of the national economy and by area of technology.
1.2.2. Case Studies on Companies utilizing the IP System to Develop Business or Increase Economic Activity
[ Impact of the Intellectual Property System on Economic Growth ]
For the IP-related reforms defined as having a major impact on economic development at the country level, case studies were conducted by area of business activity. Based on specific case studies, economic effects brought about by the IP system were examined. To gather information about each case, the corporations participating in the survey were interviewed and a questionnaire was sent to them. In this survey, changes in corporate activities were analyzed by comparing the situations before and after IP system reforms (see a through c below), and the significance of these changes was assessed. a) Trends in the numbers of application filings/registrations - (percentage changes in the numbers of application filings/registrations, etc.). b) Changes in corporate activities - (R&D, sales, IP-related budgets, IP-related lawsuits, etc.). c) Trends in license agreements - (license fees, trends in the number of licensing agreements, technical balance of trade, etc.). (Note) Three to four target corporations were chosen from among the top 10 applicant companies in each country. The economic effects resulting from the use of the IP system were analyzed from the perspectives of the national economy and by area of technology.
1.2.3. Analysis of Reforms that exerted Influence on Economic Development underpinned by the IP System using Economic Models
Impact on IP Creation
11
For the IP-related reforms defined as having a major impact on economic development in Item 1 above, an experimental analysis of each area of technology using an economic model was conducted. Based on the results of the analyses, IP-creating effects were examined. While noting the changes in situation before and after IP-related reforms, using such economic indexes as R&D, GDP and the IP index of each technological field as explaining variables, the effects of such reforms on IP-creating effects (explained variable) were analyzed. i) Impact on Intellectual Property Creation ln(Number of patents obtained) = γ1*lnA+ γ2*lnB+γ3*ln(IP index by the field of technology)+ε (Note) A: R&D, B: GDP A similar analysis was conducted, not only for the number of patents obtained but also for other factors such as licensing revenue. Current IP policies could be quantitatively and accurately assessed by centering on certain technological fields. The economic effects resulting from the use of IP systems were analyzed from the perspectives of the national economy and by area of technology.
Impact on Economic Effects of Business Activities
While noting the changes in situation before and after IP-related reforms, using such economic indexes as private capital, labor force and IP index as explaining variables, the effects such reforms had on domestic production (explained variable) were analyzed. i) Impact on the Economic Effects of Business Activities ln(domestic production) =β1*lnK+ β2*lnL + β3*ln(IP index of the country) +ε (Note) K: Private capital, L: Labor force A similar analysis was conducted, not only for domestic production but also for IP production, number of IPRs and licensing revenue obtained. Based on the above formula, the result showed that by raising the IP index of the country by x domestic production could be increased by y. The current IP policies could be quantitatively and accurately assessed. (Note) The economic effects resulting from the use of the IP system were analyzed from the perspectives of the national economy.
[ Impact of the Intellectual Property System on Economic Growth ]
For the IP-related reforms defined as having a major impact on economic development at the national level, an experimental analysis was conducted using an economic model. Based on the experimental analysis, the economic effects were examined.
12
Impact on Foreign Direct Investment (FDI) For the IP-related reforms defined as having a major impact on economic development at the national level, an experimental analysis was made using a direct investment model. Based on the results of this analysis, the effects such reforms had on FDI were examined. While noting the changes before and after IP-related reforms and using such economic indexes as GDP, population and IP index as explaining variables, the effects such reforms had on creating effects (explained variable) were analyzed. i) Impact on FDI In(FDI)=δ1*lnP+ δ2*lnQ+γ3*ln(IP index)+ε (Note) A: GDP, B: population (Note) The economic effects resulting from the use of the IP system were analyzed from the perspectives of the national economy. General Points and Assumptions Such variables as the number of patents obtained, FDI, GDP and population used for (1) impact on IP creation, (2) impact on business activities and (3) impact on FDI, changed at a constant rate over the year surveyed. In conducting the analyses, such changes were taken into account. The surveys conducted covered such industries as pharmaceuticals, automobiles, information technology (IT) and manufacturing.
[ Impact of the Intellectual Property System on Economic Growth ]
2. Results of the Research 2.1. Survey on Reforms toward IP-Based Economic Development General Remarks The trend in the filing of patent applications is very similar to other trends involving some economic data such as GDP, R&D expenditures and FDI in many countries (China, India, Japan, Korea, Malaysia and Vietnam). These data suggest that IP creation is closely related to economic effects. After the reform of the IP system, some economic data such as GDP, R&D expenditures and FDI greatly increased in many countries (China, India, Japan, Korea, Malaysia and Vietnam). These data suggest that the IP system is closely related to economic effects. After signing up to IP-related treaties such as TRIPS, some economic data such as GDP, R&D expenditures and FDI greatly increased in many countries (China, India, Korea, Malaysia and Vietnam). These data suggest that the signing of IP-related treaties is closely related to economic effects. In the fields of chemistry, pharmaceuticals and biotechnology, the introduction of patent systems for substances has had an effect on the number of patent applications or certain economic data such as trade in technology and R&D expenditures in some countries (India, Japan, and Korea).
In the case of universities, the introduction of the IP system or IP policy for universities has had an effect on the number of patent applications or certain economic data such as technology transfer in some countries (Japan and Malaysia).
13
China After signing up to TRIPS in 2001, the IP Index went up, and the number of patent applications greatly increased, and this is likely to have been as a result (Figs 2 and 3 in the Chinese National Report). The numbers and the trend of domestic patent applications are almost the same as those for patent applications from foreign countries. This suggests that TRIPS is also effective for domestic IP creation in China. GDP and R&D expenditures have greatly increased since 2001, considered to be as a result of TRIPS (Figs 1 and 7 in the Chinese National Report). The trend in patent applications has been very similar to that for GDP and R&D expenditures since 1990, which suggests that these are closely related to IP creation (Figs 1, 3 and 7 in the Chinese National Report).
The second revision of Indian patent law in compliance with TRIPS was in 2002 and this extended the term of a patent right. R&D expenditures and GDP have increased more sharply since 2003, which reflects the impact of the IP system on the economy (Figs 1 and 6 in the Indian National Report). The number of patents granted has greatly increased since 2003, and the number of domestic patents granted outstripped the number of patents granted to foreign applicants for the first time in 2004-2005. It suggests that TRIPS is also effective in domestic IP creation (Fig. 5 in the Indian National Report). The third revision of Indian patent law in compliance with TRIPS was in 2005 and this introduced a patent system for substances. The number of patent applications has greatly increased in India since 2005 (Fig. 2 in the Indian National Report). This suggests that the introduction of the patent system for substances has had an effect on IP creation. The trend in patent applications has been very similar to that for R&D expenditures since 1999, which suggests that R&D is closely related to IP protection (Fig. 6 in the Indian National Report). Japan After the introduction of a patent system for substances in 1975, R&D expenditures and trade in technology as well as the number of patents granted began to increase sharply in the pharmaceutical industry (Figs 3, 4 and 5 in the Japanese National Report). These data suggest that the IP system is closely related to IP creation and economic effects in the pharmaceutical field. After the introduction of the Technology Transfer Promotion Act promoting Technology Transfer from Universities to Industry in 1998, the benefits gained by universities from patent licensing as well as the
[ Impact of the Intellectual Property System on Economic Growth ]
India After signing up to TRIPS in 1995, Indian patent law has been revised three times in compliance with its provisions. The first revision in 1999 introduced Exclusive Marketing Rights for the patent holders of drugs or medicines. The number of patent applications has greatly increased in India since then: it stood at 4,924 in 1999-2000 and 8,503 in 2000-2001 (Fig.2 in the Indian National Report).
14
number of patent applications filed by universities began to increase more sharply (Figs 6 and 7 in the Japanese National Report). These data suggest that the IP system is closely related to IP creation and economic effects in the field of technology transfer. IP policy has advanced rapidly in Japan since 2002. The Basic Law on Intellectual Property, enacted in 2002, has had a significant impact on Japanese industry because it formed the basis for the Intellectual Property Strategy Headquarters, established in 2003, and for the Intellectual Property Strategic Program, revised annually since 2003. The competitiveness ranking of Japan among the nations of the world greatly increased after 2002, which reflects the impact of the Basic Law on Intellectual Property on the Japanese economy (Fig. 8 in the Japanese National Report). Korea After the introduction of the patent system for substances in 1986, the number of patent applications increased more sharply than before, rising from 12,759 in 1986 to 17,062 in 1987. Afterwards, it rose again by approximately 2,000 to 3,000 every year until 1993 (Fig. 1 in the Korean National Report). These data suggest that a correlation exists between the IP system and IP creation in the pharmaceutical field. After signing up to TRIPS in 1995, the number of patent applications increased more sharply than before, rising from 45,712 in 1994 to 90,326 in 1996 (Fig. 1 in the Korean National Report). Also, since 1995, the number of domestic patent applications in Korea has increased to a greater extent than those from foreign countries (Fig. 2 in the Korean National Report). These data suggest that TRIPS has had an effect on domestic IP creation.
[ Impact of the Intellectual Property System on Economic Growth ]
FDI greatly increased from 1,316,505 US dollars in 1994 to 15,544,618 US dollars in 1999 (Fig. 5 in the Korean National Report). This suggests that TRIPS has had an effect on FDI as well as on IP creation. Since 1980, the trends in R&D expenditures and GDP have been very similar to those for patent applications, which suggest that R&D and GDP are closely related to IP creation (Fig. 1, 3 and 6 in the Korean National Report). Malaysia Since the implementation of a domestic patent registration system in 1986, the number of patent applications has been steadily increasing (Fig. 5 in the Malaysian National Report). This suggests that the IP system is closely related to IP creation. After the introduction of a modified substantive examination in 1993, the number of patent applications dramatically increased (Fig. 5 in the Malaysian National Report). This suggests that IP practice is closely related to IP creation. After signing up to the Paris Convention in 1990, the number of patent applications and GDP greatly increased (Fig.12 in the Malaysian National Report). This suggests that the Paris Convention has had an impact on IP creation and economic growth. After signing up to TRIPS in 1995, the number of patent applications and expenditure on R&D greatly increased (Figs 3 and 10 in the Malaysian National Report). This suggests that TRIPS has had an effect on IP creation and R&D.
The patent law was revised in 2000 in compliance with TRIPS. Thereafter, royalties dramatically increased from 2002 to 2005, considered to have been as a result (Fig. 4 in the Malaysia National Report).
15
Since the implementation of the National Science and Technology Policy in 1995, the number of patent applications from local universities and research institutions has shown a huge increase (Fig. 11 in the Malaysian National Report). This suggests that this policy is closely related to IP creation in Malaysian universities. Since 1980, the trend in GDP has been very similar to that for the number of patent applications. These decreased during the years of economic recession in 1986-1987 and 1997-2000 (Fig.10 in the Malaysian National Report). This suggests that the IP system is closely related to economic growth. Vietnam After the introduction of IP-related provisions in the Civil Law in 1995, the number of patent applications increased more sharply than before (Fig. 4 and Table 1 in the Vietnamese National Report). In 1995, gross industrial output increased more sharply than before (Fig. 3 in the Vietnamese National Report). These data suggest that the IP system is closely related to IP creation and economic growth. After the introduction of the Intellectual Property Law in 2006 and signing up to TRIPS in 2006, the number of patent applications greatly increased, especially from 2005 to 2006; FDI also greatly increased during this period. These data suggest that the new IP law and TRIPS have had an effect on IP creation and FDI.
2.2. Case Studies on Companies utilizing the IP System to Develop Business or Increase Economic Activity General Remarks In the pharmaceutical field, the number of patent applications is greatly increasing in some countries as a result of TRIPS (China, India, Korea, and Malaysia). Certain major companies, such as Takeda in Japan and Ranbaxy in India, have been very successful in this field. Takeda have been very active in IP management and Ranbaxy has also applied for some useful patents. In the IT field, the number of patent applications is greatly increasing in some countries as a result of TRIPS (China, India, Korea, and Malaysia). Certain major companies, such as Sony in Japan and Samsung in Korea, have been very active in IP management and have grown in size. In the manufacturing field, the number of patent applications is greatly increasing in some countries as a result of TRIPS (China, Korea, and Malaysia). Certain major companies, such as Canon in Japan and Duy Loi in Vietnam, have been very successful in this field. Canon has traditionally placed a high priority on IP creation and Duy Loi has been active in IP management. In the automobile field, the number of patent applications is greatly increasing in some countries as a result of TRIPS (China, Korea, and Vietnam). Certain major companies, such as Toyota in Japan and Hyundai in Korea, have been active in IP management and have grown in size.
[ Impact of the Intellectual Property System on Economic Growth ]
Since 1995, the trends in GDP and gross industrial output have been very similar to those for patent applications (Figs 1 and 3 in the Vietnamese National Report). This suggests that GDP and gross industrial output are closely related to IP protection.
16
The Pharmaceutical Industry China The number of patent applications and level of expenditure on R&D in the pharmaceutical field have greatly increased since 2001 when China joined TRIPS (Fig. 5 in the Chinese National Report). This is considered to be as a result of TRIPS. The North China Pharmaceutical Group Corporation (NCPC) is representative of the pharmaceutical field in China. The number of NCPC’s patent applications is not as high as that of companies in other major fields such as IT and automobiles. However, the number of patent applications has increased dramatically since 2001 when China joined TRIPS. R&D has also increased since 2001 (Figs 11 and 12 in the Chinese National Report). This suggests that TRIPS has had an impact on IP creation and R&D. India The pharmaceutical industry today is the top-ranked science-based industry in India with wide-ranging capabilities in the complex field of drug manufacture and technology. The patent system is expected to be very important for the industry.
[ Impact of the Intellectual Property System on Economic Growth ]
Ranbaxy and Dr. Reddy’s Laboratories are representative of the pharmaceutical field. These two companies have applied for many patents; i.e. 259 patent applications by Ranbaxy and 205 patent applications by Dr. Reddy’s Laboratories between 1995 and 2005 (Section 3.2.1 in the Indian National Report). Intellectual property has been one of the most important factors for the current success of these two companies. Since 1995, Ranbaxy and Dr. Reddy’s Laboratories have spent heavily on R&D and received high revenues as well as making numerous patent applications. This suggests that TRIPS has had an effect on economic growth as well as on the creation of intellectual property in these companies (Section 3.2.1 in the Indian National Report). Japan Major companies in the Japanese pharmaceutical field are not as large as those in the fields of manufacturing and automobiles. However, some companies have grown through mergers and acquisitions. The number of patent applications in the biotechnology field has increased since around 1997, when the Examination Guideline for Biology-Related Inventions was issued by the Japan Patent Office. This suggests that the use of intellectual property enhances its creation. Five major companies in the pharmaceutical field were the focus of this study. The royalties of these five companies has increased since around 1999. Recently, Japanese IP policy has placed a higher priority on the utilization of patents than simply filing patent applications. This trend in royalties in the pharmaceutical field seems to have been created by Japan’s recent IP policy (Fig.10 in the Japanese National Report). Takeda Pharmaceutical Company Limited is one of the IP-based companies in the pharmaceutical field. The technological level in this field is changing rapidly because biotechnology plays an important role in the development of new medicines. Takeda is applying for patents in the field of biotechnology in order
to develop new biotechnology-related medicines. The company has combined its IP and R&D divisions in order to plan its IP strategy effectively. It has advanced the cause of strategic patent applications and the utilization of IP, which has provided high royalties to Takeda. Intellectual property has been one of the most important factors in the company’s current success.
17
Korea Since the introduction of the patent system for substances in 1986, the number of patent applications in the chemical field has constantly increased. Since the introduction of the Examination Guideline on Biotechnology by the Korean Intellectual Property Office in 1998, the number of patent applications in the chemical field has greatly increased. These data suggest that the IP system enhances IP creation (Fig. 7 in the Korean National Report). Dong-A and Yuhan corporations are representative of the pharmaceutical field in Korea. They have consistently applied for patents over several years, although the number of patent applications filed has been low. Their filing activities were constant even during the IMF crisis and their R&D expenditure also gradually increased over several years in the same way. Data suggest that pharmaceutical companies such as Dong-A and Yuhan are placing a high priority on intellectual property and R&D in their management strategy (Fig. 9 and 10 in the Korean National Report).
Hovid Berhad is representative of the pharmaceutical field. The company is active in the development and manufacture of pharmaceutical specialties. It has applied for patents not only in Malaysia but also in other countries, although the number of patent applications has not been high. In 2006, applications for two different inventions were filed, one in 19 foreign countries and the other in 11 foreign countries. Hovid Berhad’s IP strategy has been very international (Table 4 in the Malaysian National Report). Intellectual property has been one of the most important factors for the company’s current success. Vietnam R&D capacity is weak in the pharmaceutical field and most technology is imported although there are about 170 companies producing allopathic medicines and about 300 producing traditional medicines. Therefore, IP activities are mainly concerned with trademarks and industrial designs but not patents. Traphaco is representative of the pharmaceutical field and produces about 170 products, including 60 traditional medicines and 110 allopathic medicines, their traditional medicines being their best locallyknown products. The company has used IP protection since the late 1990s, and in 2006 made a total of 113 applications relating to intellectual property (Table 2 in the Vietnamese National Report). One of the reasons for Traphaco’s success must be its IPRs.
[ Impact of the Intellectual Property System on Economic Growth ]
Malaysia The highest number of patents granted in major fields has been in the pharmaceutical sector. The rate of growth has been phenomenal, from a mere 10 patents in 1989 to 321 in 2006 (Fig. 8 in the Malaysian National Report). Domestic investment in this field increased from 1996 to 2005; and this is considered to be the result of the introduction of a “purpose bound product claim” in 1993.
18
The Information Technology Industry China The number of patent applications and expenditure on R&D has greatly increased in the IT field in China since 2001 when China joined TRIPS (Fig. 6 in the Chinese National Report). This is considered to be as a result of TRIPS. The trends in patent applications and R&D expenditures were similar in the IT field in China, which suggested a high correlation between R&D and IP protection. Huawei Technologies is representative of a IT field. The number of its patent applications has increased since 2001 when China joined TRIPS (Fig. 9 in the Chinese National Report). Huawei’s revenue has greatly increased since 2001 although its net income is increasing more slowly (Fig. 10 in the Chinese National Report). India The IT industry in India is recognized globally and it is a leading Indian science-based industry. Every effort is being made by industry and government to safeguard this situation in a manner conducive to respecting the IPRs of others and exploiting their own intellectual property.
[ Impact of the Intellectual Property System on Economic Growth ]
Wipro is representative of the IT field. It is active in the areas of patent application and R&D. The company has achieved significant global sales and high revenues as well as making multiple patent applications since 1995. This suggests that TRIPS has had an effect on economic growth as well as the creation of IP in Wipro (Table 4.1 in the Indian National Report). Japan Five major companies in the IT and manufacturing sectors were the focus of this study. The royalties of some major IT companies have increased since around 1999. Recent Japanese IP policy has placed a higher priority on the utilization of patents than on applying for them. This trend in royalties seems to have been affected by recent national IP policy decisions (Fig.11 in the Japanese National Report). Sony is one of the IP-based companies in this field. Economic growth has been very high because of the diffusion of digital technology. The company is actively utilizing intellectual property and selecting its IP strategy from self-utilization, licensing and cross-licensing in certain cases: recently, Sony collaborated with Samsung in the utilization of intellectual property. Sony’s IP strategy includes a so-called “patent portfolio”, which has been applied to its Organic ELectroluminescence (EL) display. This strategy also includes a so-called “patent pool” because many different patents tend to be included in one product. Intellectual property has been one of the most important factors in the company’s current success. Korea Information technology is one of the fastest developing fields. The number of patent applications in the sector has been significantly increasing for the past several years (Fig. 8 in the Korean National Report). The figures for R&D and sales show similar trends to those for patent applications (Fig. 11 in the Korean National Report). These data suggest that there is a relationship between IP creation and economic growth. Samsung Electronics is representative of the IT field in Korea. The number of patent applications by the company has increased, mainly since 1994, although it decreased from 1998 to 2000, which seems to have been the result of the IMF crisis. Expenditure on R&D by Samsung also decreased at one point and
has now increased again (Fig. 12 and 13 in the Korean National Report). These data suggest that there is a relationship between IP creation and R&D.
19
The number of patent applications and level of expenditure on R&D by Samsung Electronics have recently been increasing, suggesting that a close relationship exists between patent applications and R&D (Fig. 12 and 13 in the Korean National Report). These data suggest that intellectual property and R&D make up one of the most important factors for Samsung’s current success. Malaysia A sudden spurt in the growth of patent grants in the IT industry was seen in 2006. From a mere two patents in 1990, this grew by 500 per cent to 101 patents in 2006, the increase being apparent from 1998 onwards (Fig. 10 in the Malaysian National Report). This phenomenon could be attributed to the special measures adopted by the government to boost development of the IT industry, particularly the establishment of the Multimedia Super Corridor and to the increase in funding of R&D on IT-related projects. FTEC is representative of computers and peripherals and the ICT software sub-sector in the IT field. As an assembler, trademarks are more important to the company than patents (Table 2 in the Malaysian National Report). Telekoms Malaysia Berhad and Motorola Malaysia are representative of the telecommunication sub-sector and these companies have already obtained some patents. In terms of numbers of IP applications, Telekoms outstrips other local companies, not only in the area of patents, but also in trademarks and industrial designs (Table 3 in the Malaysian National Report). These companies have applied IP protection and have become successful.
China Xuzhou Construction Machinery Group (XCMG) is representative of the manufacturing field in China. They have applied for patents mainly since 2001 when China joined TRIPS. The number of patent applications is not as high as in other fields such as IT and automobiles, which means that XCMG is not strong enough to innovate. Japan Five major companies in the IT and manufacturing fields were the focus of this study. Royalties earned by the companies involved in manufacturing have increased since around 1999 and IP policy has changed more to the value of utilizing patents than obtaining them. This trend in royalties seems to have been a result of recent IP policy (Fig.11 in the Japanese National Report). Canon is an IP-based company, manufacturing precision instruments. It is one of the companies which has applied many patents in this field and has traditionally placed a high priority on intellectual property in its culture and it has encouraged researchers to apply for patents as well as producing scientific reports: the sector has been closely linked with that of R&D. Management of intellectual property has been one of the most important factors in Canon’s current success. Korea The number of patent applications in the manufacturing field is increasing although the growth of patent applications is not as high as that for IT (Fig. 8 in the Korean National Report).
[ Impact of the Intellectual Property System on Economic Growth ]
The Manufacturing Industry
20
Doosan Infracore is representative of the manufacturing field. The number of its patent applications has increased since 1994 although it decreased from 1997 to 2000, which seems to have been the effect of the IMF crisis. Doosan’s expenditure on R&D decreased at one point but has now increased again, and this is consistent with the curve for patent applications. These data suggest that there exists a relationship between IP creation and R&D. Malaysia Manufacturing remains a major sector as can be seen by the number of patent grants: in 2006, a total of 61 patents were issued in this sector, amounting to 0.9 per cent of the total number of patents granted (Fig. 8 in the Malaysian National Report). Favelle Favco Berhad, involved in the manufacture of customized offshore lifting gear and construction tower cranes and Cooper Cameron Sdn Berhad, involved in the manufacture of oil and gas pressure control equipment, are representative of this field. Neither company owns patents in Malaysia, relying mainly on the law governing trade secrets.
[ Impact of the Intellectual Property System on Economic Growth ]
Vietnam There are two companies which are aware of IP issues in the manufacturing field (Table 2 in the Vietnamese National Report). Duy Loi, whose main product is a hammock, is very successful in the domestic market and also exports to Australia, Korea, Japan and the US. Duy Loi uses a law consultancy for IP related issues although it is a small company. It has applied for some IP protection and has been successful in two lawsuits in Japan and the US relating to industrial design infringement. Intellectual property has been one of the major factors in Duy Loi’s current success. Sannam, whose main products are metal working machines and equipment, is a very successful company in this field. Intellectual property has been one of the main factors in its current success. The company is aware of IP issues, and it uses a law consultancy for IP-related issues. Sannam has applied for much IP protection, and intellectual property has been one of the major factors in its current success.
The Automobile Industry China China First Automobile Works Group Corporation (FAW) is representative of the automobile industry in China. The number of patent applications made by FAW has increased since 2001 when China joined TRIPS. FAW’s profits have also increased and the reason for this is thought to be that it has obtained IP mainly for defensive purposes. Japan Five major companies in the automobile industry were the focus of this study. Expenditure on R&D has increased since around 1999. This means that much new technology has been created in this field. Companies have been consistently applying for patents due to the aggressive nature of creation and innovation in the industry (Fig.12 in the Japanese National Report). Toyota is one of the IP-based manufacturers in the automobile industry. Its patent applications are of high quality, and this trend is very stable: expenditure on R&D shows the same trend as patent applications. Toyota’s IP strategy includes a so-called “patent portfolio”, which has been applied to many models as
they are made up of many types of intellectual property. Toyota selects specific fields through analyzing current trends in patent application and R&D is then concentrated in these areas. Intellectual property has been one of the most important factors in Toyota’s current success.
21
Korea Hyundai is representative of the automobile field. The number of patent applications by the company has increased since 1995 and seems to have been as a result of TRIPS. Hyundai appears to have been affected by the IMF crisis as the number of patent applications decreased around this time (Fig. 12 and 13 in the Korean National Report). The number of patent applications and level of expenditure on R&D by Hyundai are increasing in parallel at present, which suggests a close relationship between the two (Fig. 12 and 13 in the Korean National Report). These data suggest that intellectual property and R&D form one of the major factors in Hyundai’s current success. Malaysia The number of patent grants for the automobile industry was negligible and sporadic. The total number of such patents from 1996-May 2007 amounted to only nine (Fig. 8 in the Malaysian National Report).
Vietnam The motorcycle market in Vietnam has grown briskly since 1999. Between 1999 and 2002, the market grew almost six fold. Measured by the number of vehicles produced, Vietnam now ranks eighth in the world’s motorcycle market. The automobile sector, including the motorcycle market is the most active for IP issues in Vietnam, and the industry is growing. Vietnam Honda was established in 1996 and started operating in 1997: equity ownership is 100 per cent Japanese. The number of its applications for intellectual property such as patents, industrial designs and trademarks has been much higher than that from other companies in other fields (Table 2 in the Vietnamese National Report). Vietnam Honda has applied for many types of intellectual property and this has been one of the most important factors in its current success.
2.3. Analysis of Reforms that exerted Influence on Economic Development underpinned by the IP System using Economic Models General Remarks Many positive results have been reported relating to the impact on IP creation (China, India, Japan, Malaysia, and Vietnam). According to these results, the positive impact of the IP system on IP creation has been comprehensively proven. Some positive results were also reported relating to the impact on the economy (China, Malaysia, and Vietnam): however, some showed less positive results (India and Korea). According to these, the impact of the IP system on the economy has only been partially proved.
[ Impact of the Intellectual Property System on Economic Growth ]
Proton is representative of the automobile field and has made several applications for patents, both locally and overseas. However, it has filed vastly more applications for trademarks and industrial designs both inside and outside the country (Table 4 in the Malaysian National Report).
22
One positive result relating to the impact on FDI (Malaysia) was reported: however, some reports show less positive results (India, Korea and Vietnam). China In relation to the impact on IP creation, patent grants were positively related to the IP index as well as to GDP. In relation to the impact on the economy, GDP is positively related to the IP index as well as to national investment in fixed assets. The relationship between the IP system and selected data related to IP creation and economic growth has been quantitatively demonstrated by these data (Tables in section 4 of the Chinese National Report). India In relation to the impact on IP creation, it has been shown that “patents obtained” and “patents applied” are positively related to the IP index as well as to R&D and GDP (Table 4.1 in the Indian National Report). The relationship between the IP system and IP creation has been quantitatively proven from these data. As to the impact on the economy, it has been shown that GDP was positively related to capital and labor but not to the IP index (Table 4.2 in the Indian National Report).
[ Impact of the Intellectual Property System on Economic Growth ]
As to the impact on FDI, it has been shown that FDI was positively related to GDP and population but not to the IP index (Table 4.5 in the Indian National Report). Japan Over the past seven years the number of patent applications filed annually in Japan has been stable; it is therefore difficult to conduct an economic analysis. However, the number of patent applications has been increasing in some local districts. Therefore, in the case of Japan, the economic analysis was focused on these local districts. IP applications were analyzed before and after the year that the IP strategic program for each district was introduced. A statistically significant increase was observed in the number of patent and trademark filings in the districts that formulated IP-strategic programs (section 4.3 of the Japanese National Report). Korea No statistically significant increase was observed (Tables.1, 2 and 3 in the Korean National Report). Further research is necessary to prove that a relationship exists between IP and economic growth, including certain approaches such as revising the economic models and finding more appropriate data. Malaysia As for the impact on IP creation, it was found that patent applications were positively related to the IP index as well as to private investment (Tables 6, 7 and 8 in the Malaysian National Report). The impact on IP creation was suggested in Figs 5 and 9, which were based on the data resulting from this analysis. As for the Impact on the economy, it was found that GDP is positively related to the IP index as well as to private investment (Tables 6, 7 and 8 in the Malaysian National Report). The impact on the economy was suggested in Fig.12, which was based on the data resulting from this analysis.
As for the Impact on FDI, it was found that this was positively related to the IP index as well as to GDP (Tables 6, 7 and 8 in the Malaysian National Report).
23
The relationship between the IP system and certain data related to IP creation, economic growth and FDI is quantitatively shown from these analyses. Vietnam As for the impact on IP creation, patent applications were shown to be positively correlated to the IP index as well as to FDI (section 4.1 of the Vietnamese National Report). As for the impact on the economy, GDP was shown to be positively related to the IP index as well as to private capital (section 4.1 of the Vietnamese National Report). The relationship between the IP system and selected data related to IP creation and economic growth has been quantitatively proven from these analyses.
3. Discussion and Proposal
Some major companies such as Huawei and China First Automobile Works Group Corporation have increased their number of patent applications since 2001 when China joined TRIPS. Their revenue has increased, but their profits have sometimes decreased. As for the economic analysis in China, patent grants were seen to be positively related to the IP index as well as to GDP. Moreover, GDP has been seen to be positively related to the IP index as well as to national investment in fixed assets. India In India, signing up to TRIPS in 1995 has been one of the most important reforms toward IP-based economic development. In order to comply with TRIPS, Indian patent law was revised three times, in 1999, 2002 and 2005. Since these revisions in patent law, the number of patent applications, R&D or GDP has increased. These data suggest that TRIPS played an important role in technological development and economic growth. Moreover, the number of patent applications has greatly increased since 2003, and the number of Indian domestic patent applications moved ahead of those from foreign countries for the first time in 2004-2005. This suggests that TRIPS is also effective in domestic IP creation. As for the case studies on companies, the trend in patent applications was similar to that for R&D expenditures. In the pharmaceutical and IT fields, some major companies have been active in these areas: however, this was not the case for many companies.
[ Impact of the Intellectual Property System on Economic Growth ]
China For China, signing up to TRIPS in 2001 was one of the most important reforms toward IP-based economic development as patent applications, GDP and expenditure on R&D have since greatly increased. This suggests that TRIPS has had an effect on China’s domestic economy.
24
As for the economic analysis, patents obtained and applied for were positively related to the IP index as well as to R&D and GDP. Other economic analyses such as GDP and FDA did not show a positive relationship to the IP index. Japan In the survey on reforms toward IP-based economic development, we focused on three measures: i) the introduction of the Patent System for Substances in 1975, ii) the introduction of the Technology Transfer Promotion Act in 1998 and iii) the enactment of the Basic Law on Intellectual Property in 2002. According to the data before and after the introduction of these measures, the number of patents granted or applied for, R&D expenditures, technology trades or licensing contracts greatly increased. This showed a possible relationship between the IP system and economic growth. It also suggests that the system has been one of the factors for high economic growth since the 1970s. In the case studies, we focused on four industries related to pharmaceuticals, information technology, manufacturing and automobiles. In the former, royalties of five major companies have increased since around 1999, which seems to have been the result of recent IP policy. Takeda is representative of the pharmaceutical field, and its IP strategy has been to put a higher priority on the utilization of intellectual property than on applying for it. In the IT and manufacturing industries, the royalties of five major companies have remained high or have increased since around 1999. Sony and Canon are representative of these fields and they have their own IP strategies such as a patent pool and cross-licensing. In the automobile industry, R&D expenditure has increased since around 1999, which suggested that new technologies were being aggressively created. Toyota is representative of the automobile industry, and a patent portfolio is part of its IP Strategy.
[ Impact of the Intellectual Property System on Economic Growth ]
In the economic analysis, a statistically significant increase was observed in the number of patent and trademark filings in the prefectures that formulated IP-strategic programs. Korea In Korea, signing up to TRIPS in 1995 was one of the most important reforms toward IP-based economic development. Since then the number of patent applications has greatly increased. Moreover, since then, the numbers of domestic patent applications have increased more sharply than those from foreign companies. These data suggest that TRIPS has had an effect on IP creation, especially domestic IP creation: FDI has also increased greatly since 1995, suggesting that TRIPS has also had an effect on this, As for the case studies, the number of patent applications and level of expenditure on R&D by Samsung and Hyundai have been increasing recently, which suggests a close relationship between patent applications and R&D. These data suggest that intellectual property and R&D must be two of the major factors in their current success. As for the economic analysis, the results were quite different from those expected. There was no positive result, one of the reasons being that the benefits of TRIPS have not appeared.
Malaysia In Malaysia, the effect of joining the Paris Convention in 1990 and TRIPS in 1995 led to very important reforms for IP-based economic development. Since joining the former, the number of patent applications and the rate of GDP have greatly increased. Since joining TRIPS the number of patent applications and level of expenditure on R&D have also greatly increased. The revision of the patent law in 2000 to comply with TRIPS was also a very important reform for IP-based economic development because royalties dramatically increased between 2002 and 2005. These data suggested a close relationship between IP-related treaties and economic growth. The country joined the Patent Cooperation Treaty (PCT) in 2006, and this is also expected to have an influence on its economic growth.
25
In the case studies, even major companies in major industries had not obtained many patents, and this is borne out by the cases of Favelle Favco Berhad and Cooper Cameron Sdn Berhad in the manufacturing industry. In the economic analysis, patent applications positively correlate to the IP index. Moreover, GDP and FDI showed a positive relation to the IP index.
In the case studies, applicants in the automobile industry tended to aggressively apply for IP, although this is different in other industries. In the economic analysis, patent grants were positively related to the IP index as well as GDP. Moreover, GDP was positively related to the IP index as well as to national investment in fixed assets. The relationship between the IP system and economic growth is quantitatively shown from these data and further research is expected to be conducted for other economic data such as FDI in order to demonstrate the economic impact more clearly.
[ Impact of the Intellectual Property System on Economic Growth ]
Vietnam The introduction of the Civil Code including IP-related provisions in 1995 has been one of the most important reforms toward IP-based economic development in Vietnam. The number of patent applications as well as GDP and FDI has increased significantly since 1995. This suggests a close relationship between the IP system and economic growth. Moreover, after the introduction of the Intellectual Property Law in 2006 and signing up to TRIPS in 2006, the number of patent applications greatly increased. This suggests that the introduction of this new law and joining TRIPS have had positive effects on IP creation.
Impact of the Intellectual Property System on Economic Growth
26
China Ping Zhang* 1. Introduction 1.1. Outline of China’s IPR System 1.2. Outline of China’s Economic Trends 2. Survey on Reforms in China’s IPR law and the Economic Trend 2.1. Summary History of China’s IPR Laws and Policies 2.2. IPR Law Reforms and Economic Trends 2.3. Results of the Analysis 3. Case Studies on Selected Companies’ Utilization of the IP System 3.1. Comparison of Selected Companies’ Data in Major Industry Fields 3.2. Results of the Analysis 4. Model Analysis of the Impact of Reforms on Economic Development 4.1. Establishing the Economic Models 4.2. Results of the Analysis 5. Discussion and Proposal References
1 Introduction
[ Impact of the Intellectual Property System on Economic Growth ]
1.1. Outline of China’s IPR System Intellectual property protection was and is playing an important role in China’s ongoing open-door policy and economic reforms, which began in the late 1970s. The past three decades have witnessed dramatic changes in IPRs both in terms of the national IPR law system and membership of international treaties. Step-by-step, China has signed up to almost all the important international IPR treaties, and, inter alia, is a member of the WIPO Convention, the Paris Convention for the Protection of Industry Property and the Berne Convention for the Protection of Literary and Artistic Works. With its accession to the WTO in 2001, China’s IPR system was brought into line with the Agreement on Trade-Related Aspects of Intellectual Property Rights (TRIPS). On June 9, 2007, the WIPO Copyright Treaty (WCT) and the WIPO Performances and Phonograms Treaty (WPPT) came into force in China. With its entry into a variety of international IP treaties, China has been incorporating international IP rules and has formed its own IPR system. Though there is no official IP code, IPRs are codified by laws and mainly complemented and supplemented by related regulations, judicial interpretations, administrative measures and local regulations or measures which vary, depending on the competent bodies that promulgate them. Among the basic IPR laws, enacted and revised by the Standing Committee of the National People’s Congress, are laws relating to patents, trademarks, copyright and unfair competition. IPR regulations, promulgated by the State Council, can either supplement IPRs, or implement relevant IPR laws. The most important regulations include those on protection of computer software, new plant varieties, layout-design of integrated circuits and the right of communication through the information network, etc. The Supreme Court is empowered to apply the law and to issue judicial interpretations, e.g., on the application of the law in patent trials, trademark disputes and copyright. Administrative *
The able assistance of Huaiwen He is gratefully acknowledged. The views expressed in this report are those of the authors and do not necessarily reflect those of the WIPO Secretariat or any of its Member States..
organs may also issue IPR measures which deal in detail with IPR prosecution, protection or enforcement. Apart from these, the criminal and civil codes, like the General Principles of Civil Law and Contract Law, also provide for IPR protection. Taken together, they form China’s IPR system which is regularly updated in line with its international trade policy.
27
1.2. Outline of China’s Economic Trends
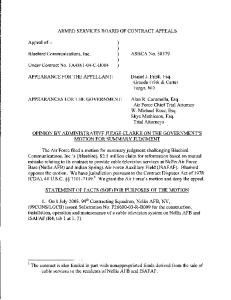
Fig.1. China’s GDP Indices by Year 1978-2005 Base Year 1978 =100, Calculated by Constant Price However, challenges remain. Despite the huge growth in GDP and dramatic IPR reforms, the economy is still mainly locked in traditional low-skilled, labor-intensive industries. China is now formulating its national IPR strategy in an attempt both to confront IPR pressure from main trade partners and to enjoy the possible benefit of TRIPS-level IPR protection as a developing country. It is clear that knowledge about the relationship between IPR reforms in China and its economic growth is invaluable in building confidence in its IPR system and for future policy-making. Thanks to WIPO’s progressive project, The Impact of the Intellectual Property System on Economic Growth, we have been encouraged to explore such a relationship in an evidence-based manner. In the following sections, taking account of space considerations, we will briefly review China’s IPR reforms, focusing on patent laws; second, we will survey industries and companies for data to evaluate the impact of these reforms on the economy; third, we will analyze the data by using the simple economic model given and, finally, we will discuss and make proposals.
[ Impact of the Intellectual Property System on Economic Growth ]
With 30 years of gradual economic reforms, China has been opening its economy to international trade and investment and has seen fast economic growth: a nearly nine-fold increase in GDP per capita since 1978. Notably, GDP has grown by an average of 10 per cent per year since the 1990s (see Fig. 1).
28
2. Survey on Reforms in China’s IPR Law and the Economic Trend 2.1. Summary of the History of China’s IPR Laws and Policies China’s modern IPR law was drawn up in the 1980s and its main IPR laws, such as the patent, trademark and copyright laws and the law against unfair competition have been regularly updated. These updates form an important component of China’s open-door policy and contribute to China’s commitment to an international trade system. In effect, China’s domestic IPR legislation often foreshadows the signing of international treaties. On August 3, 1982, a trademark law was enacted as China’s first modern IPR law and it came into effect on March 1, 1983. A year later, China’s first patent law was enacted and two years later, the Paris Convention entered into force. Similarly, China's first copyright law came into effect approximately one year before China acceded to the Berne Convention. Recently, the Regulation on the Right of Communication through the Information Network, promulgated in July 2007, foreshadowed China’s entry into the WCT and WPPT. IPR laws are often reformed in conjunction with China’s policy on foreign trade. The patent and trademark laws were both revised at the beginning of the 1990s in support of China’s attempt to accede to GATT. They were revised once more at the start of the 21st century, together with the first amendment to the copyright law, to support China’s bid to enter the WTO in 2001. Around the same time, the Supreme Court successively issued important judicial interpretations regarding the application of the law in IPR trials as mentioned above.
[ Impact of the Intellectual Property System on Economic Growth ]
These are just some examples which demonstrate that the motivation for China’s IPR reform was to serve its broader policy: that of opening up the national economy. IPR law reforms were not driven by internal pressure for protection, but rather by external pressure that required strengthened IPR protection. In China’s case, the only reform of IPR law or policy toward IP-based economic development would be following the national IPR strategy, which began in 2005 and is still evolving. However, even this strategy was mainly motivated by widespread concerns arising from China’s increasing IPR conflict with its main trade partners.
2.2. IPR Law Reforms and Economic Trends 2.2.1. Patent Law Reforms Evaluating the impact of the IPR system on national economic growth entails measuring IPR protection. For this report, the Ginarte-Park Index of Patent (G&P Index) has been used as an indicator for IPR protection. The following explanation thus focuses on those patent law reforms that are used for calculating the Index. Please note that unless otherwise indicated, “patent” in this report refers only to patents on inventions and does not cover utility models or industrial designs, which are both classified as “patent” under Chinese law.
Limits of Patentability Patentability has been expanded through revisions of the patent law. Under this 1984 law, the following were excluded from patent protection: foods, beverages and condiments, pharmaceutical products and substances obtained by means of a chemical process. However, processes used in producing chemical compounds might be granted a patent. The limits of the 1992 law on patentability were greatly relaxed,
leaving only the following matters outside patent protection: rules and methods for mental activities; methods for diagnosis and treatment of disease; animal and plant varieties and substances obtained by means of nuclear transformation. Nevertheless, it should be noted that plant varieties are protected by the Regulations on the Protection of New Varieties of Plants promulgated in 1997.
29
Scope of Protection The scope of patent protection was extended under the 1984 Patent Law, “without authorization, no individual or entity may make, use, sell the patented product, or use the patented process, for production or business purposes”. In the 1992 amendment, patent holders were granted the exclusive right to import, both with regard to patented products and products directly obtained by the patent process. Further, the right of “offer for sale” was added by the 2000 revision.
Term of Protection The term for patent protection was extended by the reform. Under the 1984 Patent Law, the term for an invention patent was15 years, running from the date of filing of the application: for utility models or industrial designs it was five years, with a possible three-year extension. Through the 1992 revision, the term for an invention patent was extended to 20 years, for a utility model or industrial design to 10 years.
Preliminary Injunction A preliminary injunction was absent in the 1984 and 1992 patent laws and there were no relevant provisions for this under the PRC Civil Procedure Law. This deficiency was remedied by Article 61 of the 2000 Patent Law, which provides that under certain circumstances, rights holders may, before any legal proceeding is instituted, request the People's Court to order the suspension of litigious acts and the preservation of property.
Under current patent law, the Patent Reexamination Board is the only mechanism available to declare a patent invalid after its grant. However under the 1984 law, there was a pre-grant opposition procedure, which was often used by competitors to prolong the examination, rendering the prosecution process inefficient. Therefore, the 1992 revision replaced this pre-grant opposition with post-grant opposition. Although this reform shortened the examination process by six to10 months (depending on the type of patent), there was unfortunately an overlap between the revocation and invalidation procedures, resulting in the 2000 Patent Law abolishing the revocation procedure.
2.2.2. G&P Index, Patent Application and Grant and R&D Trend G&P Index Although the reforms mentioned above are important for calculating the G&P Index, we did not confine our view to patent law. Rather, the scope of our examination, as required by the categories and scoring method for calculating the Index, cover civil law, civil procedural law, and detailed rules for implementation of the patent law, the patent examination guidelines, judicial interpretation and other related legal instruments. Our result is given in Fig. 2, which shows that China’s patent protection law has been strengthened over time.
[ Impact of the Intellectual Property System on Economic Growth ]
Revocation and Invalidation Procedure
30
Fig. 2. China’s Ginarte-Park Index of Patent 1985-2006 Authors’ Calculation
Patent Application and Grant Trends
[ Impact of the Intellectual Property System on Economic Growth ]
Over the past decades, especially since 2001, China has witnessed a huge increase in invention patent applications and grants. Domestic filings outstripped foreign filings in 2003, and the difference between domestic and foreign grants has grown ever wider (see Figs 3 and 4).
Fig. 3. China’s Invention Patent Applications Filed with the SIPO by Year 1987- 2005 Source: China’s Science and Technology Statistics
31
Fig. 4. Invention Patents Granted by the SIPO 1987-2005, Data Source: China’s Science and Technology Statistics
The industries surveyed typically followed the same trend, with varying results. In 1995, there were few domestic patent filings in pharmaceuticals and telecommunication equipment. In 2005, however, there were almost 6,700 filings and around 3,000 grants in the former, with around 1100 filings and nearly 500 grants in the latter (see Figs 5 and 6).
Fig. 5. China’s Chemical Pharmaceutical Product Industry: R&D, Patent Applications and Grants 1996-2005 Data Source: China’s Statistics Yearbook on the High Technology Industry
[ Impact of the Intellectual Property System on Economic Growth ]
Our study on major industry fields serves to put into context our case studies on selected companies in the following section. We chose specific industries for survey and analysis: the pharmaceutical, telecommunication equipment, manufacturing and automobile Industries.
32
Fig.6. China’s Telecommunication Equipment Manufacturing: R&D, Patent Applications and Grants 1995-2005 Data Source: China’s Statistics Yearbook on the High Technology Industry
Manufacturing saw approximately a twelve-fold increase in applications and approximately eight times more grants when comparing 2005 annual filings and grants with those of 1995. In contrast, China’s automobile industry filed very few invention patent applications. Instead, domestic automotive companies prefer the utility model, a type of patent with a weaker requirement for inventiveness according to Chinese law.
[ Impact of the Intellectual Property System on Economic Growth ]
R&D Trends Over the same period, Gross Domestic Expenditure on R&D (GERD) grew steadily. Despite the strengthening of patent protection at the beginning of the 1990s, the rate of GERD to GDP fell at one point to an historic low of 0.57 per cent in 1995 and 1996. However, since 1996, the rate increased to roughly 0.1 per cent per annum and it reached 1.34 per cent in 2005 (see Fig. 7).
Fig. 7. Gross Domestic Expenditure on R&D and the percentage of GERD/GDP 1987-2005 Data Source: China’s Science and Technology Statistics
At the industry level, annual R&D expenditure in 2004 increased by around 54 times the 1995 rate for telecommunication equipment; fivefold for pharmaceuticals; tenfold for manufacturing (see Figs 5 and 6). For the automobile industry, annual expenditure on R&D in 2005 was around 4.5 times that of 1998. This intensified activity gained impetus after 2000, which could partly explain the rise in patent filings since 2001.
33
Fig. 8. R&D Expenditure of Large Scale and Medium Enterprises in Relation to Sales 1991-2005 Data Source: National Bureau of Statistics of China
2.3. Results of the Analysis While patent applications, grants and R&D trends tended to show that patent creation followed economic growth, the situation was not as optimistic as it seemed. For example, take China’s high-tech industry from 1992 through 2003: imports of high-tech products always exceeded exports. Although, 2004 and 2005 saw exports exceeding imports, exports of high-tech products were mainly from foreign-funded enterprises. They were also the major importers of high-tech products: local companies’ imports were less than one quarter those of foreign-funded companies and exports amounted to less than one-seventh according to recent national science and technology statistics. Therefore, the situation has not changed
[ Impact of the Intellectual Property System on Economic Growth ]
In fact, the growth in investment in R&D followed the expansion of sales revenues. Overall, it seems that industries are more willing to spend money on innovation when revenue grows. Regarding the rate of R&D in sales, telecommunication equipment saw a considerable increase between 1995 and 2001, reaching a high of about 2.5 per cent in 2002, although at present it is decreasing. For pharmaceuticals the rate increased from 0.64 per cent to 1.18 per cent over the same period; for manufacturing, it grew steadily from 0.17 per cent to 0.56 per cent in 2002, falling slightly back to 0.52 per cent in 2005. For the automobile industry, however, the rate plunged from 1.9 per cent in 2000 to about 1.3 per cent in 2001 edging up slowly to nearly 1.7 per cent in 2005. On average, the rate of R&D to overall sales never exceeded 0.9 per cent, even though large and medium-sized enterprises saw a considerable increase in R&D from 1991 to 2005 (see Fig. 8).
34
since the 1980s where local companies, lacking essential patents, remained in the low value added processing trade, i.e. processing with imported or supplied materials. This point was further supported by our case studies on specific companies in these four areas.
3. Case Studies on Selected Companies’ Utilization of the IP System 3.1. Comparison of Selected Companies’ Data in Major Industrial Fields
[ Impact of the Intellectual Property System on Economic Growth ]
The situation was worse when we looked at specific company cases. For the survey, we relied heavily on publicly available information and we made great efforts to arrange interviews with the relevant departments of several of the companies selected, but most of our attempts met with no response; and where an interview was granted, it failed to provide sufficient information to make a proper analysis. Therefore, without unreasonably compromising our objective, we chose the successful companies where the relevant information was available to the public. Where patent information was needed, we searched publicly available databases. Where data on sales, net income and R&D input were required, we relied on corporate annual reports and other published data. For the telecommunication industry, we chose Huawei Technologies, a leader in next-generation telecommunication networks, and ZTE Corporation, China's largest listed telecommunication manufacturer and wireless solution provider, both of which are international players. They have stepped up their patent filing activity since 2000: Huawei's filing surged from 206 in 1995 to 3508 in 2005, ZTE’s from 139 to 909. They have also strengthened their international patent-seeking efforts through the PCT over the years. Huawei and ZTE are committed to innovation: from 2000 to 2005, they were both among the top three in the scale of R&D in China’s electronics industry. However, despite expansion in sales over the same period, their profit margin diminished: Huawei suffered a decrease from about 18 per cent in 2000 to about 6.0 per cent in 2005, with wild fluctuations in between; ZTE continued to decline from about 8 per cent to 3.5 per cent (see Figs 9 and 10).
Fig. 9. Huawei Technologies: Patent Application and Grants in China 1995-2006 Authors’ Patent Search
35
Fig.10. Huawei Technologies: Revenue and Net Income 2000-2006,
For the pharmaceutical industry, we selected North China Pharmaceutical Group Corporation (NCPC), a leading pharmaceutical manufacturer within China’s top 500 enterprises and one of the nominated best profit-makers in China. Like Huawei and ZTE, NCPC filed more patent applications with the State Intellectual Property Office (SIPO) after 2000, but even in the peak year 2005, it filed fewer than 20. Although NCPC claims to be China’s No.1 pharmaceutical exporter, it has so far filed only four PCT applications. Despite the company’s revenue growth, its share of net income in revenue decreased gradually from 1998 to 2003 and then plunged from 6.04 per cent in 2003 to 4.65 per cent below zero in 2005, the year when NCPC filed 17 patent applications. It is likely that the company is not strong enough to undertake innovation, considering that a slightly intensified patent application rate led to such a deep deficit (see Figs 11 and 12).
Fig. 11. NCPC: Patent Application and Grants in China 1996-2006, Authors’ Patent Search
[ Impact of the Intellectual Property System on Economic Growth ]
Data Source: Annual Reports
36
Fig. 12. NCPC: Revenue and Net Income 1998-2006,
[ Impact of the Intellectual Property System on Economic Growth ]
Data Source: Annual Reports
For manufacturing, we choose Xuzhou Construction Machinery Group (XCMG), the largest company in China in developing, manufacturing and exporting construction machinery. XCMG filed even fewer patent applications than NCPC. These applications were mainly made after 2001, leading to a maximum of six in 2005. In the case of NCPC, the expansion of XCMG’s revenue was dogged by a continuously diminishing profit margin. The share of net income in revenue decreased from 6.97 per cent in 1999 to 0.98 per cent in 2004 and plunged sharply to -4.19 per cent in 2005, the year when XCMG filed the highest number of patent applications. It seems that XCMG is too weak to invest in R&D, as a slightly increased level led to a deep deficit. In fact, XCMG is subject to acquisition by the Carlyle Group, which agreed to acquire an 85 per cent stake in the company for 75 million US dollars in 2005. However, so far, the transaction has not been approved (see Figs 13 and 14).
Fig. 13. XCMG: Patent Application and Grant in China 1996-2006 Authors’ Patent Search
37
Fig. 14. XCMG: Revenue and Net Income 1996-2006,
For the automobile industry, we selected China First Automobile Works Group Corporation (FAW), a pioneer of China's automotive industry in collaboration with several leading international players, whose total assets were valued at 109.85 billion Yuan (14.27 billion US dollars) and with China's largest and most extensive automobile R&D facility. As in the case of NCPC, FAW increased invention patent applications after 2001, with a maximum filing of 17 items in 2005, the year when its profit margin fell sharply. Unlike the companies discussed earlier, FAW saw an expansion in sales with a widening of profit margins from 1996 to 2003. However, the share of net income in revenue slumped from 6.12 per cent in 2003 to 1.94 per cent in 2005. Unsurprisingly, the FAW 2005 Annual Report, blamed increases in management costs, complaining that it was extensive R&D that swallowed 12.78 per cent of the profits (see Figs 15 and 16).
Fig.15. FAW: Patent Application and Grants in China 1996-2006 Authors’ Patent Search
[ Impact of the Intellectual Property System on Economic Growth ]
Data Source: Annual Reports
38
Fig.16. FAW: Revenue and Net Income 1996-2006, Data Source: Annual Reports
[ Impact of the Intellectual Property System on Economic Growth ]
3.2. Results of the Analysis As shown, we selected China’s leading companies in four industries which are successful in one way or another. They all increased patent application filing after the 2000 patent law reform, which preceded China’s accession to the WTO in 2001. However, with the exception of those in IT, their annual filings never exceeded 20 items. We believe that increased openness in the national economy has played a more important role in driving up domestic patenting activity than the 2000 law reform strengthening patent protection. Notably, together with their more intensive patent application activities, most of the selected companies suffered decreased profit margins in varying degrees despite their expanded sales revenues: some even made a loss. Our survey showed that, typically, Chinese companies are users of IP and seek patent protection for defensive purposes; and that even the successful companies selected have not yet grown strong enough to bear the cost and risk inherent in R&D, and this is even more relevant for SMEs. Although expanded sales can result in R&D investment in order to defend earned market share, diminished profit margins may cripple intensified R&D efforts in the end. Intensified R&D entails intensified risk and higher costs. With an already limited net income and limited experience in managing R&D activity, questions are raised as to whether domestic companies could successfully make and commercialize innovations before being thrown out of the market or simply absorbed by foreign companies. Challenges remain for Chinese companies, most of which are still struggling to free themselves from low value added business.
4. Model Analysis of the Impact of Reforms on Economic Development 4.1. Establishing the Economic Models 4.1.1. Impact on IP Creation 1. Model The following model analyzes the impact on IP Creation: ln(Xn) = [c1]*lnA + [c2]*lnB+[c3]*ln(IP index)+e Note: A: R&D, B: Benefit; X1: Patent Application; X2: Patent Registration
As national R&D expenditure contributes to national innovation measured by domestic patent application and registration, we took domestic patent application or registration as the dependent variable to be explained. For the variable “Benefit”, we chose GDP as the proxy.
39
2. Data Our data mainly covered the period from 1987 to 2005 and our domestic patent application data came from SIPO. As patent registration data calculated by reference to grant date largely represented the patent office’s administrative capacity, we considered collecting data on domestic patent grants by corresponding application date. Unfortunately, we were unable to obtain that and could only use the total grants by SIPO by application date for this report, resulting from our own patent searches. Considering that only about one third of patent registrations were granted to domestic entities, care had to be taken when we analyzed the basis of this data; we were in fact mainly evaluating the impact of the patent law reforms on China’s capability to attract valid patent filings from abroad. Further, it normally takes three to four years for a patent to be granted, and thus patent registration data before 2002 could be considered stable. In addition, our data on national R&D expenditure came from China’s science and technology statistics and GDP from the National Bureau of Statistics of China. The IP index derived from our calculation following the G&P Index methodology. All the data used in this section is listed here.
[ Impact of the Intellectual Property System on Economic Growth ]
Table 1. Data for Economic Model Analysis
40
3. Establishing the Model When establishing the model, we found that Pearson’s Correlation between the variables GDP and R&D was 0.964, significant at the 0.01 level (two-tailed), suggesting that inclusion of both variables would be unwise. We thus excluded the R&D variable from the equation. We also found that the Variance Inflation Factors (VIF) were greater than 10 when we matched data of patent applications with GDP for the same and preceding years. Hence, adjustment was required, for it may take some years for GDP to influence domestic IP creation and consequently patent filing activity. We adjusted the GDP data with a second order lag. When domestic patent applications were explained, the result of our regression analysis shows: Model Summary (b)
a Predictors: (Constant), LN_PINX, LN_GDP b Dependent Variable: LN_DPA N.B.: PINX stands for G&P Index; ,GDP for Gross Domestic Product; DPA for Domestic Patent Application; LN for Natural Logarithm
[ Impact of the Intellectual Property System on Economic Growth ]
Coefficients (a)
a Dependent Variable: LN_DPA
Therefore, domestic patent applications were positively related to GDP while the coefficient for the variable G&P Index was insignificant at the 0.05 level. The Durbin-Watson test showed a strong autocorrelation, thus, the equation, with defects, is: ln(Domestic Patent Application) = 0.789*lnGDP +0.413*ln (G&P Index) +2.502 Likewise, when patent grants by application date were considered the result is: Model Summary (b)
a Predictors: (Constant), LN_PINX, LN_GDP b Dependent Variable: LN_PGAD N.B.: PINX stands for G&P Index; GDP for Gross Domestic Product; PGAD for Patent g calculated grants counted by application date; LN for Natural Logarithm
Coefficients (a)
41
a Dependent Variable: LN_PGAD
Thus, with the Durbin-Watson test showing strong autocorrelation, patent grants (by reference to the corresponding application date) were positively related to GDP, and the variable G&P Index and the coefficients were thus significant at the 0.05 level. The equation, with defects, is: ln(Patent Grants) = 0.682*lnGDP +1.133*ln (G&P Index) +2.645
4.1.2. Impact on Economic Effects 1. Given Model The following model is given for analysis of the impact on economic effects: ln(domestic production)=β1*lnK+ β2*lnL + β3*ln(IP index)+ε Note: K: Private capital, L: Labor force
2. Data Here again, data covered the period from 1987 to 2005. The data on GDP, NIFA and the labor force were from the National Bureau of Statistics of China. For data used in this model, see Table 1. 3. Establishing the Model When establishing the model, we found that Pearson’s Correlation between the variables NIFA and labor force was 0.970, significant at the 0.01 level (two-tailed), suggesting that inclusion of both variables could be problematic: the labor force variable was thus excluded from the equation. We also found that the VIF were higher than 10 when we matched data of GDP with NIFA for the same year. Adjustment was therefore required, as it may take years for NIFA to be translated into GDP. We adjusted NIFA data with a third order lag and the result shows: Model Summary (b)
a Predictors: (Constant), LN_NIFA, LN_PINX, b Dependent Variable: LN_GD N.B.: PINX stands for G&P Index; GDP for Gross Domestic Product; NIFA for National Investment in Fixed Assets; LN for Natural Logarithm.
[ Impact of the Intellectual Property System on Economic Growth ]
Here, we used GDP data for the dependent variable “domestic production” and “national investment in fixed assets” (NIFA) for the private capital variable.
42
Coefficients (a)
a Dependent Variable: LN_GDP
Thus, GDP was positively linked with NIFA and the G&P Index, and the coefficients were significant at the 0.05 level. However, the Durbin-Watson test indicated a strong autocorrelation. Therefore, the equation, with defects, shows: ln(GDP) = 0.504*lnNIFA +1.180*ln (G&P Index) +3.698
4.2. Results of the Analysis
[ Impact of the Intellectual Property System on Economic Growth ]
In view of the strong autocorrelation, we only offer a tentative analysis which is subject to limitations. From the first model, we found that domestic patent application activity followed GDP growth with no significant link with the G&P Index, which represented the strength of patent protection. However, this Index could explain valid annual patent applications, measured by patent grants counted by application date. In view of the fact that only one-third of patent registrations were granted to domestic entities, it is certain that China’s reforms impact mainly on its capability to attract intensive patent filing from abroad. To what extent such reforms impact on China’s valid domestic patent application is as yet unknown. Although the third model indicated that GDP was positively correlated with NIFA and the G&P Index with strong autocorrelation, we cannot assume that this is a safe conclusion.
5. Discussion and Proposal In this report, we have endeavored to understand how strengthening IPR protection is related to the national economy in an evidence-based manner. Intellectual property protection was and is playing an important role in China’s ongoing open-door policy and economic reforms. Over the years, China’s national economy has witnessed decades of fast growth and Chinese IPR laws have been reformed and brought into line with its international obligations. While the trend of patent applications, grants and R&D tends to show that patent creation follows economic growth, the data show that China’s economy is still mainly locked in traditional low-skilled, labor-intensive industries. Our case studies showed that patent application activity grew but net income dropped. The studies indicated that, with the expansion of sale revenues, corporate patent application filing grew. A possible reason for this may be that expanded sales result in R&D investment to defend market share: in fact, domestic companies typically seek patents for defensive purposes. However, characteristically, domestic companies’ intensified R&D was often hampered by a diminished profit margin. Some of the successful companies selected even reported a deficit and attributed this to increased innovation activity, even though they typically filed very few patent applications and their main purpose for filing was defensive. Concerns were raised as to whether domestic companies could sustain their innovation efforts with
a diminished profit margin and little experience in R&D management and whether they could make use of the patent system to defend their markets before being banished from market or absorbed by foreign companies.
43
In the given models, our analysis resulted in equations with certain defects which prevented us from reaching safe conclusions. One of the models suggested that, comparable with the case studies, domestic patent application activity follows GDP growth, but with no significant link with the G&P Index. Another model suggested that the G&P Index, together with GDP, might explain valid annual patent applications, most of which come from abroad. The underlying logic may be that vibrant national economic growth coupled with strengthened IPR protection could attract foreign players to seek patent protection in the hope of controlling and profiting from the local market. We admit that the model analysis was subject to significant limitations. Unlike the corporate case studies where cost could be measured by profit margin, the models given took no account of the cost flowing from strengthened patent protection and intensified R&D. Due to the limitations of GDP as an indicator for domestic output, the given model runs the risk of ignoring the trade-off in strong IPR protection. Indicators should be created to measure both the benefit and cost of strengthened IPR protection otherwise our view is liable to be distorted.
Thirdly, use of the G&P Index may be problematic . Possible reasons are: first, it is purely a measure of legal provisions on paper and thus may not be a good proxy for IPR protection in practice over the years. Second, trademarks and copyright, which have also been strengthened over the years in China, are left outside its scope. Third, it is not specific to the field of technology, and thus contributed little to evaluating the impact of IPR protection on a specific industry. Fourth, our literature review showed that it was constructed mainly to conduct cross-section research across dozens of nations and often served as the variable to be explained. However, our task was to use it as a variable to explain historical national economic growth. Considering China’s relatively short history in patent law, our sample might well be too small to draw a statistically meaningful inference through use of the G&P Index. Last but not least, for the purpose of this report, the Index failed to consider measures adopted for IP-based economic development. For example, measures fostering collaboration between academia and industry are important for IP-based economic development. The Bayle-Dole Act is widely deemed to have stimulated IP creation and utilization in the US. This Act grants patent rights to inventions from government-sponsored research and development to certain types of entities, and thus serves an important purpose in encouraging commercialization of new technologies through cooperative ventures between and among the research community, small business and industry. China is working on strengthening such cooperation by adopting similar measures. However, again, the G&P Index, used in the given economic models, does not represent this type of policy change toward IP-based economic development.
[ Impact of the Intellectual Property System on Economic Growth ]
Second, to evaluate the impact of IPR reforms on national economic development, the number of patent applications and grants is a crude indicator. In fact, a large portion of granted patents were either remote from the market or simply abandoned. Data on commercialization of patented technology and licensing royalties will be valuable for understanding the direct impact of IPR reforms on economic activity. Unfortunately, these data are unavailable at present.
44
In short, with the above survey and model analysis, we were unable to arrive at a safe conclusion as to the impact of IPR reforms on China’s national economy. As shown, we did not look for an answer beyond the methodology given and the data collected. What is presented here must be only part of the whole story. We have not in fact yet analyzed the impact of IPR reforms on FDI and technology transfer, let alone the possible conflicting roles of IPR protection in technology transfer and innovation promotion. We believe that further study, using more advanced methodology and more accessible data, will increase our understanding of the relationship between the IPR system and national economic growth by evaluating both the benefit and cost of strengthening IPR protection. We sincerely hope that such a study will advance China's efforts to become an innovative country.
References For the Categories and Scoring Method to calculate the Ginarte-Park Index of Patent, see Chapter 2: Index of Patent Rights in The Economic Freedom of the World: 2002 Annual Report. For the Patent Search database used by the authors, http://www.cnipr.com. For China’s Science and Technology Statistics, http://www.sts.org.cn. For the National Bureau of Statistics of China, http://www.stats.gov.cn. For data on the telecommunication, pharmaceutical and manufacturing industries, see China’s Statistics Yearbook on the High Technology Industry; for data on the automotive industry, see, China’s Automotive Industry Yearbook.
[ Impact of the Intellectual Property System on Economic Growth ]
Huawei Technologies, http://www.huawei.com/cn/. ZTE Corporation, http://www.zte.com.cn/. North China Pharmaceutical Group Corporation, http://www.ncpc.com.cn/. Xuzhou Construction Machinery Group, http://www.xcmg.com/. China First Automobile Works Group Corporation, http://www.faw.com.cn/.
Impact of the Intellectual Property System on Economic Growth India Sanjay Kumar Verma*
45
1. Introduction 1.1. Outline of the Present IP System in India 1.2. Outline of the Present Economic Situation in India 2. Survey on Reforms toward IP-Based Economic Development 2.1. Brief History of Intellectual Property Laws and Policies in India 2.2. Identification of Reforms toward IP-Based Economic Development 3. Case Studies on Companies utilizing the IP System to Develop Business or Increase Economic Activity 3.1. Comparison of Company Data in Major Industrial Fields 3.2. Results of the Analysis 4. Analysis of Reforms that exerted Influence on Economic Development underpinned by the IP System using Economic Models 4.1. Impact of IP Creation 4.2. Impact on Business Activities 4.3. Impact on FDI 5. Discussion and Proposal 5.1. Patterns and Trends in Global Innovative Activity 5.2. The IPR Regime and Economic Development: The Evidence 5.3. IPRs as Determinants of Innovative Activity References
There has been much controversy on the role of IP protection, especially the patent system, in fostering innovation, technology and the industrial development of a country. Intellectual property protection is expected to encourage innovation by rewarding the inventor. Strong IP protection may also inhibit diffusion of knowledge and even technological development in the countries that are technology followers. Countries have fine-tuned their IP protection regimes to meet their developmental requirements. Against this backdrop, on-going attempts to harmonize and strengthen these regimes worldwide as part of the TRIPS Agreement is widely seen to be adversely affecting technological activity in developing countries by stifling knowledge spillovers as well as having implications for access to and affordability of lifesaving drugs by the poor.
1.1. Outline of the Present IP System in India In the Uruguay round of GATT negotiations paving the way for the WTO, India was put under a contractual obligation to amend its patent law in compliance with the provisions of TRIPS. Accordingly, the government brought Patents Rules, 1972 w.e.f. 20.4.1972 into force. These Rules were amended and replaced by the Patents Rules 2003 and further amended by the Patents (Amendment) Rules 2005 which include provisions relating to time-lines with a view to introducing flexibility, gradually reducing processing time for patent applications and simplifying and rationalizing procedures for granting patents. There are four Schedules to the Patents (Amendment) Rules 2005; the first Schedule sets out the fees to be paid. The *
This study was completed with the assistance of co-researcher N.V. Muralidhar Rao. The views expressed in this report are those of the authors and do not necessarily reflect those of the WIPO Secretariat or any of its Member States.
[ Impact of the Intellectual Property System on Economic Growth ]
1. Introduction
46
second Schedule sets out the list of forms and the texts required in connection with various activities under the Patents Act. These forms are to be used wherever required and can be modified if necessary with the consent of the Controller. The third Schedule prescribes the type of patent to be granted. The fourth Schedule prescribes costs to be awarded after various proceedings under the Act.
[ Impact of the Intellectual Property System on Economic Growth ]
1.2. Outline of the Present Economic Situation in India India has gradually moved on to a level of higher GDP growth path – 7 per cent-plus (Fig. 1), and this has been made possible due to many factors although the following two elements need to be mentioned. First, the growing consumerism in the country due to rising disposable incomes of the middle classes which is enabling the economy to grow robustly in spite of external events, e.g. rising oil prices. Second, the country has been able to improve its saving and investment ratios: these have now risen to nearly 30 per cent of GDP and are growing. Both, the emerging consumerism and the continuation of the present boom in investment could help to sustain the growth rate of 8-9 per cent in the near to medium term, which will eventually result in even better business opportunities.
Fig.1. GDP Growth Rates (%)
2. Survey on Reforms toward IP-Based Economic Development 2.1. Brief History of Intellectual Property Laws and Policies in India The Patents Act 1970 was a landmark in India’s industrial development. Its basic philosophy is that patents are granted to encourage invention; to ensure that these inventions are developed commercially without undue delay; that patents are not merely granted to enable the patentee to enjoy a monopoly on the import of the patented article. This philosophy is being implemented through compulsory licensing, registration of only process patents for food, medicine or drugs, pesticides and substances produced by chemical processes which, apart from chemical substances also include items such as alloys, optical glass, semi-conductors, inter-metallic compounds, etc. It may, however, be noted that products vital for the country’s economy such as agricultural and horticultural products, atomic energy and inventions on living matter are not patentable. Thus, the Patents
Act 1970 was expected to provide a reasonable balance between adequate and effective protection of patents on the one hand and technological development, public interest and India’s specific needs on the other.
47
The Act was again amended in 2002 to meet with the second set of obligations (patent term, etc.), effective from January 1, 2000. This amendment provides protection for a period of 20 years. Reversal of the burden of proof, etc. came into force on May 20, 2003. The Third Amendment of the Patents Act 1970, through the Patents (Amendment) Ordinance 2004, came into force on January 1, 2005, incorporating provisions for granting product patents in all fields of technology including chemicals, food, drugs and agrochemicals and this Ordinance was replaced by the Patents (Amendment) Act 2005 which has been in force since January 1, 2005.
2.2. Identification of Reforms toward IP-Based Economic Development 2.2.1. The Patent Regime before TRIPS The positive effect of patents was not observed on research and economic development activities and although companies like Ciba-Geigy (Novartis), Hoechst (Aventis) and Boots had set up facilities in India, the private sector did not pursue new drug R&D. Major research on drug development was started by the Central Drug Research Institute; a public sector organization which developed a modest infrastructure. This was supposed to provide incentives to Indian companies to undertake R&D but resulted in shrinkage of market opportunities for local companies because they were no longer able to carry out reverse engineering and reproduce drugs invented abroad and protected by patents.
2.2.2. The Patent Regime after TRIPS
2.2.3. Trend of Applications Filed A survey on the trend of patents and design applications filed in India over the last 15 years clearly showed an increase after the year 2002-03 (Figs 2 and 3).
Fig. 2. The Annual Pattern of Patents Filed in India
[ Impact of the Intellectual Property System on Economic Growth ]
Abolition of product patent protection in 1972 provided Indian companies with the opportunity to develop and innovate. The private sector has started investing in R&D for new drugs.
48
Fig. 3. The Annual Pattern of Design IPRs Filed in India
[ Impact of the Intellectual Property System on Economic Growth ]
However the study involving trademark applications did not show a similar rise during this period; it showed a steady rise up to the year 2002, stabilizing for some time and then decreasing in 2004, recovering again later (Fig. 4).
Fig. 4. Annual Pattern of Trademark Applications
3. Case Studies on Companies utilizing the IP System to Develop Business or Increase Economic Activity 3.1. Comparison of Company Data in Major Industrial Fields In order to analyze the effect of the IP system on economic development, three industrial sectors, i.e. pharmaceuticals, biotechnology and IT were studied in the present report.
3.1.1. The Pharmaceutical Sector The pharmaceutical Industry is in the front rank of India’s science-based industries with wide-ranging capabilities in the complex field of drug manufacture and technology. A highly organized sector, the pharmaceutical industry is estimated to be worth 4.5 billion US dollars, growing at about 8 to 9 percent annually.
Ranbaxy
Key Indicators:
Headquartered in India, Ranbaxy is an integrated, research-based, international pharmaceutical company, producing a wide range of quality, affordable generic medicines, widely trusted by health care professionals and patients. It is ranked among the top 10 generic drug companies worldwide.
• Founded in 1961 in Gurgaon • Total sales: 1.03 billion US dollars (2004), 1.2 billion US dollars (2005) • Exports account for 58 per cent of sales. Largest markets include: Brazil, China, Russia and the US • 28 per cent of sales are in the US market. • Sales of generic drugs in over 100 countries, manufacturing operations in seven countries and offices in 44 • R&D budget: 75 million US dollars (2004) • Employees: 1,700
Dr. Reddy’s Laboratories
Key Indicators:
Dr. Reddy’s is India’s third largest integrated company offering a range of generic and branded drugs and active pharmaceutical ingredients (APIs). Most of Dr. Reddy’s sales are of branded drugs and reverse-engineered versions of drugs patented in the west. In 2005, branded drugs accounted for 41 per cent of total revenue and APIs accounted for 34 per cent.
• India’s third largest drug producer • Revenue: 502 million US dollars (July 2006) • 66 per cent of revenue earned in foreign markets • 41 per cent of earnings derived from formulations • Invests 6.5 per cent of earnings in R&D • Employees: 7,525
49
Being on the threshold of the biotechnology revolution, India has 280 biotechnology and 180 pharmaceutical suppliers contributing to the total market which is worth 100 billion US dollars. The country has a global market worth 91 billion US dollars and there is scope for inexpensive R&D through bio-partnering and co-developing technologies mainly with Chinese and US companies. International pharmaceutical companies are seeking to set up their R&D centers here and to facilitate foreign investment; capital and government policies are being revised.
Biocon
Key Indicators:
Biocon is India's leading biotechnology enterprise. Over the past 28 years, it has evolved from an enzyme manufacturing company to a fully integrated biopharmaceutical enterprise focused on healthcare. It applies its proprietary fermentation technologies to develop innovative and effective biomolecules in diabetology, oncology, cardiology and other therapeutic areas. Biocon’s success has been its ability to develop innovative technologies and products and to rapidly leverage them to adjacent domains. This unique "integrated innovation" approach has yielded a host of patented products and technologies that have enabled them to set up multi-level relationships with a global clientele.
• Income from research increased by 52 per cent to Rs 1,006 million in 2005-2006 from Rs 662 million in 2004-2005 • Total Income increased by 9 per cent to Rs 7,932 million • R&D spend increased by 76 per cent to Rs 764 million • Dividend recommended at 50 per cent (Rs 2.5 per share) • Operating margins sustained at 30 per cent at Rs 2,340 million
[ Impact of the Intellectual Property System on Economic Growth ]
3.1.2. The Biotechnology Sector
50
3.1.3. The Information Technology Sector The Indian computer software and services industry has been recognized worldwide for its weight in the global market and the wide spectrum of technologies it covers. Industry as well as the government is making every effort to retain this situation and operate in a manner conducive to respecting the IPRs of others and to creating intellectual property. It has a 50 billion US dollar export target for 2008 and reached a production figure of 16.7 billion US dollars in 2004-05.
[ Impact of the Intellectual Property System on Economic Growth ]
India serves as a hub for patent filing for the IT-based US companies. The local subsidiaries of Cisco Systems, Intel, IBM, Texas Instruments and GE have filed 1,000 patent applications with the US Patent Office and Texas Instruments has 225 US patents awarded to its Indian operation. Opportunities for the Indian IT industry in the future will emerge primarily from the fields of embedded systems, chip design and software incorporated in non-computing devices.
Wipro
Key Indicators:
Wipro is the fourth largest company in the world in terms of market capitalization in IT services and is present in 35 countries along with 10 offshore development centers. Wipro’s list of industries is as follows: automobiles, avionics, computer peripherals, computing platforms, consumer electronics, distribution and logistics, energy and utilities, finance, government, health science, hi-tech, insurance, manufacturing, media and entertainment, mobile devices, retail, semiconductors, software products, storage technologies, telecommunications and travel and transport. Wipro is the largest third-party global R&D service provider and has over two decades of experience in software product engineering. It is in partnership with a leading, US-based semiconductor manufacturer for an automotive System-on-Chips (SOC). In its semiconductor segment, it provides services in SOC, ASIC, Board, FPGA, embedded OS/RTOS development and porting, diagnostics and firmware, and system software for SOC.
• Founded in 1945 • Headquartered in: Bangalore • Serviceline: VLSI, ASIC and SOC designs, complete system designs, DSPs, multimedia codecs, product strategy and lifestyle management, product support, firmware development, application software development • Revenue: 2.4 million US dollars (2005) • Net profit: 456 million US dollars (2005)
3.2. Results of the Analysis 3.2.1. Summary of Industrial Data
51
3.2.2. R&D Expenditures in Major Industrial Sectors
A comparison of patents filed by local and foreign companies shows that the share of Indian companies in patents has increased over the years outstripping those filed by foreign companies in the period 2004-2005 (Fig 5).
Fig. 5. Patents granted to Indian and Foreign Companies Source: DST
[ Impact of the Intellectual Property System on Economic Growth ]
3.2.3. Patents Filed by Indian and Foreign Companies
52
3.2.4. Ratio of R&D to Sales in Major Industrial Sectors
4. Analysis of Reforms that exerted Influence on Economic Development underpinned by the IP System using Economic Models 4.1. Impact of IP Creation
[ Impact of the Intellectual Property System on Economic Growth ]
The patent production or the knowledge function relates to the number of patent applications filed by a firm in a given year compared to the investment in R&D (Fig. 6) as well as GDP and other characteristics. However, in a developing country like India, firms do not have a long history in R&D or patenting. The technological spillovers are included in the data as a determinant of patenting in that Indian R&D is adaptive rather than innovative. Past innovations have caused shifts in technological opportunities as new discoveries can lead to an exploration of new areas of research and increase technological opportunities. Since the benefits of R&D are not entirely appropriable, spillovers occur when the fruits of a firm’s research activity benefit others in the same industry. The number of patent applications would increase with the ability of firms to assimilate R&D spillovers.
Fig. 6. Relationship between Patents Filed and R&D Expenditure
The number of patents obtained and applied is positively related to GDP. Higher GDP results in a greater number of patents obtained and applied. Results also show that there is a positive relationship between patents, expenditure on R& D and the IP index: R&D expenditure will lead to a marginal increase in patents obtained and applied. Results may improve after the introduction of the new patent policy in 2005 and can be further improved by studying the longer time period.
53
Table 4.1. Impact on IP Creation
* and ** indicate significance at 1% and 5% levels.
Since the liberalization process began in 1991, India's real GDP has grown at an average annual rate of approximately 6 per cent and it is expected to rise to over 9 per cent from 2006-2007. Growth has been led by services and manufacturing, the two largest sectors, with agriculture growing much more slowly. In the longer term, the government is aiming for growth of between 8 and10 per cent per annum. For any country, total factor productivity (TFP) reflects the efficiency with which production factors are used, and is thus a key determinant of an economy's performance, especially its international competitiveness. TFP should be distinguished from labor productivity (that is, the output per employee), which is reflected in wage rates and thus living standards. Among the main sources of improvement in labor productivity are growth in investment, which increases the amount of capital employees can use, and growth in TFP. In the absence of an accompanying improvement in TFP, however, higher labor productivity can only be achieved at the expense of lower capital productivity. One of the most important sources of TFP growth in the long run is technological progress. Data analysis shows that the average annual output in India increased from 4.5 per cent during the period preceding the reforms of 1991 to 6.5 per cent during 1993-2006. Of this increase, 1.2 percentage points were attributable to improved TFP, which more than doubled from an annual average of 1.1 per cent during 1978-1993 to 2.3 per cent during 1993-2006. The rest of the rise was largely due to increased investment. Improved TFP contributed to roughly half of the increase in labor productivity, which almost doubled between the two periods; the rest of the increase was due mainly to higher investment. Improved TFP was also largely responsible for the substantial increase in the rate of growth of capital productivity. Growth in both output and TFP has been much faster in the service sector than in industry: in contrast, growth in output and TFP in agriculture has slowed. It follows, therefore, that the shifting of resources, especially labor, from agriculture, where two-thirds of the labor force is currently employed, to the more productive service and industrial sectors would contribute to faster overall growth in output and TFP in the economy as a whole.
[ Impact of the Intellectual Property System on Economic Growth ]
4.2. Impact on Business Activities
54
Table 4.2. GDP
[ Impact of the Intellectual Property System on Economic Growth ]
Table 4.3. Total Factor Productivity, 1978-2006 (Annual % change)
To study the impact on business activities we have used the growth rate of value added to the growth rates of the labor force, fixed assets as capital and the IP index. Given that the underlying specification is an accounting identity, nothing should be assumed from the compatibility of the regression. The results show that there is a significant positive relationship between the capital K and GDP. A similar relation exists between the labor force and GDP: there is an insignificant relationship between the IP index and GDP. Table 4.4. Impact on Business Activities
* and ** indicate significance at 1% and 5% levels.
4.3. Impact on FDI
55
For a developing economy like India, FDI implies access not only to capital, but also to advanced technology and know-how, managerial expertise, global marketing networks and best-practice systems of corporate governance. FDI inflows are non-debt creating and more stable than portfolio flows that are guided by short-term risk-return payoffs and are prone to quick reversals in the event of adverse expectations. Research on FDI in India has mostly focused on its impact on macroeconomic fundamentals. The initial amount of literature on host-country determinants of FDI inflows into India points to such FDI being essentially domestic market-oriented (Banga, 2003a, Guha and Ray, 2004). India also appears to enjoy the advantage of low wage costs (Guha and Ray, 2004). However, there is hardly any empirical analysis of whether some of India’s much-vaunted economic strengths – a developed innovative capacity, phenomenal growth in IT, IP creation, large numbers of skilled workers and high yields from a vibrant capital market – have influenced inward FDI. FDI inflows into India have improved noticeably since 2001-2002 (Table 4.5). One of the reasons behind the improvement is the broadening of the definition of FDI since 2000-2001. Prior to this, data on FDI into India reflected only equity flows through the automatic approval route, various schemes earmarked for expatriates, the government route and acquisition of shares by non-residents in Indian companies under the Foreign Exchange Management Act of 1999. Since 2000-2001, equity capital of unincorporated bodies has also been included as part of the overall equity flows. Furthermore, reinvested earnings and other capital are also considered as part of FDI (RBI, 2007). Thus, the underreporting in FDI statistics has now been corrected and is in line with international norms. However, such changes in data reporting also imply that aggregate data on FDI inflows from 2000-2001 onward cannot be compared with earlier years (RBI, 2007).
[ Impact of the Intellectual Property System on Economic Growth ]
Table 4.5. FDI in India
Source: Reserve Bank of India Handbook of Statistics and Bulletin (March 2007).
India has emerged as one of the leading FDI destinations in Asia in recent years. This is evident from the increase in FDI inflows since 2004-2005, and particularly in 2006-2007 when the total passed the 10 billion US dollar mark for the first time. Analysis of industry-wise distribution of FDI inflows in India
56
presented in Table 4.5 shows that more than half of incoming FDI has moved into software and electronic equipment, services, automobiles, telecommunications and transportation. Indeed, concentration of FDI in electronics, computer software, financial and non-financial services, telecommunications and automobiles underlines a distinct tendency on the part of FDI to move into more technological and skill-intensive activities. There is also perhaps a tendency on the part of such flows to move more into services than manufacturing and the automobile industry appears to be preferred, followed by chemicals, food processing and drugs and pharmaceuticals. Data on FDI inflows for the period 1991-1992 to 2005-2006 have been taken from the estimates prepared by the Reserve Bank of India (RBI). We used a lagged growth rate in GDP at current market prices for capturing the domestic market size on the basis of national income estimates prepared by the Central Statistical Organization (CSO). The census data of population, the IP index used and the variables are referred to as POP and intellectual property respectively.
[ Impact of the Intellectual Property System on Economic Growth ]
Table 4.6. Share in Total FDI
* and ** indicate significance at 1% and 5% levels.
Table 4.7. Impact on FDI Inflows
* and ** indicate significance at 1% and 5% levels.
Earlier research studies (Guha and Ray, 2002; Banga, 2003) have indicated that FDI in India is more of the market-seeking variety, rather than resource-seeking or export-oriented. The coefficients of GDP were found to be positively significant and those of the IP index insignificant. This indicates that while the size of the domestic market positively influences FDI inflows into India, exports do not. The IP index was found to be statistically insignificant in explaining FDI inflows into India, although we found the population coefficient was positive and statistically significant. The result indicates that FDI inflows are encouraged by human resources. Indeed, the sectoral pattern of FDI inflows (Table 4.6) appears to be consistent with these findings. The main sectors drawing FDI to India, such as software, electronics, telecommunications, automobiles, pharmaceuticals are not only technology- and skill-intensive, but are also sectors that have seen efficient and widespread application of communication facilities. The latest data on FDI flows also indicate that India is about to break into the big league of FDI countries in Asia. R&D-driven innovation capacities which may lead to more IP creation along with expertise in using IT-based techniques in business operations can signal a significant change in the nature of FDI inflows, from market-seeking to exportoriented. The surge in FDI inflows in the last couple of years might be indicative of this shift as it shows that India’s attractiveness as an FDI destination is reinforced by the quality of its human resources which are capable of handling complex, technology-intensive processes efficiently.
57
The results of the econometric exercise indicate that research capital and foreign technological spillovers are important determinants of patenting activity. The study found that a stricter patent regime does indeed stimulate patenting activity in research-intensive industries in a developing country like India. The harmonization of patent laws worldwide has opened a window of opportunity for Indian manufacturers adept at producing cheaper versions by reverse-engineering for out-of-patent drugs. This result has significant policy implications for other developing countries that are at a similar stage of technological development. For a developing country like India the contribution of technological spillovers in filing patents underlines the importance of licensing policies conducive to technology transfer from developed to developing countries. All sectors are in a state of transition and the effect of stronger patents on patenting activity for products still remains to be seen even after the enforcement of product patents in 2005. The examination of India’s emergence as a key destination of FDI among developing nations and the IP index reveal that there is no significant relation between them. However, the latest data on FDI flows indicate that the recipe for technology-intensive export-oriented FDI appears to be the quality of human resources capable of handling complex, technology-intensive processes efficiently. The emergence of internal networking and coordination among different constituents in the innovation chain comprising academia, industry, publicly funded laboratories such as CSIR, ICMR, CDRI, etc. has become imperative to substantially improve the efficacy of the system relating to innovation and introduction in the market place. Protection of intellectual property is a very important element in the offshore business models which are operating at present in India. There have been many cases where organizations have lost their position in the market due to the loss of their intellectual property. Understanding the country’s IPRs and following best practices can drastically reduce this risk.
5.1. Patterns and Trends in Global Innovative Activity Many Indian companies have placed importance on the protection of IPRs and taken initiatives to increase awareness of protection and to promote intellectual property as a policy. It is widely believed, that stronger IPRs will greatly benefit software companies, and will encourage greater product development.
[ Impact of the Intellectual Property System on Economic Growth ]
5. Discussion and Proposal
58
At present the local software industry employs over 500,000 engineers and software services in India have gained a worldwide reputation. Strong levels of IP protection have encouraged foreign investment, with many companies choosing to either set up their own facilities in India or to outsource a large part of their business to India. Global technology generation and innovative activity is highly concentrated in a handful of developed countries with the top 10 countries accounting for as much as 84 per cent of global R&D activity (94 per cent for the US), and 91 per cent of global cross-border technological payments. Prominent among the emerging countries starting to obtain US patents in increasing numbers are South Korea and Taiwan. These countries, together with Japan, make an important case for analyzing the role played by IPRs in their technological development.
5.2. The IPR Regime and Economic Development: The Evidence The IPR regime is likely to affect growth indirectly by encouraging the innovative activity that in turn is the source of total factor productivity improvement. This regime could also affect the inflow of FDI, technology transfer and trade that might impinge on growth. The relationship between IPRs and development could be subject to the causality problem as developed countries are likely to have a stronger IPR regime. Studies have found the relationship between IPR protection and level of development to be non-linear, suggesting that patent protection tends to decline in strength as economies move into a middle-income stage in which they have greater ability to adopt new technologies. Quantitative studies have also shown that universally imposed minimum standards for patent protection are not likely to contribute to increased growth in countries below a certain threshold in terms of level of development.
[ Impact of the Intellectual Property System on Economic Growth ]
5.3. IPRs as Determinants of Innovative Activity The existing empirical literature suggests that the effectiveness of patent protection varies from industry to industry and inventive activity is sensitive to protection only in a few industries such as chemicals and pharmaceuticals. A study of the impact of strengthening patent protection for pharmaceuticals in Italy since 1978 showed little or no impact on R&D expenditure or on new inventions. Furthermore, R&D activity was found to be determined by the absorption of spillovers from the R&D activities of others, particularly in the case of chemicals and electronics. The importance of foreign R&D spillovers as a determinant of R&D activity could be even more important in developing countries where much of the R&D activity is of an adaptive nature. A number of studies have empirically demonstrated the ability of weaker IPRs in stimulating domestic innovative activity in developing countries. In fact stronger IPRs may actually adversely affect innovative activity by stifling the absorption of knowledge spillovers that are important determinants of innovative activity.
References
59
Annual Report of the Dept. of Information Technology (DIT), Ministry of Communications and IT (MoC & IT, Government of India, 2004-05 (www.mit.gov.in) and IPR Manuals published by its IPR Division on (i) Copyrights, (ii) Patents, (iii) Designs and (iv) Report on Trademark and Domain Names. Strategic Review 2004 and 2005, The IT Industry in India, National Association of Software and Services Companies (NASSCOM), New Delhi, India, www.nasscom.org. Interim Economic Report on the Indian Situation In November 2006 - Embassy of Switzerland, Ref. No. 512.0-Dej-Nmo New Delhi, November 9, 2006. Banga, R. (2003b), Impact of Government Policies and Investment Agreements on FDI Inflows, Indian Council for Research on International Economic Relations (ICRIER), Working Paper (116), November. Chakraborti, A. (2001), Determinants of Foreign Direct Investment: Sensitivity Analyses of Cross-Country Regressions, Kyklos, 54 (1), pp. 89-113. Guha, A. and Ray, A.S. (2002), Multinational versus Expatriate FDI: A Comparative Analysis of the Chinese and Indian Experience, in T.N. Srinivasan, (ed.) Trade, Finance and Investment in South Asia, New Delhi, Social Science Press. Guha, A. and Ray, A.S. (2004), India and Asia in the World Economy: The Role of Human Capital and Technology, International Studies, 41(3).
Lucas, R.E.B. (1993), On the Determinants of Direct Foreign Investment: Evidence from East and Southeast Asia, World Development, 21 (3), pp.391-406. Palit, A. (2006), The Role of Technological Capabilities in Enhancing FDI Flows in Developing Asia-Pacific Economies, UN-ESCAP, ARTNeT Policy Brief 9, November; Bangkok. UNCTAD (2005), World Investment Report, Statistical Annex, New York and Geneva.
[ Impact of the Intellectual Property System on Economic Growth ]
RBI (2007), Monthly Bulletin, March 12, Mumbai.
Impact of the Intellectual Property System on Economic Growth
60
Japan Hiroshi Kato and Futoshi Yasuda* 1. Introduction 1.1. Outline of the Present Intellectual Property System in Japan 1.2. Outline of the Present Economic Situation in Japan 2. Survey on Reforms toward IP-Based Economic Development 2.1. Brief History of Intellectual Property Laws and Policies in Japan 2.2. Identification of Reforms toward IP-Based Economic Development 2.3. Results of the Analysis 3. Case Studies on Companies utilizing the IP System to Develop Business or Increase Economic Activity 3.1. Comparison of Company Data in Major Industrial Fields 3.2. Results of the Analysis 4. Analysis of Reforms that exerted Influence on Economic Development underpinned by the IP System using Economic Models 4.1. Establishing the Economic Models 4.2. Results of the Analysis 5. Discussion and Proposal References
1. Introduction
[ Impact of the Intellectual Property System on Economic Growth ]
1.1. Outline of the Present Intellectual Property System in Japan Japan enforces all of the major IP laws including patent law, utility model law, design law, trademark law and copyright law. These laws are thought to have played an important role in the development of the Japanese economy. A patent is one of the most effective types of intellectual property for achieving economic development. In the 1980s, the number of Japanese patent applications increased although the number filed annually has remained approximately the same since that time (Fig.1). Japan has accelerated the nation’s IP policy since the Prime Minister’s statement in 2002. The Basic Law on Intellectual Property was enacted in 2002. Based on this law, the Intellectual Property Strategy Headquarters was established and the Intellectual Property Strategic Program has been published annually. The goal of Japan’s IP policy has been to transform it into an IP-based nation.
*
The views expressed in this report are those of the authors and do not necessarily reflect those of the WIPO Secretariat or any of its Member States.
61
Fig. 1. Patent Application Trends
1.2. Outline of the Present Economic Situation in Japan
Recently, the Japanese economy has been improving and GDP has increased due to the growth of certain industries including manufacturing, automobiles, pharmaceuticals, and IT. The IT industry is one of the fastest growing industries, and the sales of IT products such as computers and cellular phones have been increasing. There seems to be a close relationship between intellectual property and economic growth because similar patterns appear in Figs 1 and 2.
Fig. 2. GDP Trend (billion Yen)
[ Impact of the Intellectual Property System on Economic Growth ]
In Japan, GDP increased up to the late 1980s. At that time, electrical appliances and automobiles were major products and these industries were growing. However, Japan had been in the midst of an economic slump since the late 1980s and the growth of GDP was relatively slow in the 1990s (Fig.2).
62
2. Survey on Reforms toward IP-Based Economic Development 2.1. Brief History of Intellectual Property Laws and Policies in Japan 2.1.1. Patent System and Utility Model System In Japan, it became apparent that a patent system must be created in order to speed up the modernization efforts which began in the latter half of the 18th century, and the Patent Monopoly Act was publicly proclaimed in 1885. In addition, the New Utility Model Law was enacted in 1905 in order to strengthen the patent system. The patent system was gradually created over the following years. The system for assigning priority to the date on which a patent application for an invention was filed rather than the date on which the invention was discovered, which had been the policy up to that point, came into effect under the patent law adopted in 1921. This created the foundation on which the current system of patent laws is based. In 1959, the patent law was completely revised so that it closely resembled the present law. In 1975, this law was amended and the patent system for substances was introduced. Over the past 10 years, the patent law has been revised almost every year because of the recent policy for strengthening protection of the IP system.
2.1.2. Design and Trademark Systems
[ Impact of the Intellectual Property System on Economic Growth ]
The first examples of design protection were the design bylaws adopted in 1888. There were several revisions of the design laws in the following years, and the current design law in Japan is the result of a complete revision in 1959. The first trademark law was enacted in 1884, a year before the Patent Monopoly Act was adopted. Subsequently, there have been several reforms of this law similar to those of the patent law, and the current trademark law is the result of a complete revision in 1959.
2.1.3. Intellectual Property Policy The Act Promoting Technology Transfer from Universities to Industry (the TLO Law) was enacted in 1998 and technology transfer from university to industry was promoted. The Basic Law on Intellectual Property was issued in 2002. Based on this, Intellectual Property Strategy Headquarters were established in 2003 and the Intellectual Property Strategic Program has been revised annually since 2003. Local governments also introduced the IP strategic program to rural regions in 2003.
2.2. Identification of Reforms toward IP-based Economic Development 2.2.1. Introduction of the Patent System for Substances in 1975 In 1975, the patent system for substances was introduced, and in that year, the Japan Patent Office started to issue such patents. The number of patents granted to inventors in the pharmaceutical industry has increased since the introduction of this system (Fig. 3). R&D expenditures in the pharmaceutical industry have also increased (Fig. 4).
63
Fig. 3. Granted Patent in Pharmaceutical Industry
Fig. 4. R&D Expenditure in Pharmaceutical Industry Source: Japan Pharmaceutical Manufacturers Association “DATA BOOK”
The trade in technology in the pharmaceutical industry has increased since the introduction of the patent system for substances (Fig. 5). In Japan, new medicines are approved for production and sale by the Ministry of Health, Labor and Welfare and the number of medicines approved has increased since the introduction of the patent system for substances.
[ Impact of the Intellectual Property System on Economic Growth ]
Source: Japan Pharmaceutical Manufacturers Association “DATA BOOK”
Fig. 5. Technology Balance of Trade in Pharmaceutical Industry Source: Japan Pharmaceutical Manufacturers Association “DATA BOOK”
2.2.2. Promotion of Policy for Patent Licensing in 1998
[ Impact of the Intellectual Property System on Economic Growth ]
The Act Promoting Technology Transfer from Universities to Industry was enacted in 1998 and TLOs (Technology Transfer Organizations) were established in many regions: through TLOs, technology transfer from university to industry was advanced. Contracts concluded under the Promotion Policy for Patent Licensing have increased since the TLO law was enacted. (Fig.6) The economic impact of the promotion of a policy for patent licensing has also increased since the enactment of the TLO law (Fig.7).
Fig. 6. Contracts concluded under the Promotion Policy for Patent Licensing
65
Fig. 7. Economic Impact of the Promotion Policy for Patent Licensing
2.2.3. Enactment of the Basic Law on Intellectual Property The Basic Law on Intellectual Property, which established very fundamental rules on intellectual property, was enacted in 2002, This has had a significant impact on Japanese society as it was the basis for establishing the Intellectual Property Strategy Headquarters and for planning the Intellectual Property Strategic Program.
[ Impact of the Intellectual Property System on Economic Growth ]
One of the impacts of the Basic Law on Intellectual Property has been the change in Japan’s competitiveness ranking worldwide since 2002 (Fig. 8).
Fig. 8. Ranking of World Competitiveness Source: IMD World Competitiveness Yearbook
66
2.3. Results of the Analysis In this section the relationship between the IP system and economic growth was examined. We focused on three measures: i) the introduction of the patent system for substances in 1975, ii) the advancement of policy for patent licensing in 1998 and iii) the enactment of the Basic Law on Intellectual Property in 2002. As a result of the introduction of the patent system for substances in 1975, the number of granted patents, R&D expenditures and technology trades in the pharmaceutical industry have increased. As a result of the promotion of the policy for patent licensing in 1998, the number of contracts entered into under the advancement of policy for patent licensing has increased. Additionally, the economic impact of promoting the policy was reported. As a result of the enactment of the Basic Law on Intellectual Property in 2002, Japan’s competitiveness ranking has risen. According to the data before and after the introduction of these measures, the number of granted patents, R&D expenditures, technology trades and licensing contracts increased, showing that it is possible for a relationship to exist between the IP system and economic growth.
3. Case Studies on Companies utilizing the IP System to Develop Business or Increase Economic Activity
[ Impact of the Intellectual Property System on Economic Growth ]
3.1. Comparison of Company Data in Major Industrial Fields The number of patent applications filed annually with the Japan Patent Office has remained high at more than 400,000 since 1998 (Fig.9). The number of applications in all technical fields has remained approximately the same. If all the company data were shown in one figure, no trends would appear. Therefore, it is necessary to divide the data by technical field as follows.
Fig. 9. Recent Patent Applications
3.1.1. The Pharmaceutical Industry
67
Patents for substances tend to have a significant economic impact because the invention of substances can usually be applied to many other technologies. Therefore, IP strategy is very important for pharmaceutical companies. Five major companies in the pharmaceutical field were selected. Their royalties have increased since around 1999 (Fig.10). This trend seems to have been caused by a change in IP policy, giving priority to utilizing rather than obtaining patents.
Takeda Pharmaceutical Company Limited is one of the IP-based companies in this sector in Japan. The technological level in the pharmaceutical field is changing rapidly because biotechnology is playing an important role in the development of new medicines and Takeda is applying many biotechnology patents. The company has combined its intellectual property and research divisions in order to plan an effective IP strategy; it has advanced strategic patent applications and the utilization of intellectual property, which have provided it with important royalties. Intellectual property has been one of the most important factors in the company’s current success.
3.1.2. The Information Technology and Manufacturing Industries The manufacturing industry is growing and the IP system could be contributing to this growth because the royalties in this industry have been increasing. Five major companies in the IT and manufacturing fields were selected. The royalties of companies in the former sector have increased since around 1999 (Fig.11). IP policy has changed to give priority to utilizing patents rather than obtaining them and the trend in royalties seems to have been partly as a result of this IP policy.
[ Impact of the Intellectual Property System on Economic Growth ]
Fig. 10. Royalties of Five Pharmaceutical Companies
68
Fig. 11. Royalties of Five IT and Manufacturing Companies
[ Impact of the Intellectual Property System on Economic Growth ]
Sony is one of the IP-based companies in the IT field. Economic growth here has been very strong because of the diffusion of digital technology. Sony is actively utilizing intellectual property and selecting IP strategy from self-utilization, licensing and cross-licensing in certain cases. Recently, the company collaborated with Samsung in the utilization of intellectual property. Sony’s IP strategy includes a so-called “patent portfolio”, which has been applied to its Organic Electroluminescence (EL) display. This strategy also includes a so-called “patent pool” as many patents tend to be included in one product. Intellectual property has been one of the most important factors in Sony’s current success. Canon is one of the IP-based companies in the field of manufacturing precision instruments. Many patent applications tend to be filed in this area because manufacturing technology covers many technical fields. Canon is one of the companies applying multiple patents. It has traditionally given a high priority to intellectual property as part of its culture and it has encouraged researchers to apply for patents as well as to produce scientific reports: there too, the IP section has combined with that of R&D. Management of intellectual property has been one of the most important factors in Canon’s current success.
3.1.3. The Automobile Industry Five major companies in the automobile industry were examined and it was found that their R&D expenditures have increased since around 1999 (Fig.12). This means that new technology was being aggressively created in this field. Companies apply for a high number of patents because of the competitive nature of the industry.
69
Fig. 12. R&D Expenditures of Five Automobile Companies
Toyota is one of the IP-based manufacturers in the automobile industry. Their patent applications are of high quality, and this is a stable trend in this industry: R&D expenditures show the same pattern as patent applications. Toyota’s IP strategy includes a so-called “patent portfolio”, which has been applied to many models because they comprise many types of intellectual property. Toyota is furthering important selected fields by analyzing patent application trends. Intellectual property has been one of the most important factors for Toyota’s current success.
3.2. Results of the Analysis
In the pharmaceutical field, the royalties of five major companies have increased since around 1999, and this appears to have been the result of an IP policy. Intellectual property strategy is very important for pharmaceutical companies because patents tend to have a significant economic impact. Takeda is representative of the pharmaceutical field, involved in strategic application and utilization of patents. In the IT and manufacturing fields, the royalties of five major companies have increased since around 1999, and this appears to have been the result of an IP policy: Sony is representative of the IT field and promotes a patent pool. In this industry, the companies’ expenditure on R&D has increased since around 1999, showing that much new technology was and is being created. Toyota is representative of the automobile industry and promotes a patent portfolio. All the major technological fields showed their own characteristics, related to each company’s IP strategy.
[ Impact of the Intellectual Property System on Economic Growth ]
The annual number of patent applications filed in Japan has remained relatively unchanged at more than 400,000 since 1998. If all company data were displayed in one figure, there would seem to be no apparent trend. Therefore, it is necessary to divide the data by technical field.
70
4. Analysis of Reforms that exerted Influence on Economic Development underpinned by the IP System using Economic Models We carried out an econometric analysis of the impact of the Intellectual Property Strategic Program implemented by the respective local governments since 2003 using public data: some prefectures have been promoting IP strategic programs since 2003. These strategies were diverse, but they all aimed to promote the creation, protection and use of IPRs and to revitalize local economies. However, a quantitative analysis has not yet been carried out as to whether these policies have been effective. In this section and using available data, we analyze, as far as possible, how these programs by local governments have affected their economies.
4.1. Establishing the Economic Models We used the difference-in-differences analysis, which has been widely used in recent years for analyses related to policy evaluation. This method, which applies conventional econometric analysis techniques, allows for a more accurate estimation of policy effects. It is therefore used for estimating the effects of a wide range of policies including labor and medical policies. The formula is as follows.
[ Impact of the Intellectual Property System on Economic Growth ]
Yit=α0+α1 (dummy for a prefecture that formulated an IP strategy) i+α2 (dummy for the year of IP strategy formulation) t+α3 (dummy for a prefecture that formulated an IP strategy) i×(dummy for the year of IP strategy formulation) t+X itα4+εit The subscript i indicates the prefecture and the subscript t indicates the year. Y is an explained variable. In this paper, the numbers of patent filings per employee or per prefectural gross production or the number of trademark filings per employee or per prefectural gross production are used as the explained variable. The number of patent filings and the number of trademark filings are based on data from the Japan Patent Office Annual Report, and the number of employees by prefecture is based on the 2003 data from the Monthly Report on Prefectural Statistics compiled by the Cabinet Office. The dummy variable for a prefecture that had formulated an IP strategic program by 2004 is 1 and 0 for any other prefecture. Since IP strategic programs were formulated by prefectures either in 2003, 2004 or later, an ordinary year dummy is used as the dummy for the year of IP strategy formulation. The data source is the Progress Status of IP Strategies: Reference Materials for the IP Strategic Program 2006 from the Policy Headquarters. If the formulation of an IP strategy by a prefecture has had an effect on the number of patent or trademark filings, α3, which is the coefficient of the cross term between (dummy for a prefecture that formulated an IP strategy) i and (dummy for the year of IP strategy formulation) t, it should be significantly positive statistically. X is a control variable. The natural log-transformed prefectural gross production, percentage of primary industry and growth rate of the number of employees was used. Since companies’ IP activities including patent and trademark filings were likely to be higher in prefectures with a higher level of economic activity, the coefficient of the natural log-transformed prefectural gross production was expected to be significantly positive. In addition, a lower level of R&D activity was likely in prefectures where the percentage of the primary industry was higher. Therefore, the coefficient of the percentage of the primary
industry was expected to be negative. The growth rate of the numbers employed was a variable that expresses the growth potential of the prefecture’s economic activities. Since prefectures with higher economic growth were likely to produce more IP, the coefficient of the growth rate of the number of the employees was expected to be significantly positive.1 The estimation was based on the leastsquares method.
71
4.2. Results of the Analysis
[ Impact of the Intellectual Property System on Economic Growth ]
The results of the analysis are given below. First, a statistically significant increase was observed in the number of patent and trademark filings in the prefectures that had formulated an IP strategic program. Secondly, when we categorized the prefectures by the fiscal year in which they formulated their IP strategic program and estimated the effects of their IP promotion plans, we found a significant difference in the number of patent and trademark filings only for the prefectures that formulated their IP promotion plans in FY2003. This suggested that IP strategic programs were only effective in progressive prefectures and not necessarily elsewhere.
1
As a matter of course, it is also possible to show that economic growth was achieved as a result of active IP protection. Thus, we cannot deny the possibility that there is a simultaneity problem. However, as we do not take account of the coefficient of the growth rate of the numbers employed in this paper, we carried out the analysis without reference to this problem.
[ Impact of the Intellectual Property System on Economic Growth ]
72
5. Discussion and Proposal In the survey on reforms toward IP-based economic development we focused on three measures: i) the introduction of the patent system for substances in 1975, ii) the introduction of the Act Promoting Technology Transfer from Universities to Industry in 1998 and iii) the enactment of the Basic Law on Intellectual Property in 2002. According to the data before and after the introduction of these measures, the number of patents granted or applied for, expenditure on R&D, technology trade or licensing contracts greatly increased. This showed the possibility of a relationship between the IP system and economic growth and it also suggested that the former has been one of the factors in this high economic growth since the 1970s. Many Asian countries will find it useful to take note of these factors which have been responsible for the country’s success and it is recommended that Japan should broadcast these results as success stories, at home and in other Asian countries. In the case studies, we focused on four industries: pharmaceuticals, IT, manufacturing and automobiles. In the pharmaceutical industry, the royalties of five major companies have increased since around 1999, which appears to have been the result of recent IP policy. Takeda is representative of the pharmaceutical field and its IP strategy has been to put a higher priority on utilization than application of IP. In the IT and manufacturing industries, the royalties of five major companies have stayed high or even increased since around 1999. Sony and Canon are representatives in these fields and they have their own IP strategies such as “patent pools” and “cross-licensing”. In the automobile industry, R&D expenditure has increased
since around 1999, suggesting that new technologies were being aggressively created in this field. Toyota is representative of the automobile field, and a “patent portfolio” is part of its IP strategy. It is recommended that Japan should plan the IP strategic program for each major technology such as IT and biotechnology, as IP strategies are different in technological fields. Also, Japan should advance its utilization of IP to more than just its application in order to activate the economy.
73
In the economic analysis, a statistically significant increase was observed in the number of patent and trademark filings in the prefectures that formulated IP strategic programs. It is recommended that Japan should encourage local governments to plan these programs for their own prefectures as this is likely to have an effect on local IP creation and economic growth.
References Japan Patent Office, Trends and Issues on Industrial Property Rights (2007). Intellectual Property Strategy Headquarters, Intellectual Property Strategic Program 2007 (2007). Economic and Social Research Institute, Cabinet Office, Annual Report (2005). Japan Pharmaceutical Manufacturers Association Data Book.
Modified Data based on IPB Corporate Patent & Financial Statistics Database ((c) Intellectual Property Bank Corp.). For details on difference-in-different analyses, see Wooldridge (2005) or other literature. National Graduate Institute for Policy Studies, Report about IP and Local Government (2007).
[ Impact of the Intellectual Property System on Economic Growth ]
IMD, World Competitiveness Yearbook.
Impact of the Intellectual Property System on Economic Growth
74
Korea Jiyoung Han* 1. Introduction 1.1. Outline of the Present Intellectual Property System in Korea 1.2. Outline of the Present Economic Situation in Korea 2. Survey on Reforms toward IP-Based Economic Development 2.1. Brief History of Intellectual Property Laws and Policies in Korea 2.2. Identification of Reforms toward IP-Based Economic Development 3. Case Studies on Companies utilizing the IP System to Develop Business or Increase Economic Activity 3.1. Comparison of Company Data in Major Industrial Fields 3.2. Results of the Analysis 4. Analysis of Reforms that exerted Influence on Economic Development underpinned by the IP System using Economic Models 4.1. Establishing the Economic Models 4.2. Results of the Analysis 5. Discussion and Proposal
1. Introduction
[ Impact of the Intellectual Property System on Economic Growth ]
1.1. Outline of the Present Intellectual Property System in Korea The IP system in Korea includes patents, utility models, trademarks, designs and copyright. In this paper we will mainly deal with with the patent system, which has moved towards strengthening patent protection through 30 revisions of the Korean Patent Act (KPA) since 1961. In Korea it was necessary to reinforce the patent system in order to promote rapid industrialization. The importance of this system can be seen by the increase in the number of patent applications. According to a WIPO report, the Korean Intellectual Property Office (KIPO) was the third largest recipient in terms of the number of patent applications in 2004, after Japan and the US, followed by China and the EPO. Development of the patent system has been not only through continuous updates by removing unreasonable elements, but also through efforts to comply and harmonize with international patent systems and principles. The Korean patent system contains the following features: (i) enlarges the range of patentable subjects; (ii) increases the effectiveness of patent examination; (iii) strengthens patent protection such as the extension of the term of patent protection; (iv) controls misuse of patent rights; (V) signs up to international agreements on patents; (vi) complies with international trends for patent protection, etc. Through such revisions of the KPA the patent system has been brought into conformity with international laws.
*
The able assistance of Kwang-Chu Jang and Dr. Kyunghee Maeng is gratefully acknowledged. The views expressed in this report are those of the author and do not necessarily reflect those of the WIPO Secretariat or any of its Member States.
1.2. Outline of the Present Economic Situation in Korea
75
Fig. 1. Number of Patent Applications and Registrations in Korea
[ Impact of the Intellectual Property System on Economic Growth ]
Since 1962, when the first five-year economic development plan began, the Korean economy has grown rapidly, especially in the late 1980s and the beginning of the 1990s. Korea became a member of the OECD in 1993. However, the economy faced a severe financial crisis and called in the IMF in 1997, a time in which small and medium-sized as well as large enterprises went bankrupt. The IMF crisis resulted not only from a deterioration in the domestic economy, i.e. the increasing rate of youth unemployment; an increase in domestic debt; reduction of investment in enterprises; credit card fraud, etc: at that time the neighboring economies were also badly hit. Factors included a rise in the international price of oil, financial retrenchment in China, and delay in the economic recovery in developed countries. The effects of the IMF crisis continued until 2002 and the Korean economy seemed to be in freefall. During this period the number of patent applications and total R&D in Korea decreased (Fig. 2 and 3). In general, with the exception of the IMF crisis, total R&D in Korea has been increasing strongly since 1988 (Fig. 3). The Korean economy has also been recovering: since 2002 when the World Cup football finals were held in Korea and Japan; economic indicators have been rising; the trade balance has improved and patent applications have also increased, as shown by the statistical numerical values.
[ Impact of the Intellectual Property System on Economic Growth ]
76
Fig. 2. Patent Appliction Trends
Fig. 3. Total R&D in Korea
2. Survey on Reforms toward IP-Based Economic Development
77
2.1. Brief History of Intellectual Property Laws and Policies in Korea
In the meantime, the patent system in Korea has been developing, improving the efficacy of examination and judgment and simplifying procedures at the KIPO; strengthening patent protection; controlling misuse of patent rights; joining international treaties, etc. In particular, the number of unpatentable subject matters has been reduced and the current KPA contains a regulation as follows: “patents shall not be granted in respect of inventions the publication or exploitation of which would be contrary to ordre public or morality, or be harmful to public health. The patent system has been globalized through joining international treaties, for example the Paris Convention in 1980, the PCT in 1984, the Budapest Treaty in 1988; TRIPS in 1995; UPOV in 2002. In addition, a substance patent system was introduced in 1986 under commercial pressure from the US, which resulted in the granting of patents for chemical substances as well as medicines. Meanwhile, the KIPO drew up its own guidelines relating to biotechnology inventions in 1998 by which patents for inventions relaitng to human genes, plants, and animals could be granted as well. The KIPO also established a special guideline on business model patents in 2000, which made it possible to grant a patent for an invention relating to a business model. The present patent protection level in Korea can be said to be similar to that of the developed countries.
2.2. Identification of Reforms toward IP-Based Economic Development Major reforms that have had an important influence on economic development will be identified here. There have been approximately three major changes which have influenced the number of patent applications and registrations since the 1980s in Korea: the introduction of a substance patent system in 1986; joining TRIPS in 1994; the IMF financial crisis in 1997. Since the KPA was revised to grant patents for inventions on chemical substances in 1986, the number of patent applications increased from 12,759 in 1986 to 17,062 in 1987. The number then rose by approximately 2,000 to 3,000 every year until 1993. In 1994 Korea joined WTO/TRIPS with effect from January 1, 1995. In the three years from 1994 to 1996 the number of patent applications increased sharply with priority given to the IT and automobile industries. However, Korea’s economy was in severe jeopardy in 1997 at the time of the IMF crisis. This had a negative influence on R&D investment in Korean companies and resulted in a major decrease in the application of industrial property protection, particularly in the areas of automobiles, machinery and IT. However, the pharmaceutical industry was not greatly influenced by the worsening economy. Due to national efforts to overcome the crisis, Korea’s economy began recovering and showed an annual increase of more than 6 per cent from 1999 to 2002, which certainly influenced the area of IP protection: for example, the number of patent applications began increasing again. It is noteworthy that patents for inventions on biotechnology could be granted from 1998 according to the Examination Guidelines on
[ Impact of the Intellectual Property System on Economic Growth ]
The patent system in Korea was not established by the Korean government, but voted by certain foreign powers at the start of the 20th century in order to protect the dominant position of foreign patent rights in the market. At first, an agreement between the US and Japan for protecting inventions, designs, patents and copyright in Korea was concluded, by which the Korean Patent Ordinance was promulgated as of August 12, 1908. It was annuled on August 29, 1910 when Korea was annexed by Japan and the Japan Patent Act came into force in Korea, which became an independent country after World War II. Later, a patent act came into effect as part of the Industrial Property Act by Art. 91, American Military Government Ordinance. It was not until 1961 that Korea enacted a patent act of its own, with a structure similar to that of Japan and the US. Since 1961 the Korean Patent Act (KPA) has been revised around 30 times, to enable Korea to advance its industrial promotion policies.
78
Biotechnology of the KIPO, and that patent applications in this area have been continuously increasing. For example, 1,891 patent applications, including 1,030 by Koreans and 861 by foreigners, were filed at the KIPO in 1999, and 1,264 patents were granted.
[ Impact of the Intellectual Property System on Economic Growth ]
Fig. 4. Royalties obtained from Technology Export
With regard to benefits from the export of technology Korea has earned royalties mainly from China and the US, followed by some East Asian countries including India, Indonesia and Malaysia. Korea did not make a profit from the export of technology from 1978 to 1996, but it is since 1997 that technology transfer to foreign countries has been actively pursued (Fig. 4). In particular, Korea has earned important royalties since 2003; which almost corresponds to the year in which its domestic economy started its recovery, showing the relationship between royalties from technology transfer and IP protection. Foreign direct investment (FDI) certainly relies on the economic situation in each country. FDI in Korea decreased slightly in 1998, and more importantly from 2000 to 2003 (Fig. 5). During this period it decreased to almost 60 per cent. At that time foreign investors might have thought that Korea was still faced with financial problems even though its economy was slowly recovering. FDI doubled in 2004 in comparison with 2003, showing that foreign investors considered Korea’s economy to have begun turning around after the IMF financial crisis. On the other hand, the number of patent applications from 2001 to 2003 even slightly increased. Therefore, FDI does not seem to be proportional to patent applications.
79
Fig. 5. Foreign Direct Investment
Fig. 6. Real GDP (at 2000)
[ Impact of the Intellectual Property System on Economic Growth ]
As to GDP, Korea was in its worst position in 1998, but this changed in 1999 although the rise was not constant, and GDP continued decreasing until 2003, except for the period 2001 to 2002 (Fig. 6). GDP seems to be closely related to the domestic economy as well as to IP protection.
80
3. Case Studies on Companies utilizing the IP System to Develop Business or Increase Economic Activity 3.1. Comparison of Company Data in Major Industrial Fields In the report, four areas have been selected, namely the pharmaceutical, automobile, machinery and IT fields (see Graphs 7 and 8). Two companies in each industry were chosen, and certain features in each industry will be shown.
Fig.7. Number of Patent Applications in each industry (1)
[ Impact of the Intellectual Property System on Economic Growth ]
Source: KIPO
Fig. 8. Number of Patent Applications in each industry (2) Source: KIPO
The two companies selected in the pharmaceutical field were Dong-A and Yuhan corporations. This field points up the following features: First, the number of patent applications is much lower than that of other industries such as automobiles and IT (see Graph 9). Second, the number of patent applications in the area was not influenced by external factors such as the IMF crisis. Third, the two pharmaceutical companies have been consistently spending in R&D irrespective of external factors (see Graph 10).
81
[ Impact of the Intellectual Property System on Economic Growth ]
Fig. 9. Dong-A and Yuhan Patent Applications
Fig. 10. Dong-A and Yuhan R&D
82
The automobile industry gives the following results. First, although the selected companies, KIA and Hyundai, are representative of this field, they appeared to file very few patent applications in the early 1990s. Second, the number of patent applications vastly increased just before and after TRIPS. Third, the KIA Motor Company was faced with dishonor in 1997 when the IMF crisis occurred, and since then the number of its patent applications has been very low: however, its R&D investment ratio has slowly increased since 1998. Fourth, the Hyundai Motor Co. also experienced management difficulties around 1997, but its patent applications increased in 1999. Since then its growth rate has been almost static. In the meantime the R&D investment ratio of Hyundai rapidly decreased from 1998 to 1999 and continued a slow decline until 2002: it has however increased since then. During the IMF crisis the number of patent applications from Hyundai largely decreased, but that number has started recovering, and since then its IP strategy has been aimed at strengthening intellectual property, as the number of patent applications as well as R&D have slowly been increasing.
[ Impact of the Intellectual Property System on Economic Growth ]
The machinery industry shows first that the number of patent applications by the companies selected, Doosan Infracore and Hyundai Heavy Industries seemed to be greatly influenced by the domestic economy. Second, the number of patent applications by Doosan Infracore increased from 1992 to 1996, falling heavily at the time of the IMF crisis. The R&D investment ratio of Doosan Infracore dropped from 2000 to 2004 but has since been slowly rising. Third, the number of patent applications which Hyundai Heavy Industries has filed showed a steadily increase up to 1997, but then the number declined. On the other hand, its R&D investment ratio increased only from 1998 to 1999 and then stayed static. In the area of IT, two companies, Samsung Electronics and LG Electronics, were selected. First, the number of patent applications filed by Samsung Electronics declined heavily from 1997 to 2000, as it was badly affected by the IMF crisis, although the number has since greatly increased. Its R&D investment ratio also declined from 2000 to 2002, but then rose slowly up to 2006. Second, the number of patent applications by LG Electronics slowly increased from 1992 to 1997 and markedly increased from 1998 to 2004 although this has since decreased. Its R&D investment ratio was between 4.0 and 5.40 per cent from 2002 to 2006.
3.2. Results of the Analysis Research on the number of patent applications in the industries showed a vast difference in those in which external factors such as the IMF crisis had an influence on patent policies. For example, the number of patent applications in the pharmaceutical field consistently increased even during that period. In other words, the industry did not seem much affected by the crisis. On the other hand, the automobile and machinery industries are somewhat different. The number of patent applications in these fields has been positively influenced by TRIPS and negatively by the IMF crisis. In particular, the number of patent applications in the automobile industry largely declined in 1997 and 1998, but has very slowly increased since 1999. The number of patent application in the machinery industry also dropped in 1997 and 1998. However, it consistently increased from 1999, and has been increasing rapidly since 2004. From these results we deduced that patent applications for both the automobile and machinery industries seemed to be closely related to the domestic economic situation.
The IT industry has recently seen rapid development, playing a huge role in developing Korea’s economy. According to the results of our research, it has also been affected by external factors such as the IMF crisis with the number of patent applications decreasing slightly in 1998 and 1999. They slowly increased from 1999 to 2003 and have been growing strongly since. In terms of biotechnology inventions, it is noteworthy that since 2002 domestic patent applications have been almost twice those of foreign companies. We assume that a great deal of money and labor have been invested in R&D in biotechnology since the beginning of the 21st century.
83
[ Impact of the Intellectual Property System on Economic Growth ]
Meanwhile, the data on R&D and sales since 2000 are only given as averages. Although they have continuously increased in all areas studied during this period, the analysis shows that R&D and sales in the IT field have increased more sharply since 2004, followed by the automobile, machinery and pharmaceutical industries. This research shows that the IT industry has been the most important sector in Korea since 2000 with respect to the number of patent applications as well as to R&D and sales (Fig. 11). On the other hand, R&D investment ratios are so different over industries and companies that we cannot dismiss them in a word. For example, the R&D ratio of the Dong-A pharmaceutical company greatly increased from 2001 to 2003, while the R&D ratio of Doosan Infracore decreased during the same period. It is also noticeable that since 2002 investment by Samsung Electronics in R&D has been the highest of all eight companies and the number of its patent applications has been increasing since then (Fig. 12 and 13). We also noted that the R&D investment ratio of the KIA Motor Co. has continuously increased. Such results demonstrate that each company has its own R&D and patent policy which seems to be affected by the domestic economic situation. It would be helpful to obtain more time-series data on the R&D investment ratio over companies.
Fig.11. R&D and Sales Trends in IT field Source: The Bank of Korea
84
Fig. 12. Number of Patent Applications for Samsung Electronics & Hyundai Motor Co.
[ Impact of the Intellectual Property System on Economic Growth ]
Source: Korean Institute of Patent Information
Fig. 13. R&D ratio for Samsung Electronics & Hyundai Motor Co. Source: Korea Institute of Patent Information
4. Analysis of Reforms that exerted Influence on Economic Development underpinned by the IP System using Economic Models
85
4.1. Establishing the Economic Models 1. Impact on IP Creation This report followed model (A) using time-series data from 1976 to 2005 in order to analyze whether IP creation influences the number of patent applications and registrations. The reason these are added here is that we assumed the number of patent applications or registrations could be affected by R&D or GDP. (A) lnP = c + α1lnRD + α2lnGDP + α3lnIP + ε where P is the number of patent applications or registrations, IP is the intellectual property index, and ε is the error term. On the other hand, following model (B) we included R&D and the IP index in order to analyze whether royalties from technology exports affect the number of patent applications and registrations. (B) lnP = c + γ1lnRD + γ2lnBenefit + γ3lnIP + ε where Benefit signifies royalties from technology exports.
2. Impact on the Economic Effect of Business Activities We have used the protection function approach for analyzing whether capital stock, labor and intellectual property influence GDP. The period analyzed was 1972 to 2000.
lnGDP = c + β1lnK + β2lnL + β3lnIP + ε where K is net capital stock, L is the number of employed persons.
3. Impact on Foreign Direct Investment Here both GDP and population are calculated as variables, and we presumed the model (D) using timeseries data from 1971 to 2006 in order to analyze whether intellectual property has an influence on FDI. (D) lnFDI = c + δ1lnGDP + δ2lnPOP + δ3lnIP + ε where FDI is foreign direct investment, and POP is the total population.
4.2. Results of the Analysis First, we would mention that we used KIPO’s published data concerning the number of patent applications and registrations and data from the Ministry of Science and Technology (MiST) for total domestic R&D. The GDP figures were provided by the Korea National Statistical Office (KNSO) in 2000. We calculated the IP index from 1961 to 2006 using the same methodology as Ginarte & Park (1997). Unfortunately, Korea’s IP index in Ginarte & Park, which seemed to be wrongly calculated with respect to the year Korea signed up to international treaties and misunderstandings in its patent systems, is different from the IP index we calculated. Royalty figures from technology exports were provided by the Ministry of Commerce, Industry and Energy (MiCIE). The data on capital stock was provided by the net capital stock in Pyo’s article (2003)
[ Impact of the Intellectual Property System on Economic Growth ]
(C)
86
and the data on the number of employed persons was provided by the KNSO. The data on FDI was provided by the MiCIE, and on population by the KNSO. In addition, all variables were changed into log values. Table 1 shows the results of estimating model (A). First, the value of R2 is similar to 1, which means that model (A) is reliable. Among factors affecting the number of patent registrations, the estimated value for R&D is 0.841 and the t-value equals 15.6. However, it shows that R&D has little effect when both GDP and the IP index are included together in the regression equation. The IP index showed a negative number of patent registrations. On the other hand, as a dependent variable the number of patent applications was positively affected by R&D, but this had little influence on the number of patent applications when other explanatory variables such as GDP and intellectual property were included. In this way GDP positively affects the number of patent applications, while the IP index was not statistically significant but showed a negative sign. Therefore, the result demonstrates that the stronger the IP protection, the lower the number of patent applications and registrations.
[ Impact of the Intellectual Property System on Economic Growth ]
Table 2 shows the results assumed by model (B). The value of R2 in this model is also close to 1, meaning that the model is reliable. It shows that royalties obtained from exports of technology and R&D have a positive influence on the number of patent registrations. It is notable that R&D still influences the number of patent registrations, although other explanatory variables have been included. However, the IP index was not statistically significant, but showed a negative sign so that the result of model (B) may be similar to that of model (A). On the other hand, the number of patent applications was positively affected by R&D, but, as expected, was not concerned with royalties obtained from technology exports. Table 3 shows the results including explanatory variables such as labor, capital stock, GDP, POP and the IP index. Model (C) is highly reliable because the value of R2 is very close to 1. When estimating production function, capital production elasticity was 0.394, labor elasticity 0.709, and both are statistically significant. The IP index in model (C) had a positive influence on GDP, which means that strengthening intellectual property positively affects productivity. Although GDP positively affects FDI, the IP index does not influence it. This means that the enforcement of IP laws does not draw in FDI. Table 1. Estimated Results: Impact on IP Creation
Notes: 1. t-values are in parentheses. 2. ***(**, *) indicates significance at the 1% (5%, 10%) levels respectively.
Table 2. Estimated Results: Impact on IP Creation (continued)
87
Notes: 1. t-values are in parentheses. 2. ***(**, *) indicates significance at the 1% (5%, 10%) levels respectively.
Notes: 1. t-values are in parentheses. 2. ***(**, *) indicates significance at the 1% (5%, 10%) levels respectively.
5. Discussion and Proposal This paper deals with the impact of the IP system on economic growth in Korea through empirical analysis. Indeed, granting a patent for an invention relies upon the industrial patent policy of each country. For example, exceptions to patentability may be different according to the industrial development or technical level of the country. Certain regulations concerning exceptions to patentability in Korea have been rescinded over the years and the KPA has been expanded. It is remarkable that such revisions have recently been carried out, in particular in the area of IT and biotechnology. Based upon these revisions of its patent laws the Korean patent system has been globalized. Korea has made great strides with respect to patent application and registration, in particular since the 1990s. As mentioned in Part 4, the analysis on the impact of the IP system on economic growth
[ Impact of the Intellectual Property System on Economic Growth ]
Table 3. Estimated Results: Impact on Economic Effects of Business Activities, Impact on FDI
88
demonstrates that both R&D and GDP have close relationships with the extent of patent protection in Korea. There seems to be a relationship between the IP system and GDP shown in Fig. 1 and 6, and also by economic analysis (see Table 1). In addition, it is interesting to see that there seems to be a relationship between the IP system and IP creation shown in Fig. 1: however the economic analysis could not show this relationship. On the contrary, it shows that the number of patent registrations was in almost inverse proportion to the IP index (see Table 1). In other words, the stronger IP protection in Korea is, the lower the number of patent registrations or applications. Reinforcement of the IP system in Korea ultimately appears to show promotion of technology transfer (see Fig. 4). Looking in greater detail, royalties from exports of technology are shown to be related to the number of patent registrations, not patent applications (see Table 2). This is due to technology transfer abroad, mainly using registered patent rights. Furthermore, it is noteworthy that there seems to be a relationship between the IP system and FDI shown in Fig. 1 and 5: however the economic analysis could not demonstrate this (see Table 3). On the contrary, it shows that strengthening IP protection in Korea does not affect FDI. According to the economic analysis it is shown that a policy to strengthen IP protection in Korea has a positive influence on technology transfer, R&D and GDP, but not FDI. In addition, strengthening IP protection in Korea does not affect the number of patent applications or registrations. Taking into consideration these results from our economic analysis we consider that political measures are still needed for maximizing the positive effects of economic growth by strengthening IP protection in Korea. As to IP policy in Korea, more open policies should be adopted so that its IP protection may reach the level of the developed countries.
[ Impact of the Intellectual Property System on Economic Growth ]
References Ginarte, J.C. & W.G. Park, Determinants of Patent Rights: A Cross-National Study, Research Policy 26 (1997) 283-301. Keun Lee, IPR Policies and Economic Development: the Korean Lessons, http://www.jst.go.jp/asts_t/files/session_01/15_pre.pdf. Hak-Gil Pyo, Estimation of Capital Stock over Industries and Assets in Korea, Analysis of Korea’s Economy (in Korean), 2003. Jaeyong Song, Intellectual Property Regimes, Innovative Capabilities, and Patenting in Korea, Seoul Journal of Business, Vol. 12, No. 2 (Dev. 2006). Korean Intellectual Property Office Homepage: http://www.kipo.go.kr/ Korea National Statistical Office: http://www.nso.go.kr/ Korean Ministry of Science and Technology Homepage: http://www.most.go.kr/ Korean Ministry of Commerce, Industry and Energy Homepage: http://www.mocie.go.kr/
Impact of the Intellectual Property System on Economic Growth Malaysia Lim Heng Gee*
89
1. 2. 3. 4.
Introduction Brief History of the Malaysian Intellectual Property System The Malaysian Economy since Independence Reforms toward IP-Based Economic Development 4.1. Reforms in Intellectual Property Law that may Impact on Economic Development 4.2. Industrial Policy 4.3. Science and Technology Policy 4.4. Impact of IP-Based Policies on Trend in Patent Applications 5. Case Studies 6. Analysis of the Impact of the IP System on Economic Development 6.1. Establishing the Economic Models 6.2. Results of the Analysis 7. Discussions and Proposals
1. Introduction
The project focused on areas of particular relevance to the economic impact of intellectual property on developing countries. The major IP law reforms that are expected to have an important influence on economic development were identified. Company-level case studies were conducted to ascertain the impact of these reforms on companies. Where possible, the target corporations were chosen from among the top 10 companies in the country in the fields selected for the study; i.e., the pharmaceutical, automobile, IT and manufacturing industries. Based on specific case studies, the economic effects brought about by the IP system were examined. As economic development cannot be due exclusively to IP laws, other IP-related policies were also examined to determine their impact, working in tandem with the IP system on economic development in Malaysia. In relation to patenting as an indication of economic activity, the trends in the numbers of filings/registrations by domestic applicants were analyzed. From the statistics collected, an analysis of reforms that exerted influence on economic development was examined using economic models, based on their impact on IP creation, economic effects on business activity and on FDI.
*
This study was completed with the assistance of two other co-researchers, Professor Dr. Ida Madieha bt Abdul Ghani Azmi and Associate Professor Dr. Rokiah Alavi. The views expressed in this report are those of the authors and do not necessarily reflect those of the WIPO Secretariat or any of its Member States.
[ Impact of the Intellectual Property System on Economic Growth ]
It has constantly been asserted that the IP system is an effective way to encourage creativity, promote technological innovation, improve trade and enhance competitiveness. Some, however, maintain that the system may not necessarily be the most effective and appropriate way to fuel the economy. Our aim was to ascertain objectively, through empirical research, the role which intellectual property has played in the economic development of Malaysia.
90
2. A Brief History of the Malaysian Intellectual Property System The first copyright statute applicable to the whole of Malaysia was the Copyright Act 1969. This Act repealed the various copyright statutes which applied to different parts of the component states of Malaysia. Through this Act, all these states were subject to a single copyright law for the first time. The 1969 Act was replaced by the Copyright Act 1987, which came into effect on December 1, 1987 and which was further amended in 1990, 1996, 1997, 2000, 2002 and 2003 to cater for developments in the international arena. Malaysia’s patent law is presently governed by the Patents Act 1983, which came into effect on October 1, 1986. Prior to this Act, the different component states of Malaysia were governed by different articles of patent legislation. Those repealed by the 1983 Act were the Registration of United Kingdom Patents Act 1951, the Patent Ordinances of Sarawak, the Registration of United Kingdom Patent Ordinance of Sabah and the Patents (Rights of Government) Act 1967. The Patents Act 1983 was further amended in 1993, 2000, 2003 and 2006.
[ Impact of the Intellectual Property System on Economic Growth ]
The Trade Marks Act 1976 repealed all previous legislation and covers the whole of Malaysia. The statutes applying to the different component states of Malaysia that were repealed were the Trade Marks Ordinance 1950 for the Federation of Malaya, the Trade Marks Ordinance of Sabah and the Trade Marks Ordinance of Sarawak. The Trade Marks Act 1976 was further amended in 1994 and 2000. Prior to the present Industrial Designs Act 1996, there were three different sets of legislation relating to industrial designs. There were the UK Designs (Protection) Act, 1949 for West Malaysia, the UK Designs (Protection) Ordinance for Sabah and the Designs (UK) Ordinance for Sarawak. All these laws employed the "extension" system, where registration of a design in the UK would entitle the proprietor to a monopoly on it in the relevant signatory states. In 1996, all the above legislation was repealed and replaced by the Industrial Designs Act 1996. Since the coming into force of this statute, an applicant must register his design in Malaysia before he can claim any monopoly rights in it. In addition to the above, the Optical Discs Act 2000, the Layout-Designs of Integrated Circuits Act 2000, the Geographical Indications Act 2000 and the Protection of New Varieties of Plants 2003 have also been enacted.
3. The Malaysian Economy since Independence The Malaysian economy before independence was predominantly based on agriculture and mining. After independence, the government realized the need for a diversified and industrialized economy and thus it embarked on a drive toward sustained growth in several phases. Through these strategies the economy grew extensively. The manufacturing sector’s contribution to GDP grew from 8 per cent in 1957 to 13 per cent in 1970, 17 per cent in 1980, 25 per cent in 1990 and by 2006 the sector accounted for 32 per cent of GDP (see Fig. 1). The share of manufacturing in total exports rose from 9 per cent in 1970 to 22 per cent in 1980 and 47 per cent in 1987 before shooting up to 75 per cent in 1990. Between 2001 and 2005, the share was above 80 per cent. The major contributor was the electrical and electronics sector which accounted for 28 per cent of the manufacturing sector value added and 64.1 per cent of the total exports of manufactured goods in 2005 (see Fig. 2).
91
Fig. 2. Share of Manufactured Products in Total Exports (%)
The government has recently laid emphasis on transforming the manufacturing sector to focus on high value-added and knowledge-intensive industries. The main concern is the shift from input-driven to productivity-driven growth to obtain a higher contribution from total factor productivity.
[ Impact of the Intellectual Property System on Economic Growth ]
Fig. 1. Contribution to GDP by sector, 2006
92
4. Reforms toward IP-Based Economic Development 4.1. Reforms in Intellectual Property Law that may Impact on Economic Development The reforms identified here are not exhaustive as only those that may have an impact on IP creation and economic development have been selected and examined. Patents: The major factor was the enactment of the Patents Act 1983 which, for the first time, enabled applications for patents to be made locally instead of to the UK Patent Office. This Act also introduced the utility innovations system to protect inventions which may not be patentable since they do not satisfy the requirement for an inventive step. Another reform was brought about by the Patents (Amendment) Act 1993 which aims to encourage research in the medical field. Through this Act, purpose-built product claims for medical use are allowed even in relation to a known product. The 1993 Amendment Act introduced an important innovation. Applicants who had previously applied for a patent in relation to the same invention at the patent offices of Australia, the UK, the US and the European Patent Office (EPO) could now opt for a modified substantive examination instead of having to undergo a full substantive examination. This facility was further extended to applications filed at the Japanese and Korean Patent Offices in 2002 and 2003 respectively.
[ Impact of the Intellectual Property System on Economic Growth ]
The Patents (Amendment) Act 2000 brought about several changes to the patent law to ensure compliance with the TRIPS Agreement. An important reform which is beneficial to generic drug manufacturers was exemption from infringement proceedings for the use of a patented product during the patent term for the purpose of obtaining regulatory approvals for pharmaceutical products. The Patents (Amendment) Act 2003 also added a new Part XIV to the principal Act, containing provisions relating to international applications under the Patent Cooperation Treaty (PCT). Copyright, Trademarks, Industrial Designs and other Statutes: The most important reform in relation to the IT industry has been the specific inclusion of computer programs as a literary work under the Copyright Act 1987. The Trade Marks (Amendment) Act 1994 provides for registration of service marks. In line with obligations under the Paris Convention, provision for a right to claim priority for Convention applications was added. The major reform in industrial design law was the enactment of the Industrial Designs Act 1996, allowing for application and grant of industrial designs to be made locally. The Layout-Designs of Integrated Circuits Act 2000 is also significant as the owner of a new layout design is now protected under a sui generis statute instead of having to rely on the uncertain scope of protection under the copyright law.
4.2. Industrial Policy The industrial sector in Malaysia has been key in the economic development of the country. Industrial strategies have gone through four distinct stages since the 1960s. The first phase focused on substituting imports where generous incentives such as tariff protection, fiscal measures (mainly tax relief) and provision of infrastructure in the form of industrial estates, power and communications were granted to manufacturers. Although successful in stimulating the sector in terms of contribution to GDP, the strategy failed to create employment. This prompted the government to switch to an Export-Oriented Industrialization strategy (EOI) to generate higher economic growth and to create employment opportunities. Various incentives were produced, such
as the Investment Incentives Act 1968 which was specifically formulated to encourage foreign investment in export-oriented industries. Free trade or export processing zones were created and manufacturers were given generous incentives such as tax relief, tariff exemptions on inputs, infrastructural facilities, investment credits and tax-free remittances of profits and dividends. These measures resulted in persuading foreign electronics companies to invest in Malaysia.
93
However, the dependence on a narrow range of products and the lack of linkages with the domestic economy caused the government to move into the third phase of its industrial strategy in the early 1980s. Attention now switched to the automotive, cement and steel industries. By the end of the1980s, it was realized that there was no link between heavy industry and the export sectors: dependence on foreign technology and investment remained high. Thus, from 1986 onwards, the government came up with industrial master plans to provide for the development of specific sub-sectors. Export-oriented industries and foreign investment were further promoted. The biotechnology and services sectors were given an impetus to boost R&D and technological development.
4.3. Science and Technology Policy
[ Impact of the Intellectual Property System on Economic Growth ]
The S&T policy was formulated to accelerate industrial development, stimulate IP creation and promote the IT and biotechnology sectors. One of the focuses of the Seventh Malaysia Plan (1996-2000), followed up by the Eighth Malaysia Plan (2001-2005), was the building of indigenous technological capability in new technologies. Emphasis was placed on accelerating R&D and the amount of money disbursed for this purpose has been steadily increasing (see Fig. 3).
Fig. 3. National R&D Expenditure as a % of GDP, 1992-2002
94
Fig. 4. Royalty Payments, 2000-2005 (RM Million)
[ Impact of the Intellectual Property System on Economic Growth ]
Incentive schemes included double deduction expenditure incurred for R&D, pioneer status for companies involved in R&D and investment tax allowances of up to 100 per cent of qualifying expenditure. To promote commercialization of R&D in agriculture by the private sector, a fund of RM300 million was established in 2005. In the Ninth Malaysian Plan (2006-2010), the development thrust of the S&T policy was to adopt a holistic approach to strengthen the National Innovation System (NIS). One target was to intensify indigenous capacity building in key technologies through the creation of special funds for R&D in selected sectors such as biotechnology and IT. For this the National Biotechnology Policy was launched in 2005 and the national IP incentive schemes included double-deduction expenditure incurred for R&D, pioneer status for companies involved in R&D and investment tax allowances of up to 100 per cent of qualifying expenditure. To promote commercialization of R&D in agriculture by the private sector, a fund of RM300 million was established in 2005. The policy was launched on April 27, 2007, the targets being to increase the national R&D expenditure to 1.5 per cent of GDP by 2010, to increase the number of researchers, scientists and engineers to 50 per 10,000 employees in 2010 and to promote techno-entrepreneurship and technology-based enterprises. One key concern raised was the apparent imbalance in technology inflow and outflow (see Fig. 4).
4.4. Impact of IP-Based Policies on Trend in Patent Applications Since the implementation of the Patents Act 1983, there has been a gradual increase in the number of patents filed. This increase was more apparent in the 1990s, where the total number of applications has been consistently in the region of 4,000 to 6,000 a year since 1993. This could be attributed to Malaysia’s accession to the Paris Convention in 1990 which enabled foreign applicants to claim priority based on their earlier filing dates. Another factor could be the introduction of the modified substantive examination facilities for applicants originating from certain foreign patent offices in 1993, 2002 and 2003 (see Fig. 5).
Patent Applications by Country of Origin Foreign patent applications constituted a large part of the total number of patent applications (more than 90 per cent) (see Fig. 5). The total number of applications by all top 10 applicants has increased over the years. Filings from the US constituted one-third of the total cumulative patents applied for between 1986 and May 2007. The second largest foreign applicant has been Japan (19 per cent) followed by Germany (7.5 per cent) and the UK (6.2 per cent). Malaysian applications ranked fifth, accounting for 5.5 per cent of the total number of patent applications (see Fig. 6).
95
[ Impact of the Intellectual Property System on Economic Growth ]
Fig. 5. Patent Applications by Nationality (1986-2006)
Fig. 6. Patent Applications by Country (1986 to May 2007)
96
It is noteworthy that Japan and the US have been the top two sources of FDI in Malaysia for the past few years (see Fig. 7).
[ Impact of the Intellectual Property System on Economic Growth ]
Fig 7. Top Five Sources of FDI, 2005 and 2006 (RM Billion)
Patent Applications by Area of Technology Analysis according to areas of technology in 2006, showed that the highest number of applications came from the electrical and electronics sector (1,583), followed by chemicals and metallurgy (1,275) and performing operations and transport (1,155). The share of patent applications from the electrical sector increased from 11 per cent in 1993 to 23 per cent in 2006. For the chemical industry, the share of applications in 1993 was 39 per cent but by 2006 it had dropped to 19 per cent. However, the total number of applications grew by 153 per cent during this period. Applications from performing operations and transport constituted 13 per cent in 1993 and 17 per cent in 2006. The growth in applications was 583 per cent. For the physics sector, applications grew by 572 per cent while the share of this category in the total number of applications increased from 12 per cent to 15 per cent between 1993 and 2006 (see Fig. 8). The patent application trend in the electrical and electronics sector recorded a positive correlation with performance in terms of sales and investment. During the period 2005-2006, the sales value of the electronic and electrical sector topped other industries by recording approximately RM190 billion, followed by chemicals at approximately RM130 billion (see Fig. 9).
Fig. 8. Patent Applications by Category, 1993-2006
97
Fig. 9. Sales Values of Selected Industries, 2005 and 2006 (RM Billion) Table 1 shows that between 1996 and 2005, more than 60 per cent of investment in the country was concentrated in five industries, i.e. the electrical and electronics sector, accounting for 31 per cent of foreign investment, followed by petroleum products including petrochemicals (12 per cent), basic metal products (9 per cent), paper, printing and publishing (7 per cent) and chemicals and chemicals products (7 per cent).
[ Impact of the Intellectual Property System on Economic Growth ]
Table 1: Total Investments in Manufacturing Sector by Industry, 1996-2005
Source: IMP3 (2006), Table 1.4, p. 8.
98
Patents by Industrial Sector In all four sectors (IT, manufacturing and equipment, automobiles, and pharmaceutical and chemical industries), steady growth in patent grants could be seen. However, the highest number of patents granted was in the pharmaceutical sector. The rate of growth was phenomenal; from a mere 10 patents in 1989 to 321 in 2006. The highest total grant of patents for the pharmaceutical industry was in 1993, with 197 out of 1,284 patents granted that year, accounting for 15.3 per cent of total patents granted. However, there was a decrease in patent grants from this sector from 1994 to 2000. This could have been due to reasons unrelated to the reforms concerning the introduction of purpose-built product claims for medical use and the Bolar exemptions (see Fig. 10).
[ Impact of the Intellectual Property System on Economic Growth ]
The statistics for patent grants were consistent with the phenomenal increase in the share of domestic investment in the pharmaceutical industry. The analysis shows that the share of average domestic investment increased from 65 per cent in the period between 1996 and 2001 to 76 per cent between 2001 and 2005. At the same time, the percentage of foreign investment dropped from 35 per cent to 24 per cent. One possible conclusion to be drawn is that the 1993 reform of the Patents Act 1983 to allow the patenting of purpose-built product claim applications provided more commercial opportunities to the industry; hence the boost in local investment.
Fig. 10. Patent Grants by Selected Industrial Sectors, 1988-2006
A sudden growth in patent grants in the IT industry was seen in 2006: from a mere two patents in 1990, this grew by 500 per cent to 101 patents in 2006. The increase was apparent from 1998 onwards. This phenomenon could be attributed to the special measures adopted by the government to boost development of the industry, particularly with the establishment of the Multimedia Super Corridor and the increase in funding of R&D on IT-related projects (see Fig. 10). The manufacturing sector has remained an important sector as can be seen in the number of patent grants. In 2006, a total of 61 patents were issued to this sector, which amounted to 0.9 per cent of the total number of patents granted. In contrast, the number of patent grants for the automobile industry was negligible and sporadic: a total of nine such patents were granted between 1996 and May 2007.
Filing Trend by Local Applicants and Patent Applications from Universities and Research Institutes The share of local patent applications has been increasing gradually over the years. A notable increase has been observed since 2000. The share of local patent applications increased from 2 per cent in 1986 to 3 per cent in 2000, before rising to 7 per cent in 2002, and to 10 per cent and 12 per cent in 2004 and 2006 respectively. In the first five months of 2007, local patent applications accounted for 28 per cent of the total.
99
The S&T policies contributed to the growth of local patent applications, particularly from universities. The continuous support given by the government in financing R&D in universities through the IRPA grant was a major factor behind the growth of patent applications in this area (see Fig. 11).
The total number of applications from universities in 2006 was 104, which accounted for about 20 per cent of total local applications. Six of the top 15 patent applicants for the year 2006 were universities; while three were statutory bodies specifically created by the government to conduct and commercialize research and development. This showed that a significant share of R&D in Malaysia took place in universities and government-led research institutes. This trend has to be interpreted together with the introduction of IP policies in universities and research institutes from the mid-1990s. Under these policies, universities allocated a major share of potential profits to the researchers, which provided an incentive to university lecturers to spend time on research and innovative activities.
IP and Economic Growth There seemed to be a clear correlation between patent applications and the country’s economic performance. During the two economic recessions in the mid-1980s and 1990s, there was a noticeable decrease in patent applications. This downward trend reversed as the economy picked up again in 1988 (see Fig. 12).
[ Impact of the Intellectual Property System on Economic Growth ]
Fig. 11. Patent Application Filed by Universities and Research Institutes, 1987-2006
100
Fig. 12. Nominal GDP (RM million) and Patent Applications, 1976-2006
5. Case Studies
[ Impact of the Intellectual Property System on Economic Growth ]
A survey was conducted from March-June 2007, using questionnaires to assess companies’ R&D strength, innovation and experience in IP application as well as their response to IP reforms. The idea was to corroborate the findings in Chapter 4, particularly in relation to the links between IP-based reforms and IP filings. The survey instrument was followed up by personal visits and interviews. The companies selected were from among the top players in the relevant industry as listed in the MIDA Report on the Performance of the Manufacturing and Services Sectors 2006 (Malaysian Industrial Development Authority - the principal agency of the Ministry of International Trade and Industry for the promotion and coordination of industrial development in Malaysia). This list was then cross-checked with the list of the top ten applicants provided by the Malaysian IP Office. Where possible, the final choice of companies was based on their importance in the relevant field and their level of patenting activity. This was not, however, always possible: one major constraint being the unwillingness of the target companies to be involved in this survey, despite their fulfilling the desired parameters. The study was subject to certain limitations and constraints. Although a particular sector may have many sub-sectors, the choice of sub-sector was based on the recommendations of MIDA. Second, though in some sectors companies were quite active in IP applications in both the IT and machinery sectors, it was found that the top industry players, particularly local companies, were not necessarily active users of the IP system. Not all the companies taking part were willing to disclose data such as sales or licensing fees which they considered to be confidential. Because of this, analysis of the impact of the IP-based reforms on the companies’ revenue and licensing trends could not be made. Further, individual company’s experience with IP reforms could not be taken as representative of the whole industry. This section only highlights the main observations of the respondents in the four sectors surveyed. Lastly, use of the IP system was not consistent overall. Among the companies approached, a total of nine agreed to participate in the survey. From the IT industry; data was obtained from one local company involved in the computer, peripherals and IT software sub-sector, i.e. FTEC System Sendirian Berhad, with two local companies from the telecommunications sub-sector, i.e. Telekoms Malaysia Bhd and Motorola. From the manufacturing and equipment industry,
data was obtained from Favelle Favco Berhad (FFB) and Cooper Cameron Sdn Berhad. These companies, one local and one foreign, are major players in the oil and gas sub-sector. For the automobile industry data was obtained from Proton Berhad and Perodua Sdn Bhd, two major companies in the car industry. For the pharmaceutical and chemical industry; data was obtained from Hovid, one of the top ten local pharmaceutical companies. We also obtained data from the Malaysian Palm Oil Board which operates mainly in the chemical industry and is one of the major players in the palm oil market.
101
In the IT industry, technology mostly comes from abroad and R&D undertaken by some companies is only confined to product packaging or customization to suit the needs of local clients. Most of the local companies are assemblers. Components are sourced in the open market and thus no payment of license fees is involved. Patents are not as relevant to them as the technology involved is rapidly outdated. Moreover, customization of products could hardly be considered so novel as to be patented. Therefore, for companies like FTEC, trademarks are more important (see Table 2). Copyright, however, is essential. Thus copyright piracy campaigns run by the government have in many ways indirectly benefited the IT sector. Trade secret laws are also essential, particularly relating to the development of new software.
In the telecommunication industry, although there was substantial creation of intellectual property by companies such as Telekoms, heavy reliance was placed on foreign technology. Efforts at innovation have mostly been focused on developing technology for use within the company’s group and rarely licensed to outsiders. Being the main player in a robust telecommunication industry, Telekom conducts continuous R&D to maintain its lead. In terms of numbers of IP applications, the company outperformed other local companies, not only in relation to patents, but also in trademarks and industrial designs (see Table 3).
Table 3. IP Applications by Telekoms
[ Impact of the Intellectual Property System on Economic Growth ]
Table 2. Trademarks Owned by FTEC
102
For the oil and gas industry, IP protection and trademarks were found not to be particularly relevant. This is due to several factors, the first of which is the entry barrier to competitors. The oil and gas industry is highly regulated and any activity pertaining to oil drilling and manufacture of components and equipment for the industry requires licensing from PETRONAS (Petroliam Nasional Berhad, the stateowned holding company for Malaysia's oil and natural gas concerns). The design and development of cranes requires a high degree of expertise and few companies could copy or compete. Cranes are considered as capital expenditure. Their high value results in customers’ favoring established companies to ensure that the cranes purchased meet safety and quality standards. The strict safety standards laid down for cranes and oil and gas drilling equipment discourage small companies from entering the market. A longer gestation period for projects only favors companies with strong financial resources. Most equipment and components (wharves, cranes, etc.) are specifically designed to meet each customer’s needs; therefore the top local companies found that patenting was unnecessary. Copyright and trade secrets are, however, important to maintain competitiveness: heavy reliance on confidentiality is placed on contracts for the supply of equipment. Trademarks are important in relation to branding. In the automobile industry, the companies surveyed reported heavy reliance on basic technologies acquired through joint ventures with Japanese companies which owned the intellectual property, thereby incurring substantial expenditure in royalties for the use of the technology. The two companies surveyed conduct R&D on all cycles of innovation, including the development of new technologies such as the Proton “campro engine”. Despite this, one of the companies felt that patents were relatively unimportant. The company would rather keep the technology secret than reveal it through patents since it is continually being refined. Proton has made several applications for patents both locally and overseas. However, it has made vastly more applications in relation to trademarks and industrial designs, both inside and outside Malaysia (see Table 4).
[ Impact of the Intellectual Property System on Economic Growth ]
Table 4. IP Applications by Proton
Trademarks were considered important as distinguishing a brand and offering an indication of quality. Industrial designs were also considered to be particularly important. However, both companies lamented the state of the current industrial design law which, to them, is unfriendly to the industry. The current law contains exceptions for spare parts (must-fit and must-match) and considers functional designs non-registrable. The companies also mentioned their problem with enforcement against counterfeited oil filters and spare parts. Because of this, they have had to take extra measures to educate their vendors on the importance of intellectual property, e.g. by embossing trademarks on spare parts. Another major complaint was on the speed in which IP disputes are resolved by the courts: litigation is frustratingly slow. Unfamiliarity with the law on the part of the judiciary resulted in decisions in the industry’s disfavor. To make things worse, law reforms are very slow and do not respond to the industry’s needs.
For the company surveyed in the pharmaceutical industry, Hovid Berhad, the most advantageous reform has been the introduction of the “Bolar” exemption. This enables a company to apply for regulatory approvals early instead of waiting for the patent to expire. It has been active in filing patent applications inside and outside Malaysia (see Table 5). However, the manner in which the Drug Approval Authority processes such applications is sometimes inconsistent with the spirit and intent of the provision and this has led to some dissatisfaction among generic drug producers.
103
IP ownership is a new “culture” for local companies. Pioneering companies in this area are those corporate bodies originally set up by the government such as Telekoms, the Malaysian Palm Oil Board and Proton Berhad. As it stands, the mindset of most companies is on registration not commercialization; with the exception of statutory bodies set up by the government specifically to focus on R&D and commercialization such as the Malaysian Palm Oil Board. This study found that different industries relate differently to the various IP reforms. Therefore it was not possible to identify a single IP reform that would meet the needs of all four industries surveyed.
6. Analysis of the Impact of the IP System on Economic Development Co-integration test and long-run equation analyses were applied to examine the impact of the IP system on Malaysian economic development. Since this study aimed at exploring the long-term effects of three different variables (i.e. IP creation, economic growth and FDI) on IP protection, three different models have been adopted.
[ Impact of the Intellectual Property System on Economic Growth ]
Table 5. IP Filings by Hovid
104
6.1. Establishing the Economic Models The first model to investigate the long-running relationship between the IP protection and IP creation shows: (1) ln(P) = α + γ1*lnR&D + γ2*ln GDP + γ3*ln(IP) + γ4*ln(K) + ε where, ln P = natural logarithm of total number of patents filed ln R&D = natural logarithm of research and development ln GDP = natural logarithm of GDP per capita ln IP = natural logarithm of the IP index ln K = natural logarithm of private capital The second model used to explore the long-running relationship between IP protection and economic growth shows: (2) lnGDP = β1*lnK+ β2*lnL + β3*lnIP+ε
[ Impact of the Intellectual Property System on Economic Growth ]
where, ln GDP = natural logarithm of GDP ln L = natural logarithm of the labor force ln K = natural logarithm of private capital ln IP= natural logarithm of the IP index. Finally, the third model, aimed at examining the long-running relationship between IP protection and FDI shows: (3) lnFDI = α + δ1* lnLF + δ2*ln GDP + δ3*IP+ ε where, ln FDI ln GDP ln LF ln IP
= natural logarithm of FDI = natural logarithm of gross domestic product = natural logarithm of the labor force = natural logarithm of the IP Index
To test the long-running relationships in equations (1), (2) and (3), the Johansen and Juselius (1988, 1990) (JJ cointegration approach) was adopted. The JJ method of co-integration testing was based on the maximum likelihood estimation of the VAR model to determine the number of co-integrating vectors in the analysis. An important additional requirement for implementing the Johansen and Juselius cointegration test was that the variables be non-stationary integrated of the same order. Accordingly, prior to the Johansen and Juselius test, the standard Augmented Dickey-Fuller (ADF), Phillips-Perron (PP) and the KPSS unit root tests
were conducted to determine the order of integration for each variable. Finally, the order of lag incorporated into the equations was selected based on the Akaike Information Criteria (AIC).
105
The Augmented Dickey-Fuller (ADF), Philips-Perron (PP) and KPSS tests showed all the series used in this study to be integrated to the order of one for all models (see Table 6).
Table 6. Results for Unit Root Test at First Difference for 5 percentage level
The JJ co-integration results presented in Table 7 showed that all variables in all models were found to be co-integrated, meaning that a long running relationship existed between the variables.
[ Impact of the Intellectual Property System on Economic Growth ]
Table 7. Co-integration Tests
Note: * represents 5 per cent significance level.
The results of the co-integrating equation for all models are given in Table 8.
106
Table 8. The Co-integrating Equation Results
Notes: Figures in [ ] indicates the t-statistics. A negative sign indicates a positive long-running relationship between the dependent and independent variables.
[ Impact of the Intellectual Property System on Economic Growth ]
6.2. Results of the Analysis The results in Model 1 confirmed that there is a long-running relationship between the number of patents filed and GDP per capita, private capital, IP protection level and R&D. It was found that R&D, the IP index and private investments had a positive long-running relationship with the number of patents filed in the country. However, the long-running relationship between patent filing and GDP per capita appeared to be negative (replacing GDP per capita with nominal and real GDP as explanatory variables did not improve the results). This is surprising given that the patent filing trend was in parallel with the trend in nominal GDP levels. The results in Model 2 showed that in the case of Malaysia, an upper-middle-income country, improvement in the IP standard in the country has positively influenced the growth of GDP in the long term. The results for Model 3 showed a long-running relationship between GDP, the IP index and FDI. However, the correlation between the labor force and FDI inflows appeared to be negative. This could be explained by graduation of the economy to less labor-intensive industrial activities.
7. Discussion and Proposals
107
This study has identified the three major reforms that have impacted on IP creation and economic development. From a comparison of the legal reforms and the trend in IP applications, one could conclude that for some legal reforms, a direct correlation could be made between the reforms and IP filings. In the area of patents, several reforms have contributed to the growth of IP filings. These are Malaysia’s accession to the Paris Convention, introduction of the modified examination system and improved processing of patent applications. Filing trends based on nationality also corresponded to the amount of FDI. From the breakdown of the total number of patent applications according to country of origin from 1986 - 2006, Japan ranked first while the US ranked second. This was consistent with the pattern of FDI inflows: Japan and the US have been among the top three foreign investors in Malaysia for the past decade. In terms of technology, filing trends also corresponded with the level of sales and investment in a particular industry. The emphasis on the electrical and electronics sector in industrial policy could have been the key factor in the substantial growth of patent applications from this area, and it could be attributed to the establishment of the Multimedia Super Corridor project in 1996 and extra funding provided by the government to spearhead IT projects.
The S&T policies have also contributed to the growth of patent applications from local companies. Under the S&T policy, emphasis was placed on accelerating R&D and the amount of money disbursed for R&D has been steadily increased. The continuous support given by the government in financing R&D in universities through the IRPA grant has been a major factor in the increasing growth of patent applications from them since 2000. Patents filed by universities and research institutes increased significantly from an average of 4 per cent of the total applications between 1987 and 2000 to an average of 10 per cent between 2001 and 2006. Fiscal measures introduced by the government in the 1990s have also contributed to a sharp increase in local patent applications. Incentives given to companies such as pioneer status, tax and tariff exemptions, tariff protection and preferential loans assist companies to be competitive. This has given companies the confidence to adopt long term strategies such as involvement in R&D and eventually in filing IP applications. Between 2001 and 2006, the percentage of local applications amounted to 10 per cent of the total and in the first five months of 2007 it rose to 28 per cent. Another contributing factor to the number of patents filed in Malaysia has been its economic performance. There seemed to be a clear correlation between patent applications and this economic performance. During the two recessions in the mid-1980s and 1990s, there was a noticeable decrease in patent applications. This trend reversed as the economy picked up again after 1988 and 2000 respectively. This was further corroborated by the regression analysis where a positive correlation between the number of patent filings and economic growth was found, due to the fact that the more prosperous the economy, the higher the investment in R&D.
[ Impact of the Intellectual Property System on Economic Growth ]
In relation to the four industrial sectors that were identified for the case studies, i.e. IT, manufacturing and equipment, the automobile, pharmaceutical and chemical industries, steady growth in patent grants could be seen. However, the highest number of patents granted was to the pharmaceutical sector, where the rate of growth was phenomenal, from a mere 10 patents in 1989 to 321 in 2006.
108
A high level of foreign patent filing was found in sectors where FDI was the strongest, for example, in the electrical and electronic sub-sector. Similarly, the strengthening of IP protection as reflected in the increase in the IP index has had a positive influence on patent filings. Concerning the impact of IPRs on FDI, the results showed a positive correlation between FDI inflows and the IP index. This implies that stronger IP protection attracts more FDI, which is consistent with our findings in Chapter 4 relating to the pharmaceutical industry where we found that the favorable environment created by the various legal reforms boosted the level of investment.
Proposals 1. To sustain the upward trend in R&D and patenting activities, the present S&T policies should be further augmented so that the process of catch-up from technology-user to technology-producer will be accelerated. 2. In this connection, the present IP awareness campaign conducted by the government should be maintained and intensified. 3. University IP policies, with their reward systems, seem to be instrumental in stimulating the growth of IP creation. Steps should be taken to ensure that such policies are effectively implemented.
[ Impact of the Intellectual Property System on Economic Growth ]
4. Incentives for companies to register their inventions by providing tax exemptions for expenses incurred in IP filing and maintenance should be given. 5. Companies should be exposed to the concept and methodology of IP auditing to be better able to appreciate the true status and value of their IP which may be lying unrecognized and unutilized, to help them tap any potential value. 6. The current standard of IP protection and its administration must be maintained and constantly updated to stay in line with international norms to retain and stimulate further inflow of FDI into countries, particularly in the high-tech industries. 7. To overcome the lack of commercialization, a Technology Transfer Advisory Service (TTAS) under the auspices of the Ministry of Science, Technology and Innovation could be set up to assist in matching the industry’s needs with the innovative products of the various research institutions, thus ensuring optimum commercialization.
References
109
BNM Annual Report (2005), Kuala Lumpur, Bank Negara Malaysia. Eberschlag, R.W. (1994), Intellectual Property Rights, Developing Countries and the Uruguay Round Negotiations, M.A. Thesis, Dalhousie University, Nova Scotia. Economic Report. (2006/2007), Ministry of Finance, Malaysia, Kuala Lumpur: Percetakan Nasional Malaysia Berhad. _______________ (1995/1996), Ministry of Finance, Malaysia, Kuala Lumpur: Percetakan Nasional Malaysia Berhad. Fink, C. and Maskus, K.E. (2005), Intellectual Property and Development: Lessons from Recent Economic Research, The World Bank and Oxford University Press: Washington. Firestone, O.J. (1971), Economic Implications of Patents, Ottawa: University of Ottawa Press. Frischtak, C.R. (1989), The Protection of Intellectual Property Rights and Industrial Technology Development in Brazil, World Bank Industry Series Paper No.13, Washington D.C., The World Bank. IMP3 (2006), Third Industrial Master Plan 2006-2020: Malaysia – Towards Global Competitiveness, Ministry of International Trade and Industry, Malaysia, Kuala Lumpur.
Mansfield, E. (1994), Intellectual Property Protection, Foreign Direct Investment and Technology Transfer, International Finance Corporation Discussion Paper No.19, Washington D.C., The World Bank. Maskus, K.E. (2000), Intellectual Property Rights in the Global Economy, Institute for International Economics, Washington D.C. MATRADE (2007). Malaysia’s Trade Performance in 2006. http://www.matrade.gov.my/matrade/matrademedia012007.htm. Retrieved 8/6/07. MIDA’s Media Statement and the Performance of the Manufacturing and Services Sectors 2006, February 13, 2007, http://www.mida.gov.my. Retrieved 14/6/07. Narayanan, S. and Yew-Wah, Lai. (2005), The Causes and Consequences of Immigrant Labor in the Construction Sector in Malaysia, International Migration, Vol. 43, Issue 5, 31-57. OECD (1989), Economic Arguments for Protecting Intellectual Property Rights Effectively, Paris. Penrose, E.T. (1973), International Patenting and Less Developed Countries, Economic Journal, pp.768-785. Poon, W.C. (2004), The Development of the Malaysian Economy, Malaysia, Pearson, Prentice Hall.
[ Impact of the Intellectual Property System on Economic Growth ]
Lall, S. and Streeten, P. (1977), Foreign Investment, Transnationals and Developing Countries, Boulder, Westview Press.
110
Primo Braga, C.A. (1990), The Developing Country Case for and against Intellectual Property Protection in Strengthening Protection of Intellectual Property Protection in Developing Countries, see Siebeck W. (ed.). Rasiah, R. (2002), Manufactured Exports, Employment, Skills and Wages in Malaysia, Employment Paper of the International Labour Organization, 2002/35. 7MP (1996), Seventh Malaysia Plan 1996-2000, Economic Planning Unit, Prime Minister’s Department, Kuala Lumpur, http://www.epu.jpm.my. Retrieved 3/6/07. 8MP (2001), Eighth Malaysia Plan 2001-2005, Economic Planning Unit, Prime Minister’s Department, Kuala Lumpur, http://www.epu.jpm.my. Retrieved 3/6/07. 9MP (2006), Ninth Malaysia Plan 2006-2010, Economic Planning Unit, Prime Minister’s Department, Kuala Lumpur, http://www.epu.jpm.my. Retrieved 3/6/07. United Nations (1993), Intellectual Property Rights and Foreign Direct Investment, New York, United Nations. UNCTAD (1986), Periodic Report 1986: Policies, Laws and Regulations on Transfer, Application and Development of Technology, United Nations.
[ Impact of the Intellectual Property System on Economic Growth ]
http://www.hovid.com.my http://www.ftec.com.my http://www.motorola.com http://www.tm.com.my
Impact of the Intellectual Property System on Economic Growth Vietnam Mai Phuong Nguyen*
111
1. Introduction 1.1. Outline of the Present IP System 1.2. Outline of the Present Economic Situation 2. Survey on Reforms toward IP-Based Economic Development 2.1. Brief History of Intellectual Property Laws and Policies in Vietnam 2.2. Identification of Reforms toward IP-Based Economic Development 3. Case Studies on Companies utilizing the IP System to Develop Business or Increase Economic Activity 3.1. Comparison of Company Data in Major Industrial Fields 3.2. Results of the Analysis 4. Analysis of Reforms that exerted Influence on Economic Development underpinned by the IP System using Economic Models 4.1. Impact of Economic Variables on IP Creation 4.2. Impact of the IP Regime on Economic Growth 4.3. Impact of the IP Regime on Foreign Direct Investment 4.4. Notes on Technical Issues 5. Discussion and Proposal References
1. Introduction
On 29 November 2005, the National Assembly enacted a new law on intellectual property. Before that, under the Civil Code, there were only provisions on patents, utility solutions, industrial designs, trademarks and appellations of origin: protection of other IPRs was stipulated in several documents issued by the government. In addition to the type of IPRs covered by the Civil Code, the IP law of 2005 included provisions on circuit layout, geographical indications, unfair competition, trade names and trade secrets. Enforcement of IPRs is considered to be the weakest point in Vietnam’s current IP protection system; therefore, the IP law has devoted the whole of Part V to dealing with this matter. Under this law, there are several government decrees providing guidelines for its implementation, e.g. Decree 106/2006/ND-CP on administrative measures dealing with IP infringements; Decree 105/2006/ND-CP on the state management of IP, etc. The Ministry of Science and Technology (MOST) is the relevant authority for managing IP in Vietnam. MOST cooperates with other ministries and authorities to draft detailed guidelines for the implementation of IP law and government decrees. The National Office of IP (NOIP) under MOST is in charge of implementing management activities related to intellectual property. However NOIP is only in charge of industrial property and general matters: other issues related to copyright are managed by the National Copyright Office under the Ministry of Culture, Sport and Tourism. The Office for the Protection of New Plants and Seeds under the Ministry of Agriculture and Rural Development oversees new plant varieties. *
The able assistance of Nguyen Vo Hung and Tran Ngoc is gratefully acknowledged. The views expressed in this report are those of the author and do not necessarily reflect those of the WIPO Secretariat or any of its Member States.
[ Impact of the Intellectual Property System on Economic Growth ]
1.1. Outline of the Present IP System
112
Besides the provisions stipulated in this IP law, other laws and regulations also set out provisions, such as the Criminal Code (1999), the Science and Technology Law (2000), the Customs Law (2001), the Trade Law (2005), the Investment Law (2005), the Technology Transfer Law (2005), etc., related to intellectual property. Regarding international treaties, Vietnam is a member of most important conventions such as the Stockholm Convention, the Paris Convention, the Madrid Agreement, the PCT, the Berne Convention, TRIPS, the Rome Convention and the Lahay Convention. Vietnam has also signed bilateral agreements which include a section relating to intellectual property with several countries such as that between Vietnam and the US.
1.2. Outline of the Present Economic Situation
[ Impact of the Intellectual Property System on Economic Growth ]
In 1986, Vietnam started the transition from a centrally planned to a market economy. Much effort has been made to reform economic policies and certain strategies have been implemented. As a result, Vietnam can point to many positive achievements: GDP per capita is continuously increasing from under 100 US dollars in the late 1980s to nearly 700 US dollars in 2005. The growth rate of GDP turned in a very good performance; 8 per cent in 2005 (see Fig. 1).
Fig. 1. GDP per capita (USD) Source: GSO
Since 1987, Vietnam has been very successful in attracting FDI (see Fig. 2). With the advantage of proximity and cultural similarity, businesses from neighboring countries such as Japan, Singapore and South Korea arrived in Vietnam soon after the start of its open-door policy. These countries alternate among the top rank of FDI in Vietnam. Although foreign companies employed fewer than 1 per cent of the total workforce, taken together they accounted for around 27 per cent of the country’s non-oil exports and 35 per cent of the country’s total industrial output; constituted almost 13 per cent of Vietnam’s GDP and contributed around 25 per cent of total tax revenues: Vietnam is ranked third in attracting FDI in Southeast Asia. Thus, FDI is turning to Vietnam despite the global downturn and fierce competition worldwide (Vietnam Investment Review, 2001). There is no clear indicator: however, foreign companies are believed to have a better understanding than local companies of the importance of IPRs.
113
Fig. 2. Number of FDI Projects Source: GSO
Fig. 3. Gross Industrial Output Source: GSO
In 2006, Vietnam succeeded in its negotiations with the WTO and became a member. This opened a new phase of economic and social development for the country; however, along with opportunities, there have been many challenges that must be overcome and strengthening IPRs is one of the measures needed to be taken in order to meet these new challenges.
[ Impact of the Intellectual Property System on Economic Growth ]
Since 1995, gross industrial output has dramatically increased although before then it was very low. This increase appears in almost every industry, e.g. chemicals, manufacturing, transport, equipment assembling and repairing. Computer and office equipment is new to Vietnam but it has contributed to the increase in the total gross industrial output since 2000.
114
2. Survey on Reforms toward IP-Based Economic Development 2.1. Brief History of Intellectual Property Laws and Policies in Vietnam In 1981, Decree number 31-CP on innovations for technical improvement, production rationalization and inventions was issued. This document provided the first regulation relating to intellectual property in Vietnam. Later, from 1982-1988, more regulations were issued on trademarks, industrial designs and utility solutions.1 According to these regulations, measures for the protection of industrial property were mainly of an administrative nature. In this period, patents were protected in two ways: the inventor certificate and an exclusive patent on invention. The use of the inventor certificate (an appropriate form of protection for a centrally planned economy) was encouraged, whereas exclusive patents for inventions were mainly granted to foreigners.
[ Impact of the Intellectual Property System on Economic Growth ]
In 1989, the Ordinance on the Protection of Industrial Property was approved by the State Council.2 Under this Ordinance, the regulations conferred stronger legal protection than those under the decrees. For the first time, the concept of industrial property was used in a legal document. Apart from the four types of industrial property (inventions, utility solutions, industrial designs and trademarks) protected according to separate decrees issued earlier, the Ordinance stipulated the protection of appellations of origin in order to promote the creation of original products from specific areas, regions or localities. The measures and remedies for protection of industrial property rights were also broadened. The court system then had legal grounds for enforcement of industrial property rights. One of the important points mentioned in the Ordinance on the protection of these rights was the change in the principles for the protection of inventions, where the form of protection by granting an inventor certificate was abolished and the only form of protection that remained was granting an exclusive patent on invention. This was considered an important milestone in the development of the industrial property protection system in Vietnam, compared with other socialist countries at that time. Early in 1995, Vietnam filed an application for membership of the WTO. At this time, the industrial property protection system functioned mainly on the basis of “under-law” documents.3. In comparison with TRIPS, at the time when Vietnam filed its application for accession, its industrial property system was not in compliance with the provisions of that Agreement. Therefore, Vietnam developed an IPRs Action Plan whose overall objective was to make the Vietnamese IP system fully compliant by January 1, 2000.4 The first important step in implementing the Action Plan was the promulgation of the Civil Code in 1995, where Part VI addressed IPRs and technology transfer. The Civil Code constituted the highest legal organ for comprehensively implementing industrial property activities and it was a major turning point in Vietnam’s history of the protection of industrial property. From 1996-2001, a number of under-law documents were issued to provide guidance for the implementation of the Civil Code as well as additional regulations on other matters such as trade secrets, geographical indications and trade names, protection of industrial property, unfair competition. However, the IP system is still not fully compliant with the TRIPS requirements. Therefore, the National Assembly decided to continue improving the legislative framework through measures to promote creative activities and enhance the competitiveness of the economy. In 2005, it approved the new Civil Code whose Part VI provided for basic civil aspects of the IPS (owners, subject matter, contents, grounds for 1 2 3 4
These regulations were issued as “decree” forms – the documents issued by the government. The Ordinance relating to copyrights was approved by the State Council in 1994. The Ordinance on the Protection of Industrial Property (1989) and the Ordinance on the Protection of Copyrights (1994). The deadline for developing countries or countries in transition to comply with the requirements of TRIPS.
establishing IPRs, licensing and assignment of IPRs). Thus, in comparison with the Civil Code 1995, IP provisions in the Civil Code 2005 have been edited and consist of core provisions for regulating civil matters concerning IP assets.
115
On November 29, 2005, the National Assembly enacted the Intellectual Property Law composed of six parts, 18 chapters and 222 articles. The provisions of this law fully comply with TRIPS and its enactment was a milestone, marking 10 years of effort by Vietnam to prepare for the implementation of its obligations to the WTO.
2.2. Identification of Reforms toward IP-Based Economic Development The first regulations in 1981 relating to invention protection (Decree 81) can be considered as one of the most important reforms in the history of IP law in Vietnam. As this is the first time invention protection had been regulated under a legal document, these regulations were issued by the government.
In 1995, Vietnam filed its application for membership of the WTO. In order to fulfill the requirements of TRIPS, IP regulations were incorporated into the Civil Code in 1995. This was a major reform as it was the first time IP regulations had been included in such an important legal document, approved and issued by the National Assembly. It was an acknowledgment that the State was aware of the importance of intellectual property to development. However, there was little evidence of any concrete effect of this reform on economic growth and although the number of patent applications by foreigners increased, other applications changed little (see Table 1 and Fig. 4). In 2005, the issuance of a new and separate IP law constituted a remarkable reform in the history of IP laws and policies. Though this law was implemented on July 1, 2006, a sharp increase in the number of applications began in 2005. In comparison with 2004, they increased by more than 24 per cent. However, in order to make an exact evaluation on the impact of the IP law of 2005, we need to wait a few more years; although there is no doubt that this has been the most remarkable IP law reform in Vietnam.
Fig. 4. Trend in the Filing of Patent Applications (Source: NOIP)
[ Impact of the Intellectual Property System on Economic Growth ]
In 1986, the Doi Moi economic reform was started in Vietnam. To attract FDI, the State decided to amend its policies in order to create a good business environment. The issuance of an Ordinance on Industrial Property in 1989 was considered an important move to attract foreign investment. This was also considered as a reform in the history of IP laws and policy in Vietnam. The Ordinance incorporated scattered regulations from several decrees and put them in a more binding legal document. After this reform, the number of patent and industrial design applications increased markedly (see Table 1).
116
There were also several technical reforms that helped to improve IP activities in the country in 2005. For NIOP’s technical activities, the use of new technology, the result of the “Modernization of the Industrial Property Administration Project” sponsored by the Government of Japan has been put into operation. As a result, the number of applications processed in 2005 increased by 25 per cent over 2004. This could be considered as a technical reform that might result in increasing the number of patents granted every year. Also in 2005, there was a program to support enterprises and creators with regard to information, legal understanding, and developing, exploiting and managing methodology. One of the positive advances made is that the number of IP assets in Vietnam increased, as well as the number of Vietnamese inventions and utility solutions: applications increased in 2005 by nearly 80 per cent over 2004.
[ Impact of the Intellectual Property System on Economic Growth ]
Table 1. IP Applications from 1990 to 2005
Source: NOIP, 2005.
In general, from the beginning of the development of IP laws and policies in Vietnam, there have been several reforms that could have impacted on the development of the economy. However, as its development and growth depended on certain policies and strategies, it is difficult to evaluate the impact of IP laws and policies only. It could be said that the most important IP reforms occurred in 1981, 1989, 1995, and 2005. The 2005 reform especially is expected to have a remarkably positive impact on economic development; however, it is still too early to evaluate its effects.
3. Case Studies on Companies utilizing the IP System to Develop Business or Increase Economic Activity 3.1. Comparison of Company Data in Major Industrial Fields 3.1.1. The Pharmaceutical Industry By the end of 2005, there were around 170 enterprises manufacturing allopathic medicines in Vietnam, including some 15 foreign companies. There were around 300 other enterprises producing traditional
medicines. According to the WHO category, the pharmaceutical industry is now at the level of 2.5-3.5 However, the technological capacity of Vietnamese pharmaceutical companies is still limited. Up to now, only 59 companies (33 per cent) have shown GMP (good manufacturing practices). R&D capacity of the companies is also still weak; they are mostly based on imported technology (Cao Minh Quang, 2005). Therefore, their IP activities are mainly concerned with trademarks, brand names and some industrial designs: there are few inventions and patents in this area. We chose Traphaco, one of the leading pharmaceutical companies for the case study in this sector. Traphaco manufactures both traditional and allopathic medicines. The company produces about 170 products including 60 traditional medicines and 110 allopathic medicines. Their traditional medicines are their best-known products and represent 80 per cent of their profits.
117
3.1.2. The Automobile Industry
3.1.3. The Manufacturing Industry Both pharmaceuticals and automobiles are classified under the manufacturing sector. This sector plays a leading role in the growth of GDP in Vietnam. In order to study the manufacturing sector in general, we chose the two following cases. The first is Duy Loi, a private company established in 2000. Its major product is a hammock with a metal support. The company is very successful in the domestic market and it also exports to Australia, Japan, Korea and the US: It is also a private company, established in 1994. Sannam operates mainly in the machine sector and produces metal-working machines and equipment. Recently, it extended its operations to other sectors such as food processing, restaurants, etc.
Comparison of Case Studies Ownership of the two automobile companies is 100 per cent foreign. The pharmaceutical company (Traphaco) was a state-owned company until 1999 then it became a joint stock company (according to State policy for State-owned companies). Other companies in the manufacturing sector (Duy Loi and Sannam) are private companies. Duy Loi is a small firm but the others are large enterprises in Vietnamese terms.6 Traphaco has 797 employees including 18 masters of pharmacy; 140 pharmacists and doctors; 60 employees with bachelor degrees in science and economics and the rest are skilled workers. 5
Level 2 means the industry has the capacity to produce several kinds of generic medicine; most other medicines have to be imported. Level 3 means that the industry has the capacity to produce generic medicines and also export several kinds of medicine.
6
Small and medium-sized enterprises are firms that have fewer than 300 employees and capital is less than 10 billion VND (approx. 625,000 US dollars).
[ Impact of the Intellectual Property System on Economic Growth ]
The motorcycle market in Vietnam has grown briskly since 1999. Between 1999 and 2002, it increased almost six fold. Measured by the number of vehicles produced, Vietnam now ranks eighth in the world’s motorcycle market. Motorcycle manufacturers can be divided into two groups: foreign joint ventures such as Honda, Yamaha, Suzuki, and Taiwan’s Sayang Motor (whose Vietnamese subsidiary is called SYM or VMEP) on the one hand and Vietnamese domestic manufacturers on the other. Most of the local companies entered the market by importing and assembling components from China. In the rapidly expanding Vietnamese market, FDI and domestic companies have competed fiercely and their relative market shares have fluctuated greatly. The choice of business practice has had a direct effect on the competitiveness of these companies. Honda Vietnam and Vietnam Manufacturing and Export Processing Company Ltd (VMEP) are cases studied in this research. VMEP was the first FDI company to invest in Vietnam’s motor industry. This is a 100 per cent Taiwanese-owned enterprise, which obtained an investment license in 1992 and started production in 1994. Honda Vietnam was established in 1996 and started operations in 1997.
118
The company’s R&D unit has 19 employees and there is a vice-director in charge of IP-related issues. VMEP has a total of 1649 employees, among whom there are 68 R&D employees (4.1 per cent) and three employees in charge of IP activities. Honda Vietnam has more than 1000 employees and does not have an R&D unit in Vietnam. The company hires a law consultancy to deal with IP-related issues. Duy Loi is a small company and has around 100 employees. The director is the company’s major designer. A law consultancy is also hired by the company for IP-related issues. Employees of the Sannam group total more than 400. The company has a well-staffed R&D department especially for design: however, there are only two employees including the general director in charge of IP activities. In general, all the companies studied, with the exception of Honda, have their own researchers or designers for R&D activities. However, not all of them have a dedicated IP unit; they usually use the services provided by consultants. In 2005, the pharmaceutical firm had only made one application for IP protection (trademark registration). From 2006 to date, it has been preparing for several utility solution applications. Most of the company’s IP applications have so far been trademark registrations (114 trademarks registered from 1989-2005). This reflects the weak R&D capacity of the company as well as the pharmaceutical sector in Vietnam as a whole. The automobile sector has painted a more positive picture of IP application.
[ Impact of the Intellectual Property System on Economic Growth ]
VMEP has recently applied for four patents (2006), 14 industrial designs (2007) and three trademarks (2007). In total, from 1993-2006, VMEP applied for 140 patents, 63 of which have been granted. In 2006, Honda owned 46 patents, 30 industrial designs and five trademarks, granted by and registered at the Vietnam National IP Office. However, all applications are made by head office in Japan and it also owns the patents granted. The number of patents applied for and granted to Honda in Vietnam from 19942006 is huge, about 533 patents, 214 industrial designs, 114 trademarks. Duy Loi, a small domestic manufacturer in Vietnam has made fewer IP applications than other companies. From 2000-2006, it made 19 applications for patents with eight granted, four applications for industrial designs with one granted and three trademarks registered. Although this is not a large number, the patents are very important ones and have helped them to earn good profits. The other domestic manufacturing company - Sannam has also had some important patents granted. From 2002-2006, the company was granted three patents for industrial designs and 64 trademarks were registered. In general, the case studies in the automobile sector have many more applications for patent, utility solutions and industrial designs. Other companies in the manufacturing sector (including pharmaceuticals) have only made a few applications on patents and designs, their IP applications being mainly limited to trademark registration.
3.2. Results of the Analysis Three companies were established before the 1995 reform: however, it is noteworthy that three years later, the number of applications for patents had not measurably increased. It was only five years later (since 2000) that this number started to increase markedly. Traphaco, a long-established pharmaceutical company, only latterly started to pay attention to IP. The local company case studies showed that firms established more recently like Duy Loi and Sannam are more interested in IP issues than Traphaco (see Table 2). Another point in the case of Duy Loi is that, since the start, a patent for industrial design is essential to its business. However, Duy Loi is only one of a number of small, local firms that is aware of the importance of IP protection. The two FDI motorcycle companies show that they are more active in IP protection:
their IP applications are much higher than other local companies. In fact, FDI companies are generally likely to pay more attention to IP issues than local companies. Local companies, especially small and medium-sized enterprises are usually weak in R&D activities, not often having an R&D unit; therefore there is little IP-creation and protection activity. In addition, local firms in general lack knowledge and awareness of the importance of intellectual property (NISTPASS, 2006).
119
However, in this research, all the companies studied were more or less aware of its importance. Each company had at least one or two employees in charge of IP activities. Moreover, they are able to use consultancy services provided by law firms for their IP activities including patent applications as well as pursuing lawsuits. There are more and more law firms practicing IPR law in Vietnam; however, they are more familiar with trademarks than patents and related issues. It is also noteworthy that all the cases studied have at some time been faced with IP infringement. The two motorcycle companies’ industrial designs and trademarks, especially those of Honda, have been infringed by several local companies. Many of trademarks have also been infringed by other local pharmaceutical companies. Sannam experienced difficulties when one of its Chinese partners infringed its trademark, in addition to other local instances of infringement. Duy Loi has succeeded in two lawsuits in Japan and the US relating to industrial design infringement. The company has also experienced difficulties brought about by competitors in the domestic market.
Source: NOIP
In the case studies in general, companies in the automobile sector have shown they are more active in IP creation and protection than companies in other sectors. Large enterprises have more IP assets than small and medium-sized enterprises. This has also happened in the case of FDI companies in comparison with local companies. In all the cases studied, IP assets have shown the vitally important contribution they make to the company’s performance. However, in no case is there clear evidence about economic growth resulting from IP reform in 1995 or, indeed, any other reform. Companies look forward to further IP reforms in the future, especially enforcement of the 2005 IP Law.
[ Impact of the Intellectual Property System on Economic Growth ]
Table 2. Number of IP Applications of Companies Studied, 1993-2006
120
4. Analysis of Reforms that exerted Influence on Economic Development underpinned by the IP System using Economic Models
4.1. Impact of Economic Variables on IP Creation The Model The following model is used to evaluate the impact of key economic variables on IP creation: patentapp = A.rdexpenγ1. gdpγ2. fdiγ3 where: patentapp is the number of annual patent applications rdexpen is the national annual expenditure on R&D gdp is the annual gross domestic production fdi is the annual foreign direct investment capital A is a coefficient which includes all the other variables not expressly represented in the mode To estimate the parameters of the above model, we used the following log-linear regression model. Regression Model 1:
[ Impact of the Intellectual Property System on Economic Growth ]
ln(patentapp) = nA + γ1*ln(rdexpen) + γ2*ln(gdp) + γ3*ln(fdi) + index + ε Index is a dummy variable which represents an improvement in the IPR regime in Vietnam. We constructed this index by dividing the patent index of Vietnam (taken from Ginarte and Park’s IP Index and calculated by us using the G&P method) into two categories: low IP protection and medium IP protection. Index in the regression model has been included to evaluate the impact of the improvement in the IPR regime on IP activities. Using available data from 1990-2005 (16 observations) we obtained the following regression results. Model 1 ---------------------------------------------------------------------------------------------------------------lnpatentapp | Coef. Std. Err. t P>|t| Beta ----------------- + -----------------------------------------------------------------------------------------lnrdexpen | .0339058 .262881 0.13 0.900 .0270908 lngdp | .1078442 .5329146 0.20 0.843 .0783017 lnfdicapital | .4529604 .1962081 2.31 0.041 .4351154 index | 1.201064 .3565814 3.37 0.006 .4945089 _cons | 1.099507 1.637403 0.67 0.516 . ---------------------------------------------------------------------------------------------------------------R-squared
= 0.9656
Adj R-squared = 0.9531
The regression result shows that only lnfdicapital and index are significant at the 5 per cent and 1 per cent levels; other variables are not significant but R-squared is very high. This result might reflect the fact that the majority of patent applications in Vietnam are made by foreign firms or parent companies of local firms, so the higher FDI flows into Vietnam; the greater the expected IP activity. The index variable is significant and this supports the argument that an improvement in the IPR regime will encourage IP activity.
lnrdexpen and lngdp performed very badly in our model, but this should not be considered as calling into account the theory; the problem lies with the data. For GDP, there was a serious multi-co linearity problem between lngpd and lnfdicapital since, a large proportion of GDP is contributed by FDI inflows. With regard to R&D expenditure, available data only represents government expenditure on R&D and as is common practice in Vietnam, data is not purely expenditure on R&D but is also contained in expenditure on other S&T activities. This, plus the fact that domestic IP activities account for only a small proportion of those of foreign firms, it is not surprising to see the poor performance of lnrdexpen in the above model.
121
To see whether R&D expenditure could have any impact on domestic patent activities, we ran another regression model using the number of patent applications by Vietnamese companies as a dependent variable and removed FDI capital from the list of independent variables, which gave the following result. Model 2 ---------------------------------------------------------------------------------------------------------------lnpatentapp | Coef. Std. Err. t P>|t| Beta ----------------- + -----------------------------------------------------------------------------------------lnrdexpen | 1.016579 .4860091 2.09 0.058 1.625701 lngdp | -.9603204 .7714253 -1.24 0.237 -1.39554 index | .4580017 .679908 0.67 0.513 .3774216 _cons | 4.006025 2.794791 1.43 0.177 . ---------------------------------------------------------------------------------------------------------------R-squared
= 0.4380
Adj R-squared = 0.2975
In an effort to use other indicators than patent applications for IP activity, we have used patents granted as dependent variables in our model; however the result was very disappointing. Our problem was not having a consistent estimate of the time lag between applications for and grants of patents: it varies from case to case. Without this, we are unable to make a logical link between the number of patents granted and economic variables.
4.2. Impact of the IP Regime on Economic Growth The following regression model is used to estimate the impact of the IP regime on economic growth: ln(gdp) = lnA + β1*ln(privatecap) + β2*ln(population) + index + ε where: privatecap means private capital population an estimate of the labor force gdp and index represent the same variables as in the above models The results show that lnprivatecap and index are significant while lnpopulation is not. The good performance of index in the model implies that an improvement in IP regimes does have some impact, albeit moderate, on economic growth.
[ Impact of the Intellectual Property System on Economic Growth ]
Although not significant at the 5 per cent level, lnrdexpen is significant at the 10 per cent level, giving the best result of all the models we used. Once again, it might be an implication of potential error in the data for R&D expenditure.
122
Model 3 ---------------------------------------------------------------------------------------------------------------lnpatentapp | Coef. Std. Err. t P>|t| Beta ----------------- + -----------------------------------------------------------------------------------------lnprivatecap | .7829862 .1332327 5.88 0.000 .8451091 lnpopulation | -.1806433 1.828371 -0.10 0.923 -.0156284 index | .351447 .0975583 3.60 0.004 .1992936 _cons | 2.748122 11.08847 0.25 0.808 . ---------------------------------------------------------------------------------------------------------------R-squared
= 0.9889
Adj R-squared = 0.9861
4.3. Impact of the IP Regime on Foreign Direct Investment To examine the impact of the IP system to FDI, we used the following log-linear regression model: ln(fdicapital) = lnA + δ1*ln(gdp) + δ2*ln(population) + index + ε The regression result is presented below:
[ Impact of the Intellectual Property System on Economic Growth ]
Model 4 ---------------------------------------------------------------------------------------------------------------lnpatentapp | Coef. Std. Err. t P>|t| Beta ----------------- + -----------------------------------------------------------------------------------------lngdp | 2.755133 .3058519 9.01 0.000 2.082441 lnpopulation | -18.02521 3.302611 -5.46 0.000 -1.178698 index | .0472564 .2145329 0.22 0.829 .0202546 _cons | 104.774 19.64115 5.33 0.000 . ---------------------------------------------------------------------------------------------------------------R-squared
= 0.9724
Adj R-squared = 0.9654
While lngdp was highly significant, other variables performed poorly. Index was insignificant and although lnpopulation was significant, the coefficient sign was negative, contradicting traditional theory.
4.4. Note on Technical Issues Data There are many factors affecting these regression results. First, the number observed was quite small. Data for key variables were only available from 1990-2005 so there were only 16 observations in total, which produced limited results. Second, Vietnam’s IP country index has not varied over time; there were only three values for this variable according to three periods: 1990-1994, 1995-2000 and 2001-2005. The index for 1995-2000 was provided by the Ginarte and Park IP Index; that for the other two periods we have had to calculate ourselves, based on their method. This has forced us to create an index as a dummy variable and use it in our regression model. Third, there are many other factors considered to have had an effect on the IP system and vice versa.. However, given the poor collection of statistics, few data are available for analysis. These weaknesses mean that we have to use care when interpreting the regression results.
The Impact on IP Creation
123
In Vietnam, most R&D activity is conducted by public R&D organizations (R&D institutes and universities) with funds from the State budget. However, the number of patent applications by these organizations is very low compared with the total number of applications. (Vietnamese applications only counted for about 9 per cent of the total and the number of applications from R&D organizations only counted for 1-2 per cent of Vietnamese applications, NOIP, 2005.) Unfortunately, R&D expenditure by the industrial sector is not available for analysis. It is believed that domestic enterprises are inactive in R&D and their expenditure on it is zero. This supports our findings: R&D expenditure does not have a strong relationship to patent applications.
The Impact on Economic Effects In Vietnam, patent licensing is not used. Few of the technologies transferred to the industrial sector are by means of patent licensing. Home-grown technologies, if any, are mainly developed by local R&D organizations and enterprises and they do not usually meet the requirements for IP protection. Moreover, imported technologies embedded in equipment and machinery dominate patent licensing. These limitations resulted in the low number of patent licenses and the limited effect on the performance of the economy.
The Impact on FDI
5. Discussion and Proposal In recent years, the IP system in Vietnam has been continuously improved and at present it is compatible with international regimes. However, it is very hard to evaluate its real impacts on the economic growth of the country. In the case of Vietnam, it is difficult to find clear statistical evidence as well as evidence of economic regression to demonstrate this. One reason is that as well as IP policies, there are also many other economic policies that are important in encouraging economic development. These policies may even result in improving IP activity. Therefore, it is very difficult to separate IP policy to evaluate its impact on economic growth or development. Especially in the case of Vietnam, the impact of IP on economic growth is relatively weak and ineffective for many reasons. First, public awareness and understanding of intellectual property is not in general very high. Second, IP creation capacity is weak. In the industrial sector, due to weak capacity and inappropriately invested R&D capacity, the number of patents, utility solutions and industrial designs is very low. At present, enterprises pay more attention to creating and applying for trademark protection than creating other IP assets such as patents or designs. Third, IP law enforcement is weak. There is a high level of infringement in the local market with light or no penalties for the violators. The legal system is still unfamiliar with civil and criminal lawsuits relating to IP matters. In general, the IP system in Vietnam up to 2005 has not had much impact on the development of the economy and society in general. Although the results of the regression model have somehow shown that
[ Impact of the Intellectual Property System on Economic Growth ]
There have been many reforms in economic policy in order to attract FDI, including reform of IPR laws and policies. In fact, FDI has had a more positive impact on the Vietnamese IP system than the reverse. In many cases, patents are licensed from parent companies to their affiliates in Vietnam. Patent applications and licenses for foreign companies were much higher than the figure for local companies (NOIP, 2005). However, data analysis and statistics show that the IP system has had a moderate impact on the growth and performance of the foreign sector. Enforcement of IP laws and policies is relatively weak and many FDI companies are victims of IP infringement.
124
the improvement of the IP regime in 1995 has had a positive impact on IP activity, the country still needs more incentives and policy measures to encourage creation of IP as well as application for its protection. This picture may be brighter in the future as various policies and incentives on this issue have been implemented. If it is difficult to examine the effect of IP on the economy in general, however, there are other ways to prove its importance on company performance. Indeed, there are many specific cases that can show the strong and significant relationship between the IP system and business performance. A series of case studies on companies successful in IPR activity could be carried out in order to share experience and lessons, especially for developing countries. In evaluating the impact of IP on economic growth It would also be possible to conduct a survey of a specific sub-sector/industry or a specific field such as export activity or attracting FDI.
[ Impact of the Intellectual Property System on Economic Growth ]
Export indicators can be analyzed to discover the impact of IP on the performance of exports. In some countries such as China, the IP system seems to have a clear impact on its export performance, especially for high-tech products. Most Vietnamese exports are of primary goods and materials; therefore IP might not have a strong impact on export activity. However, many cases show that IP assets, especially trademarks, are very important to a company when it wants to enter overseas markets. In order to examine the impact of the Vietnamese IP system on FDI, several related research projects and surveys have been conducted. One of the NISTPASS surveys was carried out with foreign companies in the field of motorcycle manufacture. The survey showed that FDI companies do pay attention to IPR issues, especially large companies like Honda, Yamaha, etc. Their industrial designs are frequently infringed and they have faced many difficulties in trying to counter this problem, given the weak enforcement of IPRs in Vietnam (NISTPASS, 2006). Another survey of FDI companies in different fields found that IPRs did not much feature on the list of concerns of FDI companies when they decided to invest in Vietnam (Nguyen, 2004). However, no specific research has yet been done on the impact of the IP system on business. Therefore, a research project to investigate the linkage between FDI and intellectual property may be another option for the future.
References ADB (2006), Entrepreneur - The Road to Success. M4P. Hanoi. Cao Minh Quang (2005), Vietnam Pharmaceutical Industry-Opportunities and Challenges. Hanoi. Nguyen, H.T., Nguyen, H.V., & Meyer, K.E. (2004). FDI in Vietnam, in S.Estrin & K. E. Meyer (Eds.), Investment Strategies in Emerging Economies. Cheltenham, UK, Elgar. Meyer, K.E., Tran, Y.T.T., Nguyen, H.V. (2006), Doing Business in Vietnam. Thunderbird International Business Review, Volt 48 (2) 263-290. March-April 2006. NISTPASS, 2006, Learning via Networking with Multinationals: Closing the Knowledge Gap in a Small Developing Economy. A Study of the Vietnamese Auto-Motor Industrial Sector, Research Working Report, IDRC, 2006. Ministry of Science and Technology (MOST, 2005), Science and Technology Indicators, Hanoi. National Office of Intellectual Property (NOIP, 2005), Annual Report 2005, Hanoi. General Statistic Office, www.gso.gov.vn.
Institutional Infrastructure for IPR-Based Development in Asia General Report Sadao Nagaoka and Kazufumi Yaji*
127
Introduction 1. Patent Applications 2. Numbers of Researchers and Numbers of Applications per Researcher 3. Patent Applications and Characteristics of National Economies 3.1. Domestic Patent Applications 3.2. Foreign Patent Applications 4. Numbers of Patents Granted 5. Requests for Examination 6. Utility Models 7. Foreign Patent Applications 8. Patent Applications in All Fields of Technology 8.1. All Fields of Technology in Each Country 8.2. Patent Application Structure by Area of Technology 9. Fee Levels and Structure7 10.Databases (Information Systems: Digitalization of Patent Documents) 11.Conclusions
Protecting intellectual property rights (IPRs) has become increasingly important worldwide. With the rapid development of technology and the global trade in technology rights, filing patent applications and obtaining patent rights in many countries has become important for firms and inventors: the number of patent applications in Asian countries in particular has been increasing recently, hence the importance of understanding their IP environment. In this project, researchers from China, Japan, Korea, Singapore and Thailand each submitted a national report containing the results of their work conducted on basic national patent data, together with an analysis of the patent systems in their respective countries. In this report, we have selected the following data for comparison and analysis: (a) numbers of patent applications, (b) numbers of domestic patent applications, (c) numbers of researchers, (d) numbers of patents granted, (e) rates of patents granted, (f) numbers of utility models, (g) numbers of patent applications in all areas of technology, (h) fee systems relating to patent rights and (i) databases in each country. In addition, certain data were collected from the World Development Indicators (WDI) database and analyzed. We conclude with a proposal for an institutional infrastructure for IPR-based development in Asia. This report is not a synthesis of the national reports and the conclusions are also separate.
*
The able assistance of Yung-yun Tsai is gratefully acknowledged. The views expressed in this report are those of the authors and do not necessarily reflect those of the WIPO Secretariat or any of its Member States.
7
Small and medium-sized enterprises are firms that have fewer than 300 employees and capital is less than 10 billion VND (approx. 625,000 US dollars).
[ Institutional Infrastructure for IPR-Based Development in Asia ]
Introduction
128
1. Patent Applications Figs 1 and 2 show the numbers of patent applications (on a logarithmic scale) for all five countries over the past two decades (total and domestic applications), from which we can see that in all countries they increased in this period and, with the exception of Japan, they increased substantially. In Singapore, patent applications increased suddenly in 1996, caused by changes in the patent system. In China, growth accelerated in 2000 and has remained high, which has been due to their revised Patent Law following China’s accession to TRIPS. In Thailand, the growth rate slowed in 1997 and has remained relatively low since: this was due to the introduction of the utility model (petty patent) system. To sum up, we can see that in all five countries domestic and foreign firms are interested in filing patent applications.
[ Institutional Infrastructure for IPR-Based Development in Asia ]
Fig. 1. Patent Applications
Fig. 2. Domestic Patent Applications
Fig. 3. Numbers of Domestic Patent Applications per Million Applicants Source: WDI database
2. Numbers of Researchers and Numbers of Applications per Researcher Fig. 4 shows that, based on WDI data,8 the number of researchers is increasing in China, Japan, Korea and Singapore. Since it is very likely that there is a strong correlation between numbers of applications and numbers of researchers, we calculated the number of applications per researcher in five countries. Fig. 5 shows a high number of applications per researcher in Japan and Korea (almost four times higher than in the US), but fewer in China, Singapore and Thailand: the differences, however, are smaller compared with those in Fig. 3. This means it is likely that domestic patent applications in these three countries will increase due to the greater numbers of people engaged in research, resulting in higher numbers of applications per researcher (see the next section for a more quantitative analysis). It is possible that the difference in numbers of applications in Japan and the US is caused by differences in their main fields of technology.9 8
Defined as researchers in R&D.
9
JPO Annual Report 2007, First section chapter 4, pp.72–74, (patent application trends in Japan and the US are similar, although the features of the two countries’ application trends are different).
129
[ Institutional Infrastructure for IPR-Based Development in Asia ]
Using the population figures taken from WDI data, we calculated the numbers of domestic applications per million applicants. From the data given in Fig. 3, we can predict that these will increase, especially in China and Thailand, over the coming years as the numbers of domestic applications per million in 2007 was still very low relative to Japan and the US. It is likely, however, that the numbers of patent applications per million in China, Singapore and Thailand will reach a similar level to that of Japan and the US. In Korea, patent applications per million have increased and are almost parallel with Japan. From Fig. 3, we can predict that domestic applications will increase in number in China, Korea and Thailand.
130
[ Institutional Infrastructure for IPR-Based Development in Asia ]
Fig. 4. Number Researchers
Fig. 5. Numbers of Patent Applications per Researcher Source: WDI database
3. Patent Applications and Characteristics of National Economies
131
In this section we quantitatively examine how patent applications by residents and by non-residents in a country are related to the characteristics of national economies, using the data available in the WDI database.
3.1. Domestic Patent Applications The number of patent applications filed by residents (domestic patent applications), relative to population size varies considerably across the five countries. As shown in Table 1, relative to the population, the level of patent applications in Japan and Korea is 200 times greater than that for Thailand. The level in China, although rapidly increasing, is still 40 times lower than that for Japan. These variations, however, are consistent with the significant variation in GDP per capita and R&D intensity among the five countries as shown below. The level of patent applications increases in tandem with a country’s incentives for inventions and patenting and its research capability. Thus, we can postulate that the total domestic patent applications (patent_applications_residents) would be high if the population is high; if the income per capita of the population is high, resulting in a demand for products embodying patented technologies and if the level of R&D investment by domestic firms relative to GDP is high. More specifically, we can postulate the following relationship across countries:
Here indicates the GDP per capita, PPP (constant 2005 international dollar), of country i, and indicates expenditure on R&D (percentage of GDP). We implement both a cross-section estimation over 58 countries for the year 2002 and a pool estimate for unbalanced sample from 1996 to 2005, with yearly dummies. Yearly time dummies capture global change over time, such as stronger protection of IPRs, although this would vary significantly across countries. The above three explanatory variables are not only highly significant but also account for close to 80 per cent of the variations in each model according to Table 3. In particular, the population coefficient is close to one, as would be expected, given the other intensity variables. If we double the size of the economy, we obtain double the number of patent applications. GDP per capita has an elasticity of 0.71 for crosssection estimation and 0.45 for pool estimation, which reflects both cross-section and over-time variations. Thus, per capita income is important. In addition, R&D intensity shows an elasticity of 0.92 for crosssection estimation and 1.13 for pool estimation. The estimated results explain the variations across the five countries; although Japan and Korea apply for many more patents than the benchmark specification suggests: Singapore applies for significantly fewer patents than the benchmark. According to this estimate, the more than five-fold difference in GDP per capita between China and Japan (see Table 2) accounts for roughly four times more applications by Japan and the R&D intensity difference (a 1.8 percentage point difference, see Table 2) accounts for roughly eight times more applications by Japanese residents. Differences in R&D intensity therefore matter more. The estimated results in Table 3 also help to explain the variation in the increase of domestic patent applications over time. Numbers have increased significantly over the past decade, except in Japan: in
[ Institutional Infrastructure for IPR-Based Development in Asia ]
(1)
132
China they increased 9.3-fold from 1995 to 2005. This reflects the increasing per capita income as well as increased R&D intensity of these countries. In the case of China, R&D intensity increased by 0.77 per cent from 0.57 per cent in 1996 to 1.34 per cent in 2005 and the GDP per capita also doubled during this period. In the case of Thailand, R&D intensity increased from 0.12 per cent in 1996 to 0.25 per cent in 2004, although the increase in GDP per capita was limited to 10 per cent. However, domestic applications in China and Thailand have increased significantly more than the estimated results in Table 3 suggest. This could reflect the increasing protection of IPRs in these economies. In Japan, where there was a small increase in both GDP per capita and R&D intensity, applications have increased only modestly, although the average number of claims has increased significantly from five to 9.5 and requests for patent examinations have also increased significantly (see the national report for Japan). In sum, as the economy develops in terms of both per capita income and R&D activity, the number of domestic patent applications increases significantly. The experience of the five Asian countries is consistent with this pattern.
[ Institutional Infrastructure for IPR-Based Development in Asia ]
Table 1. Domestic and Foreign Patent Applications
Source: World Development Indicators
Table 2. Main National Characteristics
Source: World Development Indicators *Research and development expenditure for Japan and Thailand are those for 2004.
Table 3. Domestic and Foreign Patent Applications (Cross-Section and Pool Estimations)
133
Note. Time dummies are added to pool estimation.
3.2. Foreign Patent Applications
Foreign applications (patent_applications_non-residents) in a country would be high if the population were high (economy of scale) given that there is an additional cost for applying patent protection (such as translating) and using the invention abroad. If incomes were high, leading to a demand for products embodying patented technologies and if the country were capable of manufacturing R&D-intensive products, a non-resident would seek to protect his invention in a country where it can be manufactured. More specifically, we can postulate the following relationship across countries:
(2) Here indicates the GDP per capita, PPP (constant 2005 international dollar) (current international dollar) of country i, and indicates the share of high-tech manufactured exports of country i. The estimate covers more than 69 countries for 2002 and over 113 countries, giving an unbalanced sample, from 1988 to 2005. Table 2 shows the results of the estimation. The above three explanatory variables are not only highly significant but also account for 60 -80 per cent of the variations in each model. In particular, the elasticity of the population is close to 1 (0.93 for the cross-section estimation and 0.96 for the pool estimation). GDP per capita has the elasticity of 0.87 for cross-section estimation and 1.14 for pool estimation, which reflects both cross-section and over-time variations. Compared with models 1 and 2, the population coefficient is lower relative to GDP per capita, which is not surprising, given that population size represents both the size of the market and the pool of inventors in models 1 and 2, but only market size in models 3 and 4. The percentage share of manufactured high-tech exports has the coefficient of 0.34 for crosssection estimation and 0.24 for pool estimation.
[ Institutional Infrastructure for IPR-Based Development in Asia ]
As shown in Table 1, the level of foreign applications (by non-residents)relative to the size of the economy in terms of GDP did not vary as much as the level of domestic applications in relation to its population.
134
This helps us to understand the changes and variations in foreign patent applications in the five countries over time. These more than doubled in China, Korea and Singapore, due to their rapid economic growth in terms of GDP per capita as well as their increased specialization in the manufacture and export of high-tech products. In the case of China, real income per capita doubled and the share of high-tech exports increased from 10 to 31 per cent. As for cross-country variations, the level of foreign applications in Korea and Singapore seem very high, partly because they are more specialized in the production and export of these products. Singapore’s share amounted to 57 per cent, compared with 23 per cent for Japan.
4. Numbers of Patents Granted
[ Institutional Infrastructure for IPR-Based Development in Asia ]
Fig. 6 shows that numbers of patents granted increased in all countries, although there have been significant variations over time: patent rights in China have increased substantially over the last 10 years. We can therefore see that China, Japan and Korea had a similar number of patent rights granted in 2007: 68,000, 146,000 and 123,000 respectively.
Fig- 6. Numbers of Patents Granted
Fig. 7 shows rates of patents granted (numbers granted/(numbers of patents granted + numbers of decisions to refuse). These have been relatively flat in Japan, Korea and Thailand, but in Singapore they have fluctuated as the formula used by Singapore differs from that used by other countries.
135
Japan: Korea: Thailand: Singapore:
Numbers of patents granted/(numbers of patents granted + numbers of decisions to refuse + numbers of patent withdrawals) × 100 (%) Numbers of patents granted/(numbers of patents granted + numbers of decisions to refuse) × 100 (%) Numbers of patents granted/(numbers of patents granted + numbers of decisions to refuse) × 100 (%) Numbers of patents granted/numbers of applications × 100 (%)
[ Institutional Infrastructure for IPR-Based Development in Asia ]
Fig. 7. Rates of Patents Granted
China: Japan: Korea: Thailand: Singapore:
Numbers of patents granted/numbers of applications × 100 (%) Numbers of patents granted/numbers of applications × 100 (%) Numbers of patents granted/numbers of applications × 100 (%) Numbers of patents granted/numbers of applications × 100 (%) Numbers of patents granted/numbers of applications × 100 (%)
Fig. 8. Rates of Patents Granted
136
We therefore calculated other country rates using the same formula as that for Singapore. Fig. 8 shows the rates of numbers of patents granted/numbers of patent applications. In China, Japan, Korea and Thailand the ratio remained unchanged from 1995 to 2005 except for 1998 and 1999 in Korea and 1996 in Japan. However, the rate for Singapore fluctuated from 1995 to 2005. This could have been caused by the difference between Singapore’s patent system and that of the other countries: the Singapore Patent Office uses search report results from foreign countries,10 although there may be other reasons to cause fluctuation. Although rates of patents granted in Thailand are very high, rates (numbers granted/numbers of applications) are very low, meaning that applicants select few inventions for examination there.
5. Requests for Examination In this research, we collected four countries’ requests for examination, which showed certain differences in the details, as shown in Table 4. This does not, however, apply to Singapore. Table 4. Request Period for an Examination
*In Thailand the period of publication is not regulated, it follows the formality examination.
[ Institutional Infrastructure for IPR-Based Development in Asia ]
In all of the countries listed in Table 4, if an applicant does not request an examination within the permitted time period, it is abandoned. The Thai system is different from the other three systems as the starting date of the period to request an examination is the publication date. The period between dates of publication and application is not fixed in Thailand.
In the case of Singapore, this data is not relevant, because Singapore allows the patent applicant to rely on the search and/or examination done by a foreign patent office.
Fig. 9. Requests for Examination 10
Details of Singapore’s system are given in pp.4-5 of the National Report.
The following tables show patent examination guidelines for all countries in specific areas: computer software-related inventions, biological inventions, medical inventions and traditional knowledge (TK). There are normal patent examination guidelines in China, Japan and Korea, but there are no published patent examination guidelines in Thailand. In Singapore, there is no substantial patent examination system.
137
Table 5. Existence of Examination Guidelines
Table 6. Existence of Illustrative Examples of Patents Granted
Four counties, China, Japan, Korea and Thailand, have utility model systems. Chinese and Japanese systems allow registration without examination and in these two countries, utility model right holders need an expert opinion on registrability to enforce the utility model right. The Korean and Thai systems are examination systems: the Korean system changed to an examination system from a registration system without an examination in 2006; the Thai system (petty patent) was established in 1999. There is no utility model system in Singapore. Fig. 10 shows that utility model applications increased only in China and Thailand. It also shows that patent applications in China increased faster than applications for utility models.11 Applications decreased slightly year-on-year in Japan and Korea: in Korea, the decrease followed the changeover to a substantial examination system in 2005. The ratio of utility model and patent applications (numbers of utility models/numbers of patent applications) has decreased over the past 12 years for China and Korea. The ratio of utility models relative to patent applications is very low in Japan, proving that the system is less used than the patent system.
11
Kazufumi Yaji, November, 2008: A Study on the Patent Application Strategy for China from the Viewpoint of the Patent Application Procedure and Patent Application Conditions in China, Hitotsubashi Journal.
[ Institutional Infrastructure for IPR-Based Development in Asia ]
6. Utility Models
138
[ Institutional Infrastructure for IPR-Based Development in Asia ]
Fig. 10. Utility Model Applications
Fig. 11. Rate of Utility Models to Patent Applications
Table 7. Duration of Utility Model Rights, Requirement for Examination
139
*There is no utility model system in Singapore.
7. Foreign Patent Applications
Fig. 12. Number of Foreign Patent Applications
Fig. 13 shows that numbers of foreign patent applications relative to domestic applications barely changed in Korea and Singapore, although the total number of applications in these countries has been increasing, meaning that the rate of increase of domestic and foreign patent applications is almost the same. Foreign and domestic companies have started to show interest in obtaining patent rights with foreign patent applications increasing slightly faster in Japan: numbers of domestic and foreign patent applications are also increasing in China and Thailand.
[ Institutional Infrastructure for IPR-Based Development in Asia ]
In this report, a foreign patent application is a patent application filed from abroad. Fig. 12 shows that the number of foreign patent applications in all countries has increased. meaning that the interest of foreign companies in obtaining patent rights in these countries has increased. The number of foreign applications filed with SIPO showed the greatest increase in recent years.
140
Fig. 13. Foreign Patent Applications Relative to all Patent Applications
[ Institutional Infrastructure for IPR-Based Development in Asia ]
8. Patent Applications in All Fields of Technology We tried to obtain the number of patent applications in all fields, classified to the IPC 3-digit level, but only succeeded in obtaining data for China, Japan and Korea. Therefore we compared these, after which, we compared data from the WDI of the World Bank and PATSTA of the EPO relating to all five countries.
8.1. All Fields of Technology in Each Country Fig. 14 shows the number of applications in all fields and the share of patent applications by field in three countries. This suggests that: • The technological structures of patent applications are similar. In the following sub-section, we will analyze the data quantitatively. • There were patent applications in all fields. Therefore, all three patent offices need examiners in all fields. • Numbers of patent applications in basic electronics (H01-H05) were highest in all three countries. The level of applications for basic electronics (H01-H05) in the three countries was almost the same. • Numbers of patent applications in Japan filed by all three countries were highest in the following fields:
Household utensils (A41-A47) Amusement rescue (A62-A63) Printing, stationary, ornaments (B41-B44) Cars, shipping, airplanes (B60-B68) Packing, containers (B65-B68) High polymer (C08) Construction of roads, building, railways (E01-E06) Machinery, engines, pumps (F01-F04) Engineering in general, elements (F15-F17) Measuring optics (G01-G03) Horology, controlling, computing (G04-G08) Education, musical instruments, information Basic electric circuits, electric communication technology”
141
This data shows a high level of applications in the area of machinery, engines, pumps in Japan.
Fig. 14. Patent Applications in All Fields
[ Institutional Infrastructure for IPR-Based Development in Asia ]
• In China, the following fields accounted for the highest numbers of patent applications: Metallurgy, metal treatment (C21-C30) Weapons, blasting (F41,F42,C06)
142
Fig. 15. Share of Patent Applications by Field
(i) Thailand - Applications in All Fields
[ Institutional Infrastructure for IPR-Based Development in Asia ]
We compared numbers of domestic and foreign applications in selected fields. The highest combined total was in chemistry and biochemistry; and, for domestic patent applications only, in engineering.
Fig.16. Numbers of Patent Applications in all Fields in 2005 (Thailand)
143
Share by field = (numbers of applications for each field in 2005/all applications in 2005)
Fig. 17. Share of Patent Applications by Major Technological Field in 2005 (Thailand)
(ii) Singapore - Applications by Field Fig. 18 shows the share of applications in all main IPC groups in Singapore: almost 58 per cent of the total were filed in C (chemistry), G (physics) and H (electricity).
[ Institutional Infrastructure for IPR-Based Development in Asia ]
Patent applications in all areas will increase in the future (Fig. 1).
Fig. 18. Numbers of Patent Applications in All Fields (Singapore)
144
8.2. Patent Application Structure by Area of Technology One striking finding from the comparison of the technological structure of patent applications of four countries12 is the similarity as shown in Fig. 19, despite the significant difference in numbers (9,000 in Singapore and 430,000 in Japan). The similarity in the technological structure of patent applications can be summarized by the correlation coefficient. As shown in Table 8, the correlation coefficients between Japan and the other three countries (China, Korea and Singapore) are very high: 0.87, 0.89 and 0.84 respectively. This similarity may not be surprising when we consider the fact that a significant number of firms will apply for patent protection for more important inventions globally as competition has become global (a competitor may appear in any important market, not only local firms but also those from third countries) and that patent protection has also become global. In such circumstance, a firm applies for patent protection in any country, as long as the value of protection in that country exceeds the cost. Thus, although there were fewer patent applications to patent offices in smaller countries, they were not concentrated in a particular area of technology. An important implication is that the patent office in a relatively small country needs to examine patent applications in the same way as one in a large country. According to Table 8, applications filed with the Singapore Patent Office cover 31 areas of technology and those with the JPO cover 32. The level of concentration of the technological structure of patent applications is measured by the HHI (HerfindahlHirschman Index).13 There is a weak tendency for a smaller country to have a higher concentration of applications: Japan, China and Singapore have very similar levels of HHI. Thus, the patent office in a small country would need to develop internal or external capabilities to examine patent applications in the most important areas, even if numbers were relatively low. This would constitute an important reason for international collaboration between patent examinations.
[ Institutional Infrastructure for IPR-Based Development in Asia ]
Table 8. Technological Structure of Patent Applications in 2005
Note. HHI = the sum of the squares by share of patent application in 32 areas of technology.
12
Thailand does not collect data classified by detailed IPC class.
13
The sum of the squares of the shares, which is in turn equal to the number of areas with non-zero patent applications (n) and the statistical variance of the shares divided by n.
[ Institutional Infrastructure for IPR-Based Development in Asia ]
145
Fig. 19. Percent of the Number of Patent Applications in all Technology Fields
146
9. Fee Levels and Structure14 The levels and structure of patent fees would need to be designed to cover both the cost of effective administration by the patent office, including the cost of infrastructure and personnel, and to encourage innovation: high fees discourage potential users and can also reduce the incentive for R&D. The fee structure is also important. For example, if the examination fee is significantly below cost while the maintenance fee is very high, it could encourage greater numbers of patent applications of low quality, at the same time reducing returns from higher-quality inventions.
[ Institutional Infrastructure for IPR-Based Development in Asia ]
The cost of patent protection consists of application fees, examination request fees, search fees and maintenance fees, which may depend on the number of claims as well as on the number of pages. Before describing the major characteristics of the fees in the five countries, we would like to point out the general tendency. First, the fee tends to increase with GDP per capita since patent examination involves the use of a significant amount of human resources, although there are important variations. Second, it tends to rise with the numbers of claims, not only because the cost of examination also rises but also because some patent offices discourage applications containing multiple claims, since they could end up providing protection that is not commensurate with the technical contribution of the invention. Third, a patent office often requires a patentee to continue paying fees just to maintain the patent, and these increase over time from the date of grant. Such fees have the effect of forcing the applicant to turn the invention into the public domain when it cannot generate enough profit to cover such fees. In most countries these fees are designed to increase with time. There exist significant variations in the level and structure of fees across all five countries, which provide interesting contrasts and potential lessons. Fees cumulated since the grant of an application and converted into US dollars using the market exchange rates in 2006 are shown in Fig. 20. Here we assume 10 claims per patent, the examination request in the second year and the grant in the fourth year. Fig. 21 shows fee levels and structures, using the purchasing power parity exchange rate (PPP) for 2006, which can adjust the difference in the general price levels across countries. Since the currency of a developing country tends to have a higher value in terms of PPP than the market exchange rate due to a lower productivity differential for non-tradable goods, the patenting fee in a developing county tends to rise under the PPP conversion15. We would make several observations. First, comparison of application fees, which provides the initial value of the curve in the first year of applications (Fig. 1), suggests that in all countries this fee is low and tends to rise with per capita income. This may not be surprising given that application registrations and formality checks are inexpensive. Only China has a fee proportionate to the number of claims (it also levies fees dependent on the number of pages in patent documents). The application fee is lowest in Thailand in both market exchange rate and PPP but highest in China in PPP.
14
Fees for patent agents were not researched.
15
China has the highest patenting costs among six countries including the US if the patent is maintained for more than seven years from the date of the application, although it becomes less expensive than Japan and Korea in terms of market exchange rates.
Second, the cumulated fee increases significantly in all countries when the applicants request examinations (second year after the application). This is not surprising, given that the substantive examination involves a substantial economic cost, requiring a search for prior art and the evaluation of patentability: it is highest in Japan, followed by Singapore, China, Thailand and Korea. Since examinations costs increase with the number of claims, it is reasonable to assume that examination fees also increase with the number of claims. However, this only applies to Japan and Korea: here, fees increased by slightly more than 30 US dollars per claim. In the case of Japan a patent application with 10 claims costs 20 per cent more than one with a single claim.
147
Third, when the search for prior art is removed from the examination process, there is an independent search fee, which is calculated separately in Singapore and Thailand. Search fees account for around 40 per cent of the total cost in the case of Singapore with most of the cost levied for examination requests.
[ Institutional Infrastructure for IPR-Based Development in Asia ]
Fourth, the cumulated fees increase further over time from the date of the grant, due to maintenance fees. All countries levy a renewal or maintenance fee for maintaining a patent, even though administrative costs are very low. Such a fee is not only substantial but also rises as the length of patent protection is extended. The fact that the lines of cumulated fees in Figs 20 and 21 are linear implies that annual fees increase in an exponential manner. In the case of Japan, cumulated fees increased from 2,000 US dollars in the fourth year to 2,200 US dollars in the eighth year and 3,400 US dollars in the twelfth year. In China, fees increased from 1,100 US dollars, to 1,800 US dollars and then to 3,500 US dollars. They increased substantially in Korea, although not in Singapore or Thailand.
Note: 1st year from filing = ☆ = Application 2nd year from filing = □ = Request for examination 3rd year from filing = ▽ = Continuing application (which is charged in China for pantent application filed over 2 years still without grant.) 4th year from filing = First year from granting
(*1) In China, Annual Fee for the patent right is counted from filing date, and the limitation period of pantent right is 20 years.
[ Institutional Infrastructure for IPR-Based Development in Asia ]
148
Fig. 20. Application Fee, Request for Examination Fee, Annual Fee for the patent right, etc. cumulative by year_converted at market exchange rate
Fig. 21. Application Fee, Request for Examination Fee, Annual Fee for the patent right, etc. cumulative by year_converted at ppp
[ Institutional Infrastructure for IPR-Based Development in Asia ]
Note: 1st year from filing = ☆ = Application 2nd year from filing = □ = Request for examination 3rd year from filing = ▽ = Continuing application (which is charged in China for pantent application filed over 2 years still without grant.) 4th year from filing = First year from granting
(*1) In China, Annual Fee for the patent right is counted from filing date, and the limitation period of pantent right is 20 years.
149
150
10. Databases (Information Systems: Digitalization of Patent Documents) China Database for External Users of the State Intellectual Property Office (SIPO) There are two main ways to retrieve patent documents. One is the Patent Gazette, and the other is online patent information (patent database for all areas). Patent Gazette The Intellectual Property Publishing House has published and issued the Patent Gazette since 1985 and it is the main tool for retrieving patent documents. Online Patent Information There are six kinds of online databases for retrieving documents. 1- The State IP Office Patent Search System (http://www.sipo.gov.cn) includes all three categories of patent applications (inventions, utility models and designs) processed by SIPO. 2- China Patent Information Network (http://www.patent.com.cn) includes all invention and utility model patents registered in China since 1985. 3- Patent Search System on China IP Network (http://cnipr.com) hosted by the Intellectual Property Publishing House of the State IP Office.
[ Institutional Infrastructure for IPR-Based Development in Asia ]
4- Chinese Patent Database on CNKI (http://www.cnki.net/zlindex.htm) provides details of Chinese patent database searches, free services and service charges. 5- China Patent Information Retrieval System (http://search.cpo.cn.net or http://jiansuo.com) hosted by SIPO and the China Patent Information Center. 6- Beijing Economic Information Network This patent search system consists of two databases: one for abstracts of granted patents and one for abstracts of invalid patents. Database for Traditional Chinese Medicine (TCM) Patents (http://chmp.cnipr.cn/tcm_patent1/chineseversion/login/index.asp.) SIPO has created China’s Traditional Chinese Medicines Patent Database (CTCMPD) for patent examiners and users to search TCM patent documents.
Japan Database for JPO Patent Examiners JPO patent examiners can use the cluster search system and search method for each database to retrieve documents from internal and external sources. Internal databases include the domestic patent database, the computer software (CS) database, the foreign patents database, the non-patent database, the WPI, ICIREPAT and DNA databases. There are 20 different types of external databases.
Database for External Users of the JPO The JPO offers two main ways to retrieve prior art documents. One is for an applicant to use the retrieval terminal system which is the same as the retrieval system for patent examiners in the JPO. The other is to search prior art of industrial property rights through the Industrial Property Digital Library (IPDL) which is an Internet website.
151
IPDL (http://www.ipdl.inpit.go.jp/homepg_e.ipdl) Anyone can use the IPDL and can search 61 million industrial property documents. Searches can be performed using IPC, FI, F-term and CS-term.
Korea Database for KIPO Patent Examiners KIPOnet comprises 39 subsystems, the Electronic Application Preparation System (KEAPS), the general receiving system, the formality check system, the search system, the trial administration system and the gazette publication system. KIPO’s internal users access KIPOnet through the Government Public Key Infrastructure (GPKI)-based Single Sign-On. Database for External Users (KIPRS) External users can use the Korea Intellectual Property Rights Information Service (KIPRIS) (http://eng.kipris.or.kr/). KIPRIS has gathered approximately 3.5 million entries on Korean patents, utility models, designs and trademarks since 1948. It also includes information on the Trilateral Offices (EPO, JPO and USPTO).
Traditional Knowledge Database External users can use the TK database established by KIPO as the Korean TK portal site (www.Koreatk.com) in which data has been collected since December 2007.
Singapore Database for External Users (SurfIP, Epatents) There is no substantial examination in Singapore, so IPOS established a database for researchers, inventors, businesses and patent agents accessible via a website. There are two retrieval systems, SurfIP (www.surfip.gov.sg) and Epatents (http://www.epatents.gov.sg/default_redirect.asp). SurfIP includes documents from 11 patent offices including the WIPO PCT database, SIPO, EPO, JPO, KIPO, TIPIC, USPTO, etc. The Epatent system includes documents filed with the IPO. External users can retrieve patent applications filed with the IPO and use online submission, ePatent search, eJournal, account management and general facilities.
[ Institutional Infrastructure for IPR-Based Development in Asia ]
Biology and Biotechnology Database External users can use Ptome@Korea which is a DNA and proteins database consisting of two parts, PatSeq and GenePat. In PatSeq, patent sequences and related data are provided and in GenePat, annotated gene information can be found.
152
Thailand Database for External Users and Patent Examiners The retrieval systems for patent examiners and applicants at the DIP are relatively similar. They can access the Thailand IP Information Center via the DIP website (http://patentsearch.moc.go.th/DIPSearch/), which permits the retrieval of documents from domestic and foreign patent databases including those of the JPO, KIPO, WIPO, EPO and USPTO. Five-Country Database In the five countries, there is an online retrieval system for external users (patent offices, applicants, etc.). There are special retrieval systems for patent examiners in China, Japan and Korea, the numbers of patent applications being much higher in these three countries. We consider that in order to examine a quantity of patent applications, a special retrieval system needs to be established. Regarding TK, there is only one dedicated system, in Korea, although patent examiners in all countries except for Singapore launch numerous searches on TK. However, there is no database that includes a global patent information system for all countries. In order to collaborate on patent examinations, comprehensive information on some areas of technology will be needed in the future.
11. Conclusions
[ Institutional Infrastructure for IPR-Based Development in Asia ]
Patent applications have increased significantly over the past two decades in China, Korea, Singapore and Thailand, reflecting the increase of per capita income and the intensity of R&D activity as well as increasing patent protection in these economies. In Japan, numbers of requests for examination have increased substantially, although applications have increased little in the past 10 years. Domestic patent applications per one million in China, Singapore and Thailand are still much lower than in Japan, Korea and the US. It can therefore be predicted that applications will increase significantly in the future in these countries, due both to the higher number engaged in research and the higher numbers of applications per researcher. Foreign patent applications have been increasing significantly in all countries reviewed. They have increased very significantly in China, Korea and Singapore, due to their rapid economic progress in terms of GDP per capita as well as their increased specialization in manufacturing and exporting high-tech products. Comparing the structure of patent applications of the five countries by area of technology shows that the structure of their patent applications is almost the same. An important implication is that the patent office of a relatively small country, if it chooses to make a substantive examination, would need to examine patent applications in as many areas of technology as a patent office of a large country. The above findings suggest that it is very important for an efficient database to be developed so that patent applicants and examiners can make effective decisions leading to the grant of stable patent rights for high-quality inventions.
The above findings also suggest that, due to globalization, a worldwide database which contains prior art and which is accessible to all will be needed in the future for efficient processing of applications and examination as well as for stable patent rights.
153
[ Institutional Infrastructure for IPR-Based Development in Asia ]
One important step complementary to the development of a database would be to enhance the capability of firms to use the information contained in such a database for R&D management and for submitting effective patent applications. WIPO may well wish to target collaboration in this area.
Institutional Infrastructure for IPR-Based Development in Asia
[ Institutional Infrastructure for IPR-Based Development in Asia ]
154
China Xiang Yu* 1. Outline of the Information Collected 1.1, Patent Information Collected in China 1.2. Sources of Data Used in this Report 2. Patent Practice and Mechanisms 2.1. The Procedure for Patent Applications 2.2. The Procedure for Patent Examination in China 2.3. Examination Procedures Relating to Computer Programs 3. Statistical Analysis of Data Collected 3.1. Brief Introduction 3.2. Numbers of Patent Applications and Grants 3.3. Numbers of Utility Models 3.4. Numbers of Applications and Grants to Non-Residents 3.5. Numbers of Researchers and Levels of Research Expenses 3.6. Numbers of Patent Applications in all Areas 3.7. Fees Relating to Patent Procedures 4. Protection of Traditional Knowledge through IPRs 4.1. The status quo for Chinese Traditional Knowledge 4.2. Protection of Folk Literature and Art through IPRs 4.3. Protection of Biodiversity-Related TK through IPRs 4.4. Protection of TK through IPRs 4.5. Protection of TCM through IPRs 5. Protection of Biotechnology in China through IPRs 5.1. Historical Development of Patent Protection for Biotechnology 5.2. Patentable Items of Biotechnology 5.3. Statistical Analysis of Biotechnology Patents 6. Protection of Pharmaceuticals through IPRs 6.1. Historical Development of Patent Protection for Pharmaceuticals 6.2. Patentable Subject Matter in Pharmaceuticals 6.3. Issues concerning Pharmaceutical Patents 6.4. Administration Protection for Pharmaceuticals 6.5. Analysis of Pharmaceutical Patents 7. Observations and Recommendations 7.1. Need for Specific Guidelines for Biological and Pharmaceutical Inventions 7.2. Need for Specific Regulations for TK and Genetic Resources 7.3. Strategic Use of Patent Information and Non-Patent Literature in Key Policy Areas 7.4. Strengthening of International Cooperative Research and Practice
*
The able assistance of Honghua Qiu, Qiongdi Chen, Xiaoli Li, and Shan Liu is gratefully acknowledged. The views expressed in this report are those of the authors and do not necessarily reflect those of the WIPO Secretariat or any of its Member States.
1. Outline of the Information Collected
155
1.1. Patent Information Collected in China 1.1.1. Digitization of National Patent Documents Chinese patent information can be retrieved from CD-ROMs issued by the Intellectual Property Publishing House and from government and patent information institution websites. (1) CD-ROMs CD-ROMs for patents were first issued in 1992 by the Intellectual Property Publishing House, uniquely authorized by SIPO to provide patent-related documents to the public, and this has been the main means of issue since. These CD-ROMs deliver patent information in various configurations including full-text tag images and searchable text formats. (2) Online Patent Document Digitization Some organizations provide patent resources on the Internet and links to websites, the most visited being SIPO’s website (http://www.sipo.gov.cn/ sipo/zljs/default.htm). This is an online patent retrieval system, including overall information on patent applications, examinations, patent agencies, etc. This system provides full descriptions of invention patents and utility models from 1985 and designs from 1998. The abstracts database on Chinese patents (http://www.exin.net/patent) contains applications for invention patents and utility models published by SIPO since September 10, 1985.
China’s Patent Information Research System Website (http: search.cpo.cn.net/ ) is sponsored by the China Patent Information Center and provides free patent information services including the latest free and open patent search database, as well as full online texts of descriptions.
1.1.2. Availability of National Patent Data At present, we can mainly access patent information as follows: (1) Patent Gazette China’s Patent Office started to accept patent applications in 1985 and the Intellectual Property Publishing House began to publish and issue the Patent Gazette from that time. With the increasing volume of patent applications and examinations, the Patent Gazette went from monthly to bimonthly and became a weekly magazine in 1986. It provides the main means for searching patent documents and retrieving the latest patent information. (2) Online Patent Information (Patent Database for all Areas) The State Intellectual Property Office Patent Search System16 was launched in November 2001 and includes the three categories of patent applications (inventions, utility models and designs) that have
16
http://www.sipo.gov.cn.
[ Institutional Infrastructure for IPR-Based Development in Asia ]
The China Intellectual Property website (http: //www.cnipr.com/gjzl/js/js.htm) is an online retrieval system giving access to their patent search system. All patent information published since 1985 (including full texts of the descriptions) can be searched.
156
been processed by SIPO since April 1, 1985. The database provides all issues of the Patent Gazette, full texts of patent application statements, claims, etc. All information can be downloaded and searched for free in both Chinese and English versions, and is updated every Wednesday. At present, only this patent database can show the legal status of patents issued by the Patent Office since 2002. Its main content includes entry into force of the request for substantial examination, withdrawal of the application, action deemed to withdraw the application, refusal of the application, granting a patent right, action deemed to have abandoned the right to obtain a patent, abandonment of a patent right, restoration of a patent right, invalidation of a patent right, cessation of a patent right before its expiry date, cessation of a patent right at its expiry date. The China Patent Information Network17 was established in May 1988 and was updated in January 2002. It includes all invention and utility model patents since 1985. There is comprehensive information on titles and abstracts of patents, and the database also provides scanned images of the full text of related invention patents and utility model patents. Updated every month. The Patent Search System on China’s Intellectual Property Network18 is hosted by the Intellectual Property Publishing House of SIPO and records all relevant documents (invention patents, utility model patents and design patents) issued since 1985, with their full text. Updated every Wednesday.
[ Institutional Infrastructure for IPR-Based Development in Asia ]
The Chinese Patent Database on CNKI19 enables searches to be made and is divided into free and feepaying services. The library of titles of Chinese patents can be visited for free, while the database for the abstracts of Chinese patents and their texts in full can only be accessed on pre-payment. It contains all patents literature since 1985. The rhythm of updating is not known. The China Patent Information Retrieval System20 is hosted by SIPO and the China Patent Information Center. It contains all patent literature (including invention, utility model and design patents) issued since 1985, and is updated weekly. The Beijing Economic Information Network consists of two databases, one for patent abstracts and one for the abstracts of invalid patents. It also provides detailed patent abstract information from 1985 and the types of patents cover invention patents and utility models. The rhythm of updating is not known.
1.1.3. Patent Database for Specific Areas With the cooperation between SIPO, local government and local IP Offices, 17 patent databases for specific areas had been set up in July 2007:.others are under construction or have been given approved. See below for detailed information.
17
http://www.patent.com.cn.
18
http://www.cnipr.com.
19
http://www.cnki.net/zlindex.htm.
20
http://search.cpo.cn.net or http://jiansuo.com.
21
http://www.beinet.net.cn/.
Table 1.1. Patent Databases for Specific Areas
157
Source: http://www.sipo.gov.cn/.
1.2. Sources of Data Used in This Report
2. Patent Practice and Mechanisms 2.1. The Procedure for Patent Applications The Chinese Patent Law provides for three different types of patents: inventions, utility models and designs. An invention patent is granted for "… any new technical solution relating to a product, a process or improvement thereof." A utility model patent is granted for "... any new technical solution relating to the shape, the structure, or their combination, of a product, which is fit for practical use." A design patent is granted for "... any new design of the shape, the pattern or their combination, or the combination of the color with shape or pattern, of a product, which creates an aesthetic feeling and is fit for industrial application." Invention and utility model patents provide protection against unauthorized production, use, offer for sale, sale or importation of the patented product. A design patent protects against unauthorized production, sale and importation. The duration of an invention patent right is 20 years and for utility models and designs, 10 years from the date of filing. For utility model and design patents, there is no examination requirement, while for invention patents, the reverse is true.
[ Institutional Infrastructure for IPR-Based Development in Asia ]
Patent information and data used in this report mainly came from the material and information on Chinese patent practice and were taken from the Chinese Patent Law and Guidelines for Patent Examination as well as the Chinese Patent Implementing Regulations. The data analyzed in part three were collected in the Patent Statistics Yearbook, the China Statistical Yearbook and SIPO’s patent retrieval platform. As to the patent analyses on traditional knowledge (TK), biotechnology and pharmaceuticals, the provisions form part of the Patent Law and Regulations and the data in these specific fields are retrievable from the CPRS system in Wuhan IP Office and SIPO.
[ Institutional Infrastructure for IPR-Based Development in Asia ]
158
Fig. 2.1. Invention Patent Application Procedures Source: prepared by the author according to Examination Guidelines.
2.2. The Procedure for Patent Examination in China There are three basic requirements for obtaining an invention patent in China. Novelty: this is stipulated in the provisions of Art. 22(2) of the Patent Law. Before the date of filing, no identical invention must have been publicly disclosed in a publication in the country or abroad or have
been publicly used or made known to the public by any other means in the country, nor had any other person filed previously with the Patent Administration Department an application describing an identical invention and which was published after the said date of filing.
159
Inventive step: Art. 22(3) of the Patent Law sets out the definition of an inventive step. Compared with the technology existing before the date of filing, the invention has to show "prominent substantive features and represent notable progress".
[ Institutional Infrastructure for IPR-Based Development in Asia ]
Practical applicability: means that the invention can be made or used effectively.
Fig. 2.2. Inventive Step Examination Source: drawn up by the author according to Examination Guidelines.
160
2.3. Examination Procedures Relating to Computer Programs On May 24, 2006, SIPO enacted new Guidelines for the Examination of Patent Applications that entered into force on July 1, 2006. Chapter 9 of Part II (substantive examination) of the Guidelines deals with inventions involving computer programs. According to the Guidelines and SIPO’s current examination practice, criteria for patentability and examination processes can be summarized as follows. First, the application is classified in the light of its proper statutory category. If it belongs to one of the excluded categories, such as arithmetical or mathematical calculation rules, computer programs per se or computer programs recorded on a carrier (such as tape, disc, CD-ROM, magnetic CD-ROM, PROM, VCD, DVD or other computer-readable medium), or rules and methods for games, a patent cannot be granted.
[ Institutional Infrastructure for IPR-Based Development in Asia ]
Second, the examiner may consider whether the application complies with Art. 2(1) of the Regulations. When its subject matter has fulfilled the three essential elements in the Guidelines, i.e. aiming to solve technical problems, using technical means and achieving technical effects, then it constitutes a complete technical solution and therefore complies with Art. 2(1). The three essential elements mentioned above are only the basic conditions for determining whether an application involving computer programs belongs to the categories of patent protection. The application must also meet the criteria for novelty, inventive step and practical applicability.
Fig. 2.3. Examination Process for an Invention Patent involving Computer Programs Source: drawn up by the author according to the Guidelines.
3. Statistical Analysis of Data Collected 3.1. Brief Introduction The Chinese Patent Law was adopted in 1984 and entered into force on April 1, 1985: it was revised in 1992 and 2000. (1) The First Revision Through this revision, the patent system was improved and protection for patent rights strengthened in the following ways:
[ Institutional Infrastructure for IPR-Based Development in Asia ]
161
162
The technological fields of patent protection were broadened to cover pharmaceutical products, foodstuffs, beverages, flavorings and substances obtained by means of chemical processes. The duration of a patent right was extended: invention patents were extended from 15 to 20 years and utility model and design rights were extended from five to 10 years. The exclusive right was enhanced. Protection for a manufacturing process was extended to a product directly obtained by the patented process and a patentee had the right to prevent any other person from importing, without his authorization, a patented product or products obtained directly through his patented process. The grounds for granting a compulsory license were restricted. The situation in which this could be granted only included (a) where an entity qualified to utilize the invention or utility model made a request for authorization from the patentee to utilize the patent on reasonable terms, and such efforts were unsuccessful within a reasonable period of time, and (b) a national emergency, an extraordinary state of affairs or a public interest requirement.
[ Institutional Infrastructure for IPR-Based Development in Asia ]
The original pre-granting opposition procedure was replaced by a post-granting revocation procedure. As a result, the entire approval procedure of a patent right was shortened by on average three to four months. The retroactive effect of a declaration of invalidation was restricted. According to the earlier law, any patent right declared invalid was deemed to be non-existent. The revised Patent Law kept this provision, but at the same time stipulated that: the decision of invalidation should have no retroactive effect on any judgment or order on patent infringement pronounced and enforced by the People’s Court, on any decision concerning the handling of a patent infringement made and enforced by the administrative authority for patent affairs, or on any contract of a patent license or of an assignment of a patent right which had been performed prior to the decision to invalidate. However, any damage caused through bad faith would result in the patentee being compensated. The revised Patent Law is fully in line with the requirements of the Agreement on Trade-Related Aspects of Intellectual Property Rights (TRIPS Agreement). Moreover, in light of experience since the enforcement of the revised law, preparation was made for the second revision. In addition, the drafting and approval of the Regulations on Protection of Plant Varieties and the Regulations on Protection of Layout Design of Integrated Circuits have been completed. These two regulations are independent laws, as allowed by TRIPS, and patent applications in these fields would be handled by governmental authorities separate from SIPO. (2) The Second Revision of the Patent Law After the first revision, and with continuing liberation of the economy, patent infringement became rampant. Penalties imposed on and compensation awarded against infringers were low and lacked deterrent value. In the area of patent prosecution, the backlog of cases was dealt with by SIPO and the Patent Reexamination Board (PRB). To address these and similar issues, as well as for TRIPS compliance, the 1993 version and the Detailed Implementing Rules of the Patent Law (1993 Implementing Rules, entering into force on January 1. 1993) were amended. The revised law and detailed rules for its implementation were put into effect on July 1, 2001.
The Chinese government has made progress in its IP policies in the past 10 years: the number of patent examiners to handle the increase in applications filed has been increasing rapidly. A brief outline of the patent system is given below:
163
[ Institutional Infrastructure for IPR-Based Development in Asia ]
Table 3.1. Chinese Patent System
Source: drawn up by the author according to the Patent Law.
164
3.2. Numbers of Patent Applications and Grants In this section, the data relating to invention patent applications and grants from 1988 to 2007 were taken from the Patent Statistic Yearbook. Over the past 20 years, patent work has made remarkable progress: the most direct evidence of this being the rapid increase in patent applications received by SIPO. In Fig. 3.1 the total number of applications for invention patents increased from 9,659 in 1988 to 24,516 in 2007, representing a 20-fold increase. Since the beginning of the 1990s, applications to SIPO increased rapidly. According to WIPO data in 2001, among the 27 countries in which patent systems protect invention, utility model and design patents at the same time, the number of applications in China ranked third worldwide, behind Japan and Germany and in front of Korea. This shows that, for numbers of patent applications, China has become one of the major players and technological innovation capability is clearly strengthening.
[ Institutional Infrastructure for IPR-Based Development in Asia ]
Fig. 3.1. Numbers of Invention Patent Applications Source: The Patent Statistic Yearbook (from 1988 to 2007).
The number of invention patents granted grew faster between 1995 and 1997: SIPO granted 142 patents in 1985 and this was a milestone in Chinese patent history. Likewise, according to WIPO data in 2001, the number of granted patents in China ranked tenth; fantastic progress compared with 35th place in 1989. There were 67,948 invention patents granted in 2007, 10,162 more than in 2006, a rise of 17.6 per cent. The sharp increase shows a greatly improved rate of efficiency and capability in patent applications and examinations.
165
Fig. 3.2. Numbers of Invention Patents Granted Source: The Patent Statistic Yearbook (from 1995 to 2007).
3.3. Numbers of Utility Models Fig. 3.3 shows the developing trend of filing for utility model patents: the number of grants consistently increased except for 1997 and 2004 which showed a slight decrease. For the period 1995 to 2007, the first peak was seen in 2000, showing an increase of 20 per cent on the previous year and a second peak of 24 per cent in 2004. Due to motivation for innovation and stricter invention patent examinations, filing for utility models become very active, which is why sustained and steady growth in the number is evident.
[ Institutional Infrastructure for IPR-Based Development in Asia ]
It can be seen from Fig. 3.4 that the developing trend of utility model patents granted is similar to filings. The number of utility model grants grew much faster than that for inventions, which demonstrates that examination of utility model applications is less strict.
Fig. 3.3. Annual Filing Trend for Utility Models Source: The Patent Statistic Yearbook (from 1995 to 2007).
166
Fig. 3.4. Annual Trend in Utility Model Grants Source: The Patent Statistic Yearbook (from 1995 to 2007).
3.4. Numbers of Applications and Grants to Non-Residents
[ Institutional Infrastructure for IPR-Based Development in Asia ]
Since China revised its patent law in 1993, the number of invention patent applications has risen, partly due to an increase in resident patent filings, and also benefiting from increased applications by non-residents. Fig. 3.5 shows total and foreign invention patent filings from 1995 to 2007. The annual average growth rate of foreign applications was 19.6 per cent, a little lower than the growth rate for all applications (22.9 per cent). After China’s accession to the PCT in 1993, the number of applications for inventions filed by foreign applicants increased sharply. In Fig. 3.5 we see that the number of non-resident applications accounted for almost half of all patent applications, although this has recently decreased (Fig. 3.6). The top 10 countries filing patent applications with the Chinese Patent Office were France, Germany, Italy, Japan, Korea, Netherlands, Sweden, Switzerland, the UK and the US.
Fig. 3.5. Numbers of Invention Patent Applications by Non-Residents Source: The Patent Statistic Yearbook (from 1995 to 2007).
167
Fig. 3.6. Rates of Invention Patent Applications by Non-Residents Source: The Patent Statistic Yearbook (from 1995 to 2007).
The number of foreign invention patents granted increased from 1,863 in 1995 to 36,003 in 2007 with an annual average growth rate of 30.7 per cent as shown in Fig. 3.7, the same as the rate for total applications granted.
[ Institutional Infrastructure for IPR-Based Development in Asia ]
Fig. 3.8 shows that the rate of foreign invention patents granted increased after 1995. This could mean that China has removed the effect of "resident advantage" in patent examination, although the growth rate in foreign applications was lower than domestic applications: growth rates in domestic and foreign patents granted were around the same. Another possible explanation may be that the quality of foreign patent applications was higher.
Fig. 3.7. Numbers of Invention Patent Grants to Non-Residents Source: The Patent Statistic Yearbook (from 1995 to 2007).
168
Fig. 3.8. Rates of Invention Patents Granted to Non-Residents Source: The Patent Statistic Yearbook (from 1995 to 2007).
3.5. Numbers of Researchers and Levels of Research Expenses R&D is considered to be one of the most important factors in patent activities (see Figs 3.9 and 3.10). Numbers of researchers grew in China from 1995 to 2007, with only a slight decrease in 1998. Figures for researchers demonstrate that R&D activities are becoming more dynamic, and the quality of human resources has constantly improved. Expenditure on R&D increased more rapidly, especially after 2000 in which it grew at the rate of 20 per cent: in 2005, it increased 24 per cent.
[ Institutional Infrastructure for IPR-Based Development in Asia ]
The annual growth rate in research expenses was 22 per cent, and previous figures showed that the number of researchers and research expenses produced a positive correlation with patent activity. Figs 3.8 and 3.9 give the reasons for this.
Fig. 3.9. Annual Numbers of Researchers in China from 1995 to 2007 Source: China Statistical Yearbook (from 1995 to 2007).
Fig. 3.10. Annual Levels of Research Expenditure in China from 1995 to 2007 Source: China Statistical Yearbook (from 1995 to 2007).
3.6. Numbers of Patent Applications in all Areas Figs 3.11 to 3.16 show the number of invention patent applications in all areas. These are divided into 30 categories, with basic electrics (H01, H02, H05) further subdivided into basic electric circuitry and electric communication technology (H03, H04).
[ Institutional Infrastructure for IPR-Based Development in Asia ]
In section A, the majority of the applications were in the field of medical machinery and medicines (see Fig. 3.11), followed by household utensils.
Fig. 3.11. Annual Numbers of Invention Patent Applications in Section A Source: SIPO website.
170
In section B, the majority of invention patent applications were for cutting material processing (see Fig. 3.12); patent filings increased from 1995 to 2007. This was followed by similar figures for cars, shipping, airplanes; metal processing production machinery and container packaging.
Fig. 3.12. Annual Numbers of invention Patent Applications in Section B Source: SIPO website.
[ Institutional Infrastructure for IPR-Based Development in Asia ]
As is shown in Fig. 3.13, under section C, invention patent applications in all areas rose sharply. The number of patent filings in organic chemistry (C07) and biotech, beer, alcohol, sugar and industry (C12-C14) increased very rapidly in 2000. For metallurgy and metal treatment (C21-C30), patent filings showed sustained growth and reached a peak of 11,126 in 2006.
Fig. 3.13. Annual Numbers of Invention Patent Applications in Section C Source: SIPO website.
As shown in Fig. 3.14, in the areas of textile treatment, paper, road construction railways and drilling, patent applications accounted for a large share of the total, with an annual growth rate of 18.81 per cent from 702 in 1995 to 4,349 in 2007. Textile treatment showed steady growth in applications from 761 to 3,224 for the same period: patent applications for paper represented a small part of total applications and trends were unclear. Drilling applications increased from 132 in 1995 to 869 in 2007.
171
Fig. 3.14. Annual Numbers of Invention Patent Applications in Sections D and E
Fig. 3.15 shows the situation of invention patent applications in section F. Patents for machinery, engines and pumps increased at the rate of nearly 17.82 per cent from 1995 to 2007, growing more rapidly from 2002 and peaking in 2006. Engineering increased slightly faster than machinery: patents for lighting also showed sustained growth at 17.7 per cent. Numbers in these three fields show that patent activity has become more dynamic as the result of the promotion of the national patent system and with more emphasis on innovation. Numbers for weaponry grew very slightly compared with the other three fields (see Fig. 3.15). This demonstrated improvements in innovation and the pursuit of peace.
[ Institutional Infrastructure for IPR-Based Development in Asia ]
Source: SIPO website.
172
Fig. 3.15. Annual Numbers of Invention Patent Applications in Section F Source: SIPO website.
[ Institutional Infrastructure for IPR-Based Development in Asia ]
Fig. 3.16 shows numbers of invention patent applications in sections G and H. Basic electric accounted for a large portion of the total, followed by basic electric circuitry, electric communication technology and measuring-optics.
Fig. 3.16. Annual Numbers of Invention Patent Applications in Sections G and H Source: SIPO website.
3.7. Fees Relating to Patent Procedures
173
According to the Patent Law and its implementing regulations, fees are payable on filing an application and completing the formalities.
[ Institutional Infrastructure for IPR-Based Development in Asia ]
Table 3.2. List of Fees
[ Institutional Infrastructure for IPR-Based Development in Asia ]
174
175
Source: Translated by author from the SIPO website. Note: Regulations of fee reductions and postponement
a) The methods of Reducing and Postponing payment of fees shall continue to apply to service inventor (entity) and no service inventor (individual) where it or he has difficulty in the payment of patent fees. The subjects of reduction and postponement are application fee, invention maintenance fee, invention examination fee, Reexamination fee and annual fee for 3 years since the patent is granted. The requirements for reduction and postponement shall be implemented in accordance with the related provisions of the National Intellectual Property Office.
4. Protection of Traditional Knowledge through IPRs IPR protection for traditional knowledge mainly includes Copyright, industrial designs, geographical indications (GI), trademarks, patents and plant variety protection (PVP). In China, IPR protection for TK has been designed so as to benefit both creators and rights holders. The following is a summary of IPR protection in China for folklore, literary and artistic works, biodiversity, TK and TCM. A detailed analysis of TCM patents is also provided.
4.1. The status quo for Chinese Traditional Knowledge China boasts an ancient civilization with a long history dating back over 5,000 years. In this period, a splendid culture has been created, which not only includes scientific knowledge such as the world-famous "four great inventions", but also a variety of literary and artistic works and a tangible cultural heritage composed of many precious cultural relics and sites. China is also a multinational country with 56 nations; all with their own cultural features. Its animal and plant species are rich and diverse and gene resources abound. It is therefore no exaggeration to say that China is the world's largest and most populous developing country and also has one of the world’s richest traditions in TK.
[ Institutional Infrastructure for IPR-Based Development in Asia ]
b) The proportion of reduction and postponement for application fee, invention examination fee and annual fee for 3 years since the patent is granted is adjusted from 60 per cent to 70 per cent for service invention, from 80 per cent to 85 per cent for no service invention. And the proportion of reduction and postponement for invention maintenance fee and reexamination fee shall be still implemented in conformity with the existing regulations, that is, 60 per cent for service invention and 80 per cent for no service invention.
176
(1) Traditional Medicines An explanation of traditional medicine in the China Encyclopedia is: “Chinese traditional medicine is the general designation of each national medicine in China, including Han medicine, Tibetan medicine, Mongolian medicine, Uygur medicine, Korean medicine, Zhuang medicine, Dai medicine, Yi medicine, and Miao, Laku, She, Olunchun, etc.” According to this, TCM is the general designation for Chinese medicine (namely Han medicine) and the other minority traditional medicines (namely national medicine). After the foundation of new China, many books were published by academics, announcing the results of scientific research into the identification of TCM and its essential components. These include: Chinese Medicinal Materials published in 1979, which analyses almost 1,000 prescriptions; the Encyclopedia of Chinese Medicinal Materials published in 1977 includes nearly 5,760 prescriptions; Chinese Herbal Medicine Color Graphic published in 1982, provides more than 5,000 kinds of medicine; the New Abstract of Chinese Herbal Medicines published in 1988, mentions over 6,000 kinds of medicinal plants; the Chinese Herbal Medicine Color Atlas published in 1988, provides more than 35,000 kinds of Chinese medicinal herbs.
[ Institutional Infrastructure for IPR-Based Development in Asia ]
(2) Folk Literature and Art Chinese folk literature and art has a long and rich history. It includes all kinds of folk handicrafts with various styles and exquisite craftsmanship, for example: ceramics, lacquer products, engraving, Brede, jewelry enamel, jade, kites, Bandhnu, shadow plays, scissor-cuts, etc; and a unique variety of local operas, such as the Peking opera, Kun opera, Shaoxing Opera, Henan opera, Huangmei opera, Yangzhou opera, etc; many rich, colorful and magic folk stories and epics, for example: Nvwa Mends the Sky; KuaFu Runs after the Sun; The Cowherd and the Weaving Maid; Liangzhu Love Story, etc. Folk literature and art also include ballads, folk riddles, folk music, ritual and folk customs, etc. So far, China has collected almost 3,020,000 ballads, nearly 7,480,000 traditional folk proverbs, 450,000 folk songs, nearly 10,000 pieces of instrumental music, 1,840,000 folk stories and more than 340 forms of folk art from all over the country, as well as more than 350 folk operas, and nearly 1,000 folk dances. In 2001, China’s Kun opera was selected as one of the 19 projects named Human Oral and Intangible Heritage by UNESCO. In 2003 China's Ancient Qin was declared second out of a total of 28 projects in this category. (3) Biodiversity-Related TK Biodiversity means diversification and variety among living organisms and the ecological complexity of habitats; it covers all plants, animals and microbes, making up three composite parts (species diversity, genetic diversity and ecosystem diversity). According to the definition in the Convention on Biological Diversity, biodiversity means varieties among living organisms from all sources including, inter alia, terrestrial, marine and other aquatic ecosystems and ecological complexes, which include diversity within species, between species and ecosystems. China's vast geography, diverse types of climate, complex natural and geographical conditions supply habitats for the formation and development of all types of biology and ecosystems as shown below. ① Wide diversity. China has more than 30,000 higher plants and the greatest numbers of gymnosperm in the world: it has 6,347 kinds of vertebrates, accounting for nearly 14 per cent of the world total. ② Many kinds of genera and species. The number of species is greatest in the higher plants with nearly 17,300, which accounts for more than 57 per cent in all species of Chinese higher plants.
③ Flora of ancient origin. ④ Resources of germplasm of cultivated plants, domestic animals and their wild relatives are very rich. China is the cradle of the rice and soybean industry, with varieties of up to 50,000 and 20,000 respectively. The country has more than 11,000 kinds of medicinal plants. ⑤ Rich and varied ecosystems.
177
4.2. Protection of Folk Literature and Art through IPRs A country’s folk literature and arts protection system often consists of: a public right guarantee and private right protection. The government is the holder of public right guarantees, which is an administrative protection. For example, it can use its powers to enable folk literature and arts to continue to exist. Private rights belong to the rights holder, i.e. granting the holder a certain degree of moral right and the right of material compensation if he/she makes the works available for legal use, thus avoiding piracy, distortion and unauthorized use. For related provisions of IPR protection of folk literature and arts, we have the Traditional National and Folk Culture Protection Regulation for Yunnan and Guizhou Provinces, Preservation Laws on Historic Relics of the People's Republic of China, the Copyright Law of the People’s Republic of China and Regulations on the Protection of Traditional Arts and Crafts.
[ Institutional Infrastructure for IPR-Based Development in Asia ]
Table 4.1. Legal Protection for Traditional Knowledge in China
Source: drawn up by the author.
178
4.3. Protection of Biodiversity-Related TK through IPRs 4.3.1. New Plant Varieties IPR protection for new plant varieties in China is based on the Regulations on the Protection of New Varieties of Plants issued on March 20, 1997, entering into effect on October 1, 1997. There are two regulations, one relating to agriculture and one to forestry. Both have been implemented by the Ministry of Agriculture of New Varieties of Plants Protection of the Office of the State Forestry Administration and the Office for the Protection of New Varieties of Plants. The Seed Law, promulgated on July 8, 2000, effective on December 1, 2000 and amended on August 28, 2004, is another regulation to protect germplasm resources, breeding and identification, seed production, operation, use, quality control, imports and exports and foreign cooperation. The People's Court promulgated Several Issues of Regulations on the Hearing of New Varieties of Plants disputes on February 5, 2001, which identified the court’s scope for settling new disputes. These constitute the basic framework for rights protection in new plant varieties. In addition, China signed up to the 1978 Act of the International Convention for the Protection of New Varieties of Plants (UPOV Conventions) on April 23, 1999 and its "Regulations on the Protection of New Varieties of Plants" basically meets the requirements in this convention. According to the regulation, if new plant varieties are cultivated by using traditional methods of science and technology in the artificial cultivation of wild plants or varieties developed in the process of cultivating new plant varieties, they may also obtain rights protection. Therefore, the new plant varieties are considered the legal mechanisms of TK.
[ Institutional Infrastructure for IPR-Based Development in Asia ]
4.3.2. Endangered Species The International Trade Convention in Endangered Species of Wild Fauna and Flora (Washington Convention) was signed in Washington in 1973 and China joined in 1981. This Convention protects endangered species from “over-exploitation by the process of international trade”, and also protects biodiversity by adjustment in the special area of endangered species-related international trade. The Washington Convention has become the main framework for the international trade law on species, and it is considered to be the most comprehensive convention on the trade in endangered species at the present time. The members often use international trade law criteria, which are similar or stricter than their own wildlife protection laws and China’s is no exception. For example, the Law on the Protection of Wild Fauna and Flora, the Law on the Protection of Wildlife promulgated in 1998 and the Foreign Trade Law promulgated in 1994, embody all the requirements of the Convention. Criminal Law covers valuable Animals, rare plants and their products, smuggling and illegal purchase, transportation and sale of precious endangered species of wild animals and plants and their products. In addition, in order to provide better protection for wild plants, China has successively promulgated the Law of the People's Republic of Forest", (Regulations on the Protection of the People's Republic of wild plants) and "the measures of the protection of agricultural wild plants”, so that wild plant resources benefit from the basic legal protection system.
4.3.3. Seeds The State Council issued regulations on seeds on March 13, 1989: the Seed Law passed on July 8, 2000 and came into effect on December 1, 2000, replacing previous regulations. For the protection of seed resources, Article 8 of the Seed Law stipulates that: The State Protects germplasm resources in accordance
with the law, and no units or individuals may seize or impair germplasm resources. Article 10 stipulates: The State has the sovereign right over germplasm resources. Any unit or individual wishing to provide germplasm resources to people outside China shall seek approval from the administrative department for agriculture or for forestry under the State Council; Any introduction of germplasm resources from abroad shall be handled in accordance with the relevant regulations laid down by the administrative department for agriculture or for forestry under the State Council.
179
Overall, China's biological resources protection lacks a master plan and problems arise mainly on the two following aspects: (1) The existing legal system needs to be improved. Existing laws and regulations do not cover all biological resources; i.e. there is no clear provision on animal and microbial protection of new plant varieties. The Regulations on the Protection of New Varieties of Plants covers varieties of plants and the protection of the rights holder, together with the use of genetic resources and exchange activities, but there are very few provisions on these activities. The long-term preservation and use of local species and protection measures for local communities and farmers are not clearly defined, particularly under biological genetic resources and benefit-sharing and the basic aspects of the patent system has been left blank. Very few provisions for promoting the development and exchange of genetic resources, such as the use of marketbased trading mechanisms, are provided. (2) Some provisions are too abstract and lack flexibility. At present, laws and regulations relating to genetic resources emphasize administrative measures and some major management provisions and operation programs. For example, there are no specific provisions for benefit sharing and conflict resolution between the species owner, user and transferor under the Seeds Law. The Regulations on the Protection of New Varieties of Plants emphasize the protection of plant variety rights, but neglect the rights of the user.
The Patent Law implemented in 1985 protects the pharmaceutical manufacturing process, although drugs and materials obtained through chemical methods have not been granted patent protection. In order to make patent protection levels more consistent with international norms, China amended the Patent Law in 1993. This broadened the scope of patent protection, granted formal protection for medicinal inventions, and extended the protection period to 20 years. In 2000, China again revised this law, to make it consistent with the TRIPS Agreement. Patent applications for TCM were limited to methods and equipment used before 1993, and only involved products after 1993. Chinese medicinal products, methods of and new uses for TCM, can be applied as invention patents as long as they are considered novel, have an inventive step and practical applicability. In addition, the Patent Law protects the appearance, shape and packaging under designs and utility models. The patent system can be used to protect technical solutions which are novel, have an inventive step and practical applicability; these technical solutions being either products or methods. For genetic resources and TK, patents can be granted to products synthesized or developed from the existing gene structure, microorganisms, plants, animals, organic in nature, as well as the methods related to using and developing these resources, which are consistent with these requirements and well known to the public. All technological achievements based on the application of gene and biological resources and undisclosed technology which can obtain useful results can in principle be protected by patent law.
[ Institutional Infrastructure for IPR-Based Development in Asia ]
4.4. Protection of TK through IPRs
180
4.5. Protection of Traditional Chinese Medicine (TCM) through IPRs 4.5.1. Introduction to TCM The history of TCM can be traced back 5,000 years to the time of Shennong, a divinity credited with the discovery of medicinal herbs. According to Chinese legend, Shennong took it upon himself to test, one by one, hundreds of different plants which were poisonous to humans to discover their nutritional and medicinal properties. Over the millennia, the Chinese have used themselves as guinea pigs in the same way to continue testing plants for their properties of cold (寒), heat (热), warm (温), and cool (凉). They classified the medicinal effects of the plants on the various parts of the body, and then tested them to determine their toxicity and lethal dosages, etc. The theoretical framework for Chinese medicine was established more than two millennia ago and a great deal of ancient medical knowledge is preserved in the pre-Qin (221-207 BC) Inner Cannon (Nei Jing), a comprehensive record of Chinese medical theories up to that time. The Han dynasty (206 BC-220 AD) produced an authoritative and valuable practical guide even by present day standards for the treatment of illness, the Treatise on Diseases Caused by Cold Factors (Shang Han Lun) by Zhang Zhongjing. One of the best-known Chinese medical works is the Materia Medica (Beng Cao Gang Mu), compiled during the Ming Dynasty (1368-1644 AD) by Li Shizhen, This encyclopedic work heralded a new era in the world history of pharmacology. It includes descriptions of 1,892 different kinds of medicines. These works have all been translated into several languages, and have had a profound influence on East Asian and European countries.
[ Institutional Infrastructure for IPR-Based Development in Asia ]
Plants have been used as medicine for millennia. The important role of traditional medicine (TCM in China and complementary and alternative medicine in the West) and its profound influence on the healthcare system is well recognized at home and in Chinese communities worldwide. It has been confirmed by the World Health Organization (WHO) that herbal medicines serve the health needs of about 80 per cent of the world's population, especially for millions of people in the vast rural areas of developing countries. Meanwhile, consumers in developed countries are becoming disillusioned with modern healthcare and are seeking alternatives. Fig. 4.1 gives examples of the widespread use of traditional medicine. In Africa, as is often stated in government reports, the majority of people continue to use traditional medicine to meet their primary healthcare needs.22
22
WHO, Traditional Medicine in the African Region: An Initial Situation Analysis (1998-1999). WHO Regional Office for Africa, Harare, 2000.
181
Fig. 4.1. Use of Traditional Medicines in Selected Countries Sources: WHO, compiled from government reports.
According to WHO's reports, in many Asian countries traditional medicine continues to be widely used, even though allopathic medicine is often readily available. In Japan, 60 per cent to 70 per cent of allopathic doctors prescribe kampo medicines for their patients: in Malaysia, traditional forms of Malay, Chinese and Indian medicine are used extensively. Likewise, in Latin America, 71 per cent of Chileans and 40 per cent of Colombians have used traditional medicines.
The 1985 Patent Law did not protect materials obtained by chemical processes and drugs; only manufacturing methods for drugs can be granted patent rights. After the first revision on January 1, 1993, the Patent Law began to protect drugs. Meanwhile, it stipulates that this does not cover diagnosis, treatment and surgical procedures on humans or animals. Therefore, the current law protects the invention of Chinese medicinal products; manufacturing methods;, invention of new uses for Chinese medicine or invention of medical devices, etc. However, TCM and the minority’s ethnic medicines cannot be protected as most are not novel, have no inventive step or practical applicability according to the patent law. For instance, traditional prescriptions, processing and cultivation technologies, aquaculture technology, etc, all featured in ancient Chinese medicine and modern medical books belong to the public domain. We also know that there are many shortcomings in the protection of TCM through patents. These require a strict patent examination review, approval of a long cycle, a short period of protection, difficulty in determining infringement, and inventors’ misunderstandings of patent rights, etc. In order to protect TCM, IP protection in China uses two main measures: administrative protection for new medicine and the Chinese medicine varieties protection, both of which are applied to ethnic medicine. For example, Ren Qing Mang Jue obtained protection from the State Health Ministry in 1996. The Drug Administration Law, which was passed in September 20, 1984 and revised on February 28, 2001, makes provision for new medicines and varieties of TCM. Article 3 of the law provides that: The State develops modern medicine and traditional medicine, and makes full use of them in prevention medical and health care. The State protects the wild medicinal resources and encourages cultivating medicinal herbs. Article 4 of the law provides that: The State encourages research and creation of new drugs and also protects citizens, legal persons and other organizations’ legitimate rights and interests in researching and
[ Institutional Infrastructure for IPR-Based Development in Asia ]
4.5.2. Protection of TCM through IPRs
182
developing new drugs. Article 36 provides that: The State practices traditional Chinese medicine variety protection system and the specific method would be developed by the state council. (1) The Protection of Varieties of TCM On October 14, 1992, the State Council published Regulations on the Protection of Traditional Chinese Medicine Varieties which took effect on January 1, 1993. Varieties of TCM manufactured and produced in China, including TCM patent prescriptions, extracts from natural medicines and their preparation are protected by this regulation. This regulation is not applicable to Chinese medicine varieties for which patent protection has been applied. It is evident that these have a very limited scope of application. The TCM varieties that can apply for protection from the regulations, such as TCM patent prescription, extracts from natural medicine, its preparation and TCM‘s artificial products, etc. Requirements for applying for protection are broad and have no need to show novelty or an inventive step. Protection for drugs which have been publicly disclosed or publicly used can still be applied. The regulations provide a term of protection of 30 years, 20 years and 10 years respectively for first-class TCM; and seven years for second-class TCM. However, the regulation is administrative and its effect is weaker than the Patent Law. The disadvantages of the regulations are as follows. First, they focus mainly on TCM varieties but not their effective composition. Second, they protect the producer but not the seller, and they control the circulation of herbal medicines by controlling their production. Third, companies producing TCM imitate each other and offer the same product. Fourth, protection is limited to the domestic market: it has no effect abroad.
[ Institutional Infrastructure for IPR-Based Development in Asia ]
(2) Administrative Protection for New Medicine New medicine refers to medicine which has not already been on sale in China. It includes Chinese medicine, chemicals and biological products which fall into five categories. The conception of new medicine is limited to the domestic area, it can be regarded as a new drug that has not been sold at home, even though it has a patent right, or has been sold and/or recorded in foreign pharmacopoeia. Therefore, the novelty requirement for new medicines is wider than under the Patent Law. China has a weak pharmaceutical industry, compared with a developed country’s ability to produce new drugs, especially in terms of new chemical medicines and the development of new bio-medicines. For a long time, the government encouraged and supported its citizens, corporations and other organizations to actively and creatively research and develop new drugs, thus avoiding replication. Meanwhile, in order to maintain the pharmaceutical technology market trade system, the government established a system for the protection of new drugs, taking a series of practical measures and formulating a series of laws, rules, regulations and policies. The health department issued Rules Governing the New Drug Protection and Technology Transfer in 1987, which provides eight, six, four and three years’ protection for new drugs in classes one, two, three and four, marking the establishment of administrative protection for pharmaceuticals. When the State Drug Administration was established in 1998, it amended the Provisions for New Drug Approvals (promulgated on July 1, 1998 and again on April 22, 1999) to correspond with Drug Control Law and Rules Governing the New Drug Protection and Technology Transfer (promulgated in 1987 and again on April 22, 1999) and extended the protection period for new drugs, making their development more beneficial. According to the Drug Control Law, the State Council promulgated Regulations for Implementation of the Drug Administration Law, with effect from September 15, 2002. These new measures also went into
effect on October 1, 2007. Under these two important pieces of legislation, the administrative protection of new drugs which lacked a legal basis was canceled and replaced by the TRIPS Agreement.
183
(3) Current Legal Protection for TCM The protection of TCM varieties and the administrative protection of new medicines are all suitable for IP protection. In addition, China also passed a number of laws and regulations beyond the field of intellectual property. For example, the State Council passed Regulations on the Protection and Management of Wild Chinese Medicinal Material Resources in October1987 and the Regulation of Traditional Chinese Medicines on April 7, 2003. Since 2001, great changes have been made in the administration of regulations for the domestic pharmaceutical industry. Upon the adoption of the Medicine Administration Law (revised) at the 20th Meeting of the Standing Committee of the Ninth National People’s Congress on February 28th, 2001, the former systems were replaced by an inspection and measurement period for a maximum of five years. Meanwhile, patent right protection for registration of medicines was reinforced. Such a change in the state pharmaceutical manufacturing demonstrates that the Chinese administration system in this field is in line with the international system. From then on, patent protection would become a new competition rule in the field of pharmaceutical manufacturing thereby providing a better environment for work on patent affairs in pharmaceutical (especially TCM) manufacturers. Additionally, the construction of the Traditional Chinese Medicine Patent Database (CTCMPD) meant that computerizing TCM patents made considerable progress.
(1) CTCMPD As sown, TCM has played an important role in treating disease. The cost of developing new allopathic medicines is very high: the costs for one drug can be between 80 million and several billion US dollars. Moreover people are rapidly developing drug resistance, which is why they have begun to pay close attention to inexpensive and effective natural remedies. The rapid growth of patent applications in natural medicines mirrors this trend: by 2001, the number of patent publications on TCM exceeded 50,000 worldwide. Since the Patent Law came into force in April 1985, the number of China’s TCM patent publications has increased rapidly year-on-year. At the same time, it became more difficult for patent examiners to search TCM-related patent documents effectively by using existing databases and without proper IPC classifications for the different traditional medicines and with many different names for each TCM component, (standard name, scientific name and other synonyms, Latin name used for the same medicine in patent documents). To solve this problem and provide an effective means to search TCM-related patent documents, SIPO created the China TCM Patent Database (CTCMPD) with greatly enhanced search functions. This sophisticated system was completed in March 200223 and achieves a high rate of recall and precision: the SIPO patent examiners are very satisfied with it. In order to be able to present the database at a WIPO Conference in 2002,24 an English demo version was built and has been opened up through WIPO. A sample database record from the English version is given below:
23
http://chmp.cnipr.cn/tcm_patent1/chineseversion/login/index.asp..
24
The Third Session of the Intergovernmental Committee on Intellectual Property and Genetic Resources, Traditional Knowledge and Folklore held in Geneva, June 2002.
[ Institutional Infrastructure for IPR-Based Development in Asia ]
4.5.3. China’s TCM Patent Database
[ Institutional Infrastructure for IPR-Based Development in Asia ]
184
Table 1. Data for Economic Model Analysis
Source: SIPO’s website.
(2) CTCMPD Search Fields There are 29 search fields in the database, which fall into the following four categories: bibliographic information, subject index terms, uses/effects and TCM formulas. These fields were designed to meet different requirements, some of which are given below:
Source: SIPO’s website.
(3) Search Approaches in CTCMPD There are several ways to use the database: quick search, advanced search, TCM formula search and search history.25 The quick search facility provides a simple search interface with a text search for the entire contents of the database. Users, especially lay users, are able to conduct searches easily and effectively. The advanced search enables users to make nested Boolean searches and field searches. They may use keywords/phrases, Boolean operators and parentheses for a complex search query The TCM formula search facility includes TCM formula logic search and TCM formula similarity search. The TCM formula logic search enables users to search formulas with nested Boolean search queries. The TCM formula logic search also features a limit function which specifies the number range of components contained in the target formulas. The search history can be recalled and used later to refine a search. Users may choose to display the results by TCM formula or by application number.
25
Yanhuai Liu and Yanling Sun, China Traditional Chinese Medicine Patent Database, World Patent Information 26(2004) 91-96.
185
[ Institutional Infrastructure for IPR-Based Development in Asia ]
Table 4.3. Names and Codes of Search Fields in CTCMPD
186
One problem patent examiners often face is how to search, for example, all formulas containing any seven out of 10 components. With Boolean search, one needs to conduct 120 searches, which is obviously not feasible for patent examiners. Similarity searches have been developed to meet this need with a single flexible query. Thus, the TCM formula similarity search facility is particularly popular with SIPO patent examiners. Search histories can be saved automatically with the search history function except for a TCM formula similarity search. Users can further refine their searches with this function by using search set numbers, Boolean operators, parentheses and other words/phrases to construct new queries.
[ Institutional Infrastructure for IPR-Based Development in Asia ]
(4) The TCM Dictionary The TCM dictionary is an aide for TCM patent search or TCM formula search. In this file, a unique record is created for every TCM, which includes its Latin drug name, English drug name, Latin plant/animal/mineral name, Chinese standard name, Chinese synonym, Chinese pinyin name (see Fig. 4.2). Users can find a specific TCM through any of these methods and then, using the standard Latin or English drug name or the standard Chinese names/synonyms, search the bibliographic patent file or the TCM formula file. The file crossover search function can be implemented by clicking the file crossover search button after selecting the TCM names.
Fig. 4.2. Example of a TCM Dictionary in CTCMPD Source: http://chmp.cnipr.cn/tcm_patent1/chineseversion/help/help.html.
This TCM database offers high search efficiency, search quality and powerful search functions and SIPO examiners are highly satisfied with the results obtained.
187
4.5.4. Statistic Analysis of TCM Patents in China (1) Brief Introduction Chinese Medicine (CM) is one of the largest medical industries in the world. It usually includes Chinese medicinal materials, processed product from Chinese crude drugs, Chinese herbal compounds, Chinese patent medicine preparations, etc. With the extension of modern medicine in China, people started to use CM to treat diseases which are described in allopathic medicine. CM, classified into TCM and Modern Chinese Medicine (MCM), means that preparations made by traditional methods and their functions are expressed in terms of TCM under the theory of CM. MCM is a preparation made by non-traditional techniques, its function expressed in terms of modern medicine. Western Medicine (WM), besides chemosynthesis, abstracts active ingredients from a crude substance (such as herbaceous plants, animals, microorganisms and minerals, etc.) using modern technology. Its indicators depend entirely on modern pharmacological models. This kind of medicine is regarded as natural medicine in the field of pharmaceutical science.
After China’s entry into the WTO, the Medicine Administration Law (2001) replaced the former new medicine protection system, strengthening patent protection for medicine, thus the role of the patent system became more important in this field. The effectiveness of patent protection will determine whether CM will retain its competitive advantage. Therefore, our study collected data on patent applications and grants in this field, analyzing the status quo and the developing trend in CM technology. (2) Data Source and Construction Since China’s patent system was established in 1984, two revisions have been introduced. The first amendment was in 1993, extending the life of a patent from 15 to 20 years for invention patents and five to 10 years for utility models and design patents, as well as providing patent protection for pharmaceutical production. The second amendment was in 2000, in order to comply with TRIPS requirements, after which special conditions for state-owned enterprises were abolished and procedures for patent application, grant and rights transfer were significantly simplified. We focused on category A61K35 (medicinal preparations with undetermined constitution), and collected data on all patents in all sub-categories in A61K35 which were accepted by SIPO from 1985 to 2007. The collection of data included physically searching the relevant records at SIPO, since this information is not available in electronic form. We also examined hard copy filings as well as The SIPO Gazette.
[ Institutional Infrastructure for IPR-Based Development in Asia ]
The three kinds of drug inventions introduced above are treated as CM in our study. All patent applications related to CM are classified under IPC A61K35/00 and referred to as TCM in this report.
188
(3) Summary CM are mainly situated within “medicinal preparations with undetermined constitution” (A61K35).26 For the period 1985 to 2007, there were approximately 37,714 publications under “medicinal preparations with undetermined constitution” (A61K35) (Table 4.4). This includes a wide range of materials (i.e. from embryos, ovaries, snakes, leeches, algae, etc.) but is dominated by plant materials (A61K35/78) with 28,019 patent publications recorded during the period 1985 to 2007 (27,709 on invention patents and 310 on utility model patents). If we consider TCM inventions in terms of patent types, most of them were invention patents (37,353 patent publications, accounting for 99 per cent of the total number); there were 361 utility model patents (about 1 per cent of the total) and no design patents (Fig. 4.3).
[ Institutional Infrastructure for IPR-Based Development in Asia ]
Table 4.4. Annual Statistics of TCM from 1985 to 2007
Source: SIPO’s Patent Search Platform: http://www.sipo.gov.cn/sipo2008/zljs/.
26
In recognition of the strength of patent demand in this area and the concerns of developing countries, new indicators have been introduced within IPC8 to replace classifier A61K35/78. This consists of a series of classifiers under A61K36 to describe species, genera and families of plants.
189
Fig. 4.3. Analysis of Patent Types of TCM Inventions from 1985 to 2007 Source: http://www.sipo.gov.cn/sipo2008/zljs/.
In order to meet the requirements for China’s entry into the WTO and harmonize the Patent Law with the TRIPS Agreement, the former was further revised in 2000. This caused the number of TCM patent applications to increase sharply. Between 2001 and 2007, there were more than 2,500, reaching a peak of 4,174 in 2003.
Fig. 4.4. Annual Trend of TCM Patents Source: http://www.sipo.gov.cn/sipo2008/zljs/.
[ Institutional Infrastructure for IPR-Based Development in Asia ]
(4) Tendency As for trends in TCM inventions, 1993 and 2001 were particularly important. What is certain is that this situation is related to the two revisions of the Patent Law. Before the first revision in 1985, the Patent Law only protected the process or methods of producing TCM, and the number of TCM patent applications was under 500 per year; however, after the first revision production of TCM was also protected. From 1993 to 2000, there were more than 1,500 TCM patent applications per year.
190
Fig. 4.5 analyzes the situation for TCM patent applications from1985 to 2000. It should be pointed out that applications for patents involving TCM have shown a steep increase since 1992 when the Patent Law was amended and have maintained this trend. Nevertheless, granted patents are not so numerous the main reason being that a large number of applications are seen as abandoned, including a few rejected by SIPO.
Fig. 4.5. Analysis of TCM Patent Applications from 1985 to 2000 Source: SIPO’s Patent Data Center.
[ Institutional Infrastructure for IPR-Based Development in Asia ]
After China’s entry into the WTO, foreign applicants (including individuals, companies and institutions) filed around 10,000 TCM patent applications; however, there were around 1,000 TCM patents filed abroad by domestic entities. Sales figures for TCM reached 16,000 million US dollars in the international market, of which about 80 per cent was accounted for by Japan; 10 per cent by Korea, and around 5 per cent by China. (5) Analysis of TCM Patents Granted Fig. 4.6 shows that 78 per cent of the patents granted by SIPO were non-employee inventions by individuals, with domestic employee inventions accounting for just 21 per cent, (1 per cent from foreign applicants). Among employee inventions, Fig. 4.7 shows that corporations ranked highest (56 per cent), followed by hospitals (32 per cent) and universities/institutions (12 per cent).
191
Fig. 4.6. Distribution of TCM Patents Granted
Fig. 4.7. Distribution of Employee Inventions Source: Chinese Patent Research System (CPRS).
Fig. 4.8 shows the top 10 countries for which plant medicine applications have been granted by SIPO: the top three being Japan (24), Korea (21) and the US (19).
[ Institutional Infrastructure for IPR-Based Development in Asia ]
Source: Chinese Patent Research System (CPRS).
192
Fig. 4.8. Top 10 Patents Granted by SIPO Source: Chinese Patent Research System (CPRS).
[ Institutional Infrastructure for IPR-Based Development in Asia ]
(6) Changes in Distribution of TCM Patents and Reasons Foreign applications for TCM patents account for less than 1 per cent, leaving domestic applications in the majority. According to the distribution of applicants, non-service inventions decreased year-on-year, while service inventions increased. The ratio of service inventions to non-service inventions was 1:5 (1:11 in 2001). This is explained by analyzing the reasons for patent practice in pharmaceuticals. Inventions require a large number of pharmacological tests and clinical trials in the period between patent grant and obtaining permission to market. The cost of such development is in the 100,000s of US dollars, which individuals cannot afford. Without such research, no examination is conducted nor approval given for a new medicine by the State Medicine Supervising and Administrating Bureau, nor can a new certificate and permission to produce be acquired. As a result, TCM patents for non-service inventions meet a strong obstacle in obtaining permission to market: although a TCM patent right may be granted, the product cannot be sold without market permission. Although the patentee cannot yet reap the benefit, he still has to pay the annual fee to maintain his right. As a result, individual holders of TCM patents tend to abandon their patent rights, resulting in a decrease in individual applications. Due to publicity on patent policies and higher awareness about patent protection in companies, as well as the change in rules of competition in the pharmaceutical industry, the medicine practice body, pharmaceutical manufacturers, R&D bodies and scientific research institutions, began to seek patent protection. As a result, patent applications for service inventions have increased rapidly and it is predicted that such an upturn will continue. In general, TCM patent applications show a favorable trend; their technical content is improving and the distribution of TCM applicants is changing as China’s patent system can provide a fairer and more equitable environment for technique and market competition and can exert a strong influence on the modernization and industrialization of TCM.
5. Protection of Biotechnology in China through IPRs
193
A commonly accepted view among academics and policy makers is that the wave of innovation and investment based on information and communication technologies (ICT) will be followed by biotechnology.27 Biotechnology is the application of scientific and engineering principles to the processing of materials by biological agents. In the field of biomedicine, the biotechnology industry uses the genetically based characteristics in microorganisms and animals to create drugs and drug therapies. Biomedical research has produced drugs to treat cancer, hepatitis B, asthma, AIDS and numerous other afflictions. As a result of these medical breakthroughs, there has been an increased need for culture and plant stock collections which can provide the basic source material for later genetic modification of existing organisms. The result of a genetic modification may be the discovery of a new cure or treatment for a disease. Biotechnology has also been utilized to treat growing environmental and agricultural concerns. For example, several companies have used biotechnology to produce an insecticidal protein that is effective against certain harmful insect species. In addition, many companies are genetically engineering animals and plants, either to produce a higher yield or increase quality. Due to the substantial benefits already achieved, the world has come to rely on biotechnological research for advances in agriculture.
5.1. Historical Development of Patent Protection for Biotechnology Patent protection can aid the development of biotechnology. Since as much as twenty-five per cent of the world’s IP-related trade involves biotechnology, many counties have realized it is important to protect biotechnology patents.
From April 1, 1985 to December 31, 1992, according to Article 25 of the Patent Law which provided a list of subject matter excluded from patent protection, "pharmaceutical products and substances obtained by means of a chemical process" and "animal and plant varieties" could not be patented.28 Therefore, biological products obtained through biological methods could not be patented because biotechnology came under the heading of chemicals according to the rules of patent classification. Only methods of obtaining biological organisms, methods of genetic engineering and methods of microbiology could be patented. Because certain countries felt that patent protection for their work was insufficient in China, on January 17, 1992 the US and China signed a Memorandum of Understanding (MOU) to solve these problems. Under this MOU, China made amendments to its Patent Law in 1993. Among the most substantial changes were the extension of the duration of patent protection from 15 years to 20 years for inventions and from five to 10 years for utility models and designs and enlarging the scope of patent protection to new pharmaceutical and chemical inventions.29 Therefore, the scope of patent protection for biotechnology was extended, i.e. inventions of microorganisms, genetic material and biological products could also be patented.
27
OECD. Biotechnology Indicators and Public Policy (STI working paper 2003/5), June 25, 2003, p.5.
28
Patent Law, Article 25, 1985 edition.
29
The Patent Law, Article 25. 1993 edition.
[ Institutional Infrastructure for IPR-Based Development in Asia ]
The latest revision to the Patent Law was promulgated on December 27, 2008, further enhancing protection of patent rights in biotechnology and bringing China’s patent system in this area close to the levels of developed countries. The development of patent protection for biotechnology in China can be summarized as follow.
194
On January 1, 1994, China signed up to the Budapest Treaty on the International Recognition of the Deposit of Microorganisms for the Purposes of Patent Procedure and became a formal member on July 1, 1995. At the same time, the China General Microbiological Culture Collection Center (CGMCC) and the China Center for Type Culture Collection (CCTCC) became international microbiological culture collection units. These enabled domestic and foreign inventors of biotechnology to apply for and obtain patent protection at home and abroad. In addition, on October 1, 1997, China implemented the Regulations of the Peoples Republic of China on the Protection of New Varieties of Plants which provides special protection for plant varieties. In 2000, the Patent Law was further revised to conform to the TRIPS Agreement and to harmonize Chinese IP standards with international rules. The amended law took effect on July 1, 2001 and its main changes included improved judicial and administrative protection, improved patent application procedures, simplified patent enforcement procedures, etc. Moreover, examination guidelines introduced a new concept in biological materials30. The term “biological materials” means any material containing genetic information and capable of reproducing itself or being reproduced in a biological system, such as a gene, plasmid, microorganism, animal, plant, etc.
5.2. Patentable Items of Biotechnology 5.2.1. Statutory Subject Matter
[ Institutional Infrastructure for IPR-Based Development in Asia ]
(1) Microorganisms The term “microorganism” includes bacteria, actinomycetes, fungi, viruses, protozoa and algae, etc. Because a microorganism is neither an animal nor a plant, it is not listed under Article 25.1(4). A microorganism existing in nature without the involvement of any artificially induced technical treatment is, however, a scientific discovery and cannot be patented. Microorganisms per se constitute a subject matter for patent protection only when isolated, screened or cultured from nature and where an industrial application must repeatedly be obtainable, otherwise, they cannot be patented due to the lack of practical applicability. (2) Gene or DNA Fragment Genes or DNA fragments are chemical substances which include those isolated from microorganisms, plants, animals or humans, as well as those obtained by other means. However a gene or DNA fragment existing in its natural state is merely a discovery, coming under scientific discoveries as provided for in Article 25.1(1)31 and is non-patentable. However, a gene or a DNA fragment per se and the process to obtain it are suitable for patent protection if they are isolated or extracted for the first time from nature, if the base sequence is unknown to prior art, it can be definitely characterized and can be exploited commercially. (3) Constitutive Part of an Animal or a Plant A somatic cell, tissue or an organ of an animal (except an embryo) do not conform to the definition in Article 25.1(4)32 of the Patent Law, so they don’t belong to the excluded subject matters. If a cell, tissue or organ of a plant does not possess the plant’s characteristics for reproducing and maintaining life, they cannot be regarded as plant varieties, therefore, they are not excluded subject matters under Article 25.1(4).
30
Guidelines for Examination of the Chinese Patent Law, Part II, Chapter 10, Section 9.1.
31
Article 25(1) of the Patent Law: no patent right shall be granted for (1) scientific discoveries.
32
Article 25(4) of the Patent Law: no patent right shall be granted for (4) animal and plant varieties.
(4) Processes used in Producing Biological Materials (including Animal and Plant Varieties) According to Article 25.2, a patent right may be granted for processes used in producing animal and plant varieties and other biological materials. The production processes here refer only to non-biological processes.
195
Whether or not a process is essentially biological depends on the degree of human technical involvement. If this is the controlling or decisive factor for achieving the result or effect of that process, it is not essentially biological. For example, the methods for raising high yield dairy cattle through irradiation or the methods for producing lean pork by improving rearing methods are patentable. (5) Invention of Biological Products and their Production Methods Biological products are immune preparations produced from microorganisms, metabolites of microorganisms, animal toxins, blood or human or animal tissue for prevention, diagnosis or treatment of certain infectious diseases or other related diseases, such as vaccines, entitoxic serum, toxoids, antibiotics, etc. Because Article 25 of the Patent Law deleted the provision for refusing patent rights on "pharmaceutical products and substances obtained by means of a chemical process", these products can also be covered by product patents.
(6) Biological Methods for Non-Therapeutic Purposes Article 25(3)33 of the Patent Law excludes surgery, therapy, and diagnoses practiced on humans or animals: specific examples include treatments such as acupuncture, radiotherapy, and immunization. Also excluded are methods of disease diagnosis such as endoscopies and ultrasounds. Furthermore, prophylactic treatment of disease, treatment of wounds, methods of contraception, artificial insemination and embryo transfer are also expressly excluded from patent protection. These exclusions, however, do not apply to methods not directly applied to the body. Thus, methods of treatment and diagnosis applied to tissue and other biological materials isolated and separated from the body are patentable. Methods of analysis, treatment, and data collection as applied to the body for purposes that are not disease-related are also allowed, as are products and compounds used for diagnosis and treatment of disease. Further examples of patentable subject matter include (1) non-therapeutic cosmetic hair treatment methods such as permanent waving or dyeing; (2) methods of sterilization that are not directly practiced on animals or humans; (3) methods of treatment and preservation of corpses; (4) methods of measuring physiological parameters solely for the purpose of perfecting a medical instrument.34
5.2.2. Excluded Subject Matter (1) Human Embryonic Stem Cells A patent right will not be granted either on a human embryonic stem cell or on a method for preparing it in accordance with the provisions of Article 5.35 33
Article 25(3) of the Patent Law: no patent right shall be granted for (3) methods for the diagnosis or for the treatment of disease.
34
Examination Guidelines of the Patent Law, Part II, Chapter 1, Section 3.3.
35
Article 5 of the Patent Law: no patent right shall be granted for any invention-creation that is contrary to state laws or social morality or that is detrimental to the public interest.
[ Institutional Infrastructure for IPR-Based Development in Asia ]
Due to the special nature of the biological products, examinations shall be carried out in accordance with the criteria for chemical substances and pharmaceuticals. As for new chemical substances obtained by microbiological processes, the product claims of the patent application shall clearly be defined by molecular or structural formulas, DNA sequences, physical and chemical parameters and/or preparation processes; moreover, in the specification, at least one use and preparation process of the products must be described.
196
(2) The Human Body at any Stage of Its Formation and Development The human body at any stage of its formation and development, including as a germ cell, an oosperm, an embryo or an entire human body shall not be granted a patent right in accordance with the provisions of Article 5 of the Patent Law.
(3) Animal and Plant Varieties The embryonic stem cell of an animal or an animal in the various stages of its formation and development, such as a germ cell, an oosperm, an embryo, etc, belong to the category of animal varieties and they cannot therefore be patented under Article 25.1(4). A single plant and its reproductive material (such as seeds, etc.), which maintains its life by synthesizing carbohydrates and proteins from inorganic substances, such as water, carbon dioxide and mineral salts through photosynthesis, belongs to the category of plant varieties and as such cannot be patented under Article 25.1(4). Transgenic animals or plants are those obtained by biological methods, such as DNA recombination technology. The animal or plant per se still belongs in the category of animal or plant variety, and under Article 25.1(4), no patent right can be granted.
5.3. Statistical Analysis of Biotechnology Patents
[ Institutional Infrastructure for IPR-Based Development in Asia ]
Biotechnology has developed rapidly in China in recent years. The numbers of patents filed and granted are increasing year-on-year. It is one of the most promising fields and regarded as the strategic focus of scientific and technological development in “long-term national science and technology programs for development”. Based on patent data retrieved from the SIPO website, this section analyzes patenting activities between 1985 and 2007.
5.3.1. Statistical Analysis of the International Patent Classification (IPC) In order to identify biotechnology from SIPO’s patent database,36 we have retrieved the patents according to their IPC codes, and to the definition given by the OECD in 2005,37 Biotechnology patents cover the following IPC classes : A01H1/00, A01H4/00, A61K38/00, A61K39/00, A61K48/00, C02F3/34, C07G(11/00, 13/00, 15/00), C07K(4/00, 14/00, 16/00, 17/00, 19/00), C12M, C12N, C12P, C12Q, C12S, G01N27/327, G01N33/(53*, 54*, 55*, 57*, 68, 74, 76, 78,88, 92) and this is shown in Table 5.1.38 We retrieved the biotechnology patents in the light of the definition presented above as at November 23, 2008.
36
See http://www.sipo.gov.cn/.
37
OECD, A framework for biotechnology statistics, 2005, p.31.
38
For further details of IPC classes, www.wipo.int/classifications/fulltext/new_ipc/index.htm.
197
[ Institutional Infrastructure for IPR-Based Development in Asia ]
Table 5.1. Provisional Definition of Biotechnology Patents
Source: OECD, A Framework for Biotechnology Statistics, 2005, p.31.
198
Table 5.2 shows the annual patent filings for inventions and utility models: at the end of 2007, SIPO had accepted 45,387 filings. Fig. 5.1 shows that most of these were inventions (42,987, representing 94.7 per cent of the total biotechnology patent filings). There were 2,400 utility model patents (about 5.3 per cent of the total), and no design patents.
[ Institutional Infrastructure for IPR-Based Development in Asia ]
Table 5.2. Annual Statistics of Biotechnology Patent Applications from 1985 to 2007
Source: http://www.sipo.gov.cn/sipo2008/zljs/.
199
Fig. 5.1. Biotechnology Patent Type Analysis from 1985 to 2007 Source: http://www.sipo.gov.cn/sipo2008/zljs/.
5.3.2. The Trend in Biotechnology Patents The annual trend in biotechnology patents is shown in Fig. 5.2, the number of invention patent applications in this field increasing between 1985 and 2007 except for 2001 and 2007.
From 1985 to 2006, invention patents increased from 116 to 5,425 with an annual average growth rate of 24.7 per cent: for biotechnology utility model applications, the number also increased from 3 to 403 in this period.
39
Article 34 of the Patent Law: ”Where, after receiving an application for a patent for invention, the Patent Administration Department under the State Council, upon preliminary examination, finds the application to be in conformity with the requirements of this Law, it shall publish the application promptly after the expiration of eighteen months from the date of filing.”
[ Institutional Infrastructure for IPR-Based Development in Asia ]
It should be noted that the figure for 2007 would be above 3,750; this is due to the time lag. According to the Patent Law, the application would be published 18 months from the filing date; therefore, some of the applications for 2007 have not yet been published.39
200
Fig. 5.2. Annual Trend for Biotechnology Patents Source: http://www.sipo.gov.cn/sipo2008/zljs/.
[ Institutional Infrastructure for IPR-Based Development in Asia ]
The figures for domestic patent applications and grants from 2002 to 2006 are analyzed in Fig. 5.3. During the last five years, the number of domestic biotechnology patent applications was higher than foreign applications and accounted for about 60-70 per cent of the total patent filings. Up to 2003, the number of domestic biotechnology patents grants was lower than foreign grants, although the rate of domestic patents granted increased from 2002 and accounted for 66 per cent of the total biotechnology patents granted in 2006.
Fig. 5.3. Domestic Patent Filings and Patents Granted from 2002 to 2006 Source: http://www.sipo.gov.cn/sipo2008/zljs/.
5.3.3. National Distribution of Foreign Applications Up to December 31, 2007, SIPO had accepted 17,685 foreign patent applications, representing 38.96 per cent of all patents filed in this field. Among these, invention patent applications accounted for 17,652 applications and utility model patent applications for 35. Fig. 5.4 shows the national distribution of invention patent filings from abroad; the US at the top with 6,373 patent filings, followed by Japan
(3,558), Germany (1,385), the UK (832), Switzerland (784), Denmark (620), the Netherlands (596), Korea (529), France (503) and Canada (347). Invention applications from the EU-27 accounted for 29.9 per cent of the total foreign applications.
201
Fig.5.4. National Distribution of Foreign Invention Patent Applications for Biotechnology Source: SIPO’s patent search platform http://www.sipo.gov.cn/sipo2008/zljs/.
5.3.4. Domestic Distribution of Applications by Region
Fig. 5 shows the regional distribution of invention patent filings. Shanghai was the leader in biotechnology patent filings followed by Beijing; filings by Shanghai and Beijing amounted to 7,450 and 4,411 and accounted for 29.41 per cent and 17.41 per cent of the total domestic filings respectively. The following regions were Jiangsu (1,850), Guangdong (1,655), Zhejiang (1,313), Shandong (1,203), Hubei (960), Tianjing (809), Liaoning (742) and Sichuan (513).
Fig. 5.5. Distribution of Domestic invention Patent Applications by Region Source: http://www.sipo.gov.cn/sipo2008/zljs/.
[ Institutional Infrastructure for IPR-Based Development in Asia ]
Up to December 31, 2007, there were 27,702 domestic biotechnology patent applications filed, including 25,335 invention patents and 2,367 utility model patents. Total domestic filings accounted for 61.04 per cent of all patents filed.
202
5.3.5. Distribution of Biotechnology Invention Patent Assignees Table 5.3 shows the top 10 domestic and foreign patent assignees at the end of July 2007. Universities topped the domestic applications, while the top ten foreign assignees were mostly business enterprises. There were five assignees among the 10 domestic patent assignees in Shanghai where biotechnology is developing rapidly, and the leader, Shanghai Biowindow Gene Dev Inc., filed a total of 3,332 applications. This is a high-tech enterprise committed to large-scale gene cloning, gene sequencing, bioinformatics, gene function research, drug development and gene chips. The leading foreign patent assignees were: the US (3), Japan (2) and the EU (5).
Table 5.3. Top 10 Domestic and Foreign Invention Patent Assignees
[ Institutional Infrastructure for IPR-Based Development in Asia ]
Source: http://www.sipo.gov.cn/sipo2008/zljs/.
5.3.6. IPC Distribution of Biotechnology Patent Filings Fig. 5.6 shows the major biotechnological fields; the top IPC ranking was C12N (microorganisms or of the total. Other important IPC areas included C12Q, “measuring or testing processes involving enzymes or micro-organisms; compositions or test papers therefore; processes for preparing such compositions; condition-responsive control in microbiological or enzymological processes”, and G01N 33/68, “investigating or analyzing materials by specific methods not covered by the preceding groups: involving proteins, peptides or amino acids”.
203
Fig. 5.6. Top 20 IPC Biotechnology Patent Filings Source: http://www.sipo.gov.cn/sipo2008/zljs/.
6. Protection of Pharmaceuticals through IPRs
Under the Patent Law of 1984, pharmaceuticals were excluded from patent protection. Considering that they are essential for the health of the general public, prices should be as low as possible so that all those who need them can afford them. From the philosophy underlying the patent system, humanitarianism etc., as in many other countries, this was also provided for in the Patent Law of 1984 where processes for diagnosis and treatment of human and animal diseases were not patentable. An MOU on IPRs was concluded on January 17, 1992 between the Chinese government and the US on IP protection: Article 2 provides administrative protection for pharmaceutical and agrochemical products. Provisions on protection can be summarized as follows. A pharmaceutical product granted a product patent in the US between January 1, 1986 and January 1, 1993, approved for marketing in the US by the Food and Drug Administration (FDA), and which has not been sold in China, is eligible to apply for administrative protection in China after signature of a contract for its manufacture or distribution with a Chinese enterprise as a legal entity. After examination and approval by the competent Chinese authorities, the product concerned would be granted an exclusive right of administrative protection for seven and a half years, starting from the issue of the certificate. The revised Patent Law entered into force on January 1, 1993, extending the effect of the process patent to cover products made directly from the process. The patentee had the right of importation and there was a strict limitation on granting a compulsory license, the term of protection being 20 years from the date of filing: the terms of protection for utility models and designs, 10 years from the date of filing. The burden of proof fell on the defendant if an infringement of process patent was filed against him. It is clear that these amendments have had a bearing on public health issues as they relate to the availability and affordability of pharmaceuticals.
[ Institutional Infrastructure for IPR-Based Development in Asia ]
6.1. Historical Development of Patent Protection for Pharmaceuticals
204
6.2. Patentable Subject Matter in Pharmaceuticals Products and usage are not protected in the case of pharmaceuticals, only the methods of preparation of drugs patented in China before January 1, 1993. After the first amendment of the Patent Law, pharmaceutical products, methods and usage could all be patented: Products which could be patented included traditional medical compounds, herbal preparations, extracts from herbal medicines or compounds, treated herbal materials, health foods containing herbal medicines, etc. Methods which could be patented also included preparation, methods for extracting certain substances from natural medical materials, methods of treating the material. If a known drug was found to cover any new indications that would be protected by the Patent Law. For example, the drug “sweet root” is known to have the effect of regulating different drugs in a compound; if it were found to have the effect of curing AIDS, the new indication could be protected by the Patent Law. Thus, a new use for a known medicament for the treatment of a disease can be patented.
6.3. Issues concerning Pharmaceuticals Patents In Article 25 of the Patent Law, no patent right shall be granted for: scientific discoveries; rules and methods for mental activities; methods for the diagnosis or treatment of disease; animal and plant varieties; substances obtained by means of nuclear transformation. In chapters 1, 5 and 10 of Part II of the Examination Guidelines, certain issues regarding pharmaceutical patentability are featured.
6.3.1. Diagnostic Methods
[ Institutional Infrastructure for IPR-Based Development in Asia ]
According to 4.3.1 of Chapter 1 of Part II of the Examination Guidelines, diagnostic methods refer to the process of identifying, studying and determining the cause or focus of disease on living human or animal bodies. Examples of inventions belonging/not-belonging to diagnostic methods are listed in the Guidelines: (1) Examples of Diagnostic Methods That which is practiced on a living human or animal its immediate purpose being to diagnose a disease or health condition. (2) Examples which do not belong to Diagnostic Methods • Pathological anatomy practiced on a human or animal cadaver. • Obtaining information from a living human or animal other than to diagnose a health condition or method of processing such information (e.g. physique and body parameters, physiological parameters or other parameters). • Treating or testing body tissues, body fluids or excrement removed from a human or animal in order to obtain information other than to diagnose a health condition. It should be noted that if a diagnosis based on the information obtained per se in accordance with the medical knowledge of the prior art and the disclosure of the application cannot be immediately reached, the information could be regarded as an intermediate result.
6.3.2. Methods of Treatment Inventions regarding methods of treatment are listed in the Guidelines:
(B) Examples which do not belong to treatment methods and shall not be excluded from patentability under Article 25.1(3): ① Producing and measuring artificial limbs or other prostheses. An example would be a method for making dental prostheses, including making a mould in the oral cavity of the patient’s gum and making a dental prosthesis outside the oral cavity. Although the ultimate aim is treatment, the purpose of the method in itself is to make suitable dental prostheses. ② Animal breeding, treating animals by non-surgical means to accelerate their growth, including applying electromagnetic stimulation to live lambs to stimulate growth, to improve the quality of their meat or to improve their fleece. ③ Methods of butchering. ④ Methods of treating human or animal cadavers, such as beautification, antisepsis, or making specimens. ⑤ Methods of a non-invasive, purely cosmetic nature, including deodorization, protection, decoration or beautification for non-treatment purposes on the skin, hair, nails or teeth. ⑥ Making a healthy human or animal comfortable or happy, supplying oxygen, negative ions in conditions such as for diving or for protection from toxic gas. ⑦ Killing bacteria, viruses, lice or fleas on a human or animal (on the skin or in the hair, excluding wounds and infected sites). (C) Surgical Methods Traumatic or invasive treatments such as incision, resection, stitching, and tattooing practiced on humans or animals with the aid of instruments cannot be granted patent rights: surgery to treat illness is also non-patentable. However, surgery practiced on a human or animal cadaver may be patentable. (D) Measuring the physiological parameters of a human or animal under extreme conditions risking its life Extreme conditions which humans or animals can endure differ, and in each case the condition shall be evaluated by an experienced professional. Such methods have no industrial application and no practical applicability.
205
[ Institutional Infrastructure for IPR-Based Development in Asia ]
(A) Examples that belong to or shall be regarded as methods of treatment for disease shall not be granted patent rights. ① Treatment by surgery, drug therapy, psychotherapeutics. ② Acupuncture, anesthesia, manipulation, massage, gua sha (skin scraping therapy), qigong, hypnosis, medicated bath, air bath, sun bath, forest bath or nursing care for the purpose of treatment. ③ Stimulating or irradiating a human or animal by radiation of electricity, magnetism, sound, light or heat, etc. for the purpose of treatment. ④ Coating, freezing, or diathermy etc. for the purpose of treatment. ⑤ Various immunization methods for disease prevention. ⑥ Methods auxiliary to surgical treatment and/or drug therapy, such as method of processing cells, tissues or organs that will be returned to the same subject, hemodialysis, monitoring the depth of anesthesia, method of ingesting or injecting medicines, or methods for applying medicines externally. ⑦ Fertilization, contraception, increasing sperm count, adosculation, embryonic transfer, etc. for the purpose of treatment. ⑧ Cosmetic surgery, stretching limbs, losing weight, increasing height for the purpose of treatment. ⑨ Treating human or animal wounds, such as disinfecting or bandaging. ⑩ Other methods such as artificial respiration and supply of oxygen for the purpose of treatment.
206
6.3.3. Natural Substances A substance, found in nature is merely an object of discovery in the sense of the scientific discoveries under Article 25.1(1), and no patent right shall be granted. However, if a substance is isolated or extracted from nature for the first time, the structure, morphology or other physical/chemical parameters of which are unknown in prior art, can be precisely characterized, and exploited industrially, the substance per se and the process for obtaining it are all patentable.
6.3.4. Medical Use of Substances As the medical use of a substance is for the diagnosis or treatment of disease, it falls under the conditions provided for in Article 25.1(3); therefore a patent right cannot be granted. However, if it is used for the manufacturing of a drug, it may be patentable.
6.3.5. Medical Prescriptions Medical prescriptions refer to those issued by a doctor to a patient. As these prescriptions and the dispensing of drugs accord with the opinion of a doctor they are not patentable.
6.4. Administration Protection for Pharmaceuticals
[ Institutional Infrastructure for IPR-Based Development in Asia ]
To regulate the R&D and approval of new drugs, to strengthen the supervision and management of new drugs, to maintain the order of fair market competition, and to ensure public safety and general health, the Chinese government has adopted a series of laws and regulations on IPRs, administration and management. These include the Provisions for Drug Registration (adopted in October 2002, amended in 2005 and 2007), Drug Administration Law of the People's Republic of China (adopted in September 1984, amended in 2001), Regulations for Implementation of the Drug Administration Law of the People's Republic of China (adopted in December 1992, amended in 2001), Regulations on the Protection of Varieties of Chinese Medicine” (adopted in October 1992), and Implementing Regulations of Law on Medicine Administration of PRC (adopted in August 2002). Based on the TRIPS Agreement, members, when requiring, as a condition of approving the marketing of a pharmaceutical or agricultural product utilizing new chemical entities, the submission of undisclosed test or other data, the origin of which involves considerable effort, shall protect such data against unfair commercial use. The State Food and Drug Administration extends the protection as the requirements of TRIPS. Undisclosed information on a drug which is obtained and submitted by the manufacturer or distributor within six years from the approval date of the drug is protected. Any application made by any other applicant by using the undisclosed data on the drug in question without the permission of the original applicant will be rejected, unless the data submitted are independently acquired by the applicant. This regulation is illustrated in Article 20 in the Drug Registration. In order to protect public health, the State Food and Drug Administration has set out an observation period of no longer than five years from the approval date for production of a drug. During this period, no other applications to produce, change dosage or import the drug will be approved: it will only approve another application if the original manufacturer has not produced the drug within two years from the approval date, for which an observation period is set. Articles 66 and 69 in “Drug Registration” have illustrated the issues of the new drug observation period in detail. Types of TCM produced and manufactured within China, including prepared traditional Chinese medicines, extracts and preparations from natural medicinal materials, as well as artificial TCM are
protected under the Regulations on the Protection of Varieties of Chinese Medicine. This is certain to improve the quality of types of traditional Chinese medicine, guarantee the legitimate rights and interests of traditional Chinese medicine producing enterprises, and promote the development of traditional Chinese medicine. However, types of protected TCM are listed in the national pharmaceutical standards. Protection consists of first- and second-class protection. The period for the former is 30 years, 20 years and 10 years respectively: the period of second-class protection is seven years. Within this period, prescriptions and pharmaceutical techniques of types of traditional Chinese medicine under first class protection shall be kept secret and shall not be published by producers having been granted a Certificate of Protection of Types of Traditional Chinese Medicine, the competent authorities for the production and trading of traditional Chinese medicine, the administrative departments of public health, and other units or individuals concerned. Departments, enterprises and units responsible for confidentiality shall set up security systems as required by the State. Articles 1,2,5,6,7,12,13,15,16,17 and 18 in the Regulations on the Protection of Varieties of Chinese Medicine illustrate the above in detail.
207
6.5. Analysis of Pharmaceutical Patents 6.5.1. Value of China’s Pharmaceutical Industry
Fig. 6.1. Growth in Total Output Value of China’s Pharmaceutical Industry Source: collected by author.
6.5.2. Statistic Analysis on Patent Applications for Pharmaceuticals Fig. 6.2 shows that the number of published pharmaceutical patent applications increased slowly from 1985 to 1992, while the growth rate increased more sharply during 1993 to 1995 as the first revision of the Patent Law entered into force on January 1, 1993. Under this amendment, product patents could be granted for pharmaceutical compounds used as active ingredients and for chemicals extracted from animals, plants or minerals, provided they had a value in pharmaceutical use and there was no prior art. This revised law promoted the pharmaceutical patent activity in China. Due to lag effects, the first peak was reached in 1995.The number of patent applications slightly decreased in 1996, before arriving at the second peak in 1997. Growth remained steady until 2003 with the highest peak being reached in 2006.
[ Institutional Infrastructure for IPR-Based Development in Asia ]
As shown in Fig. 6.1, the total output value rose from 137.1 billion Yuan in 1998 to 667.9 billion Yuan in 2007. From 1998 to 2007, the export trade volume of the pharmaceutical industry increased from 3.4 billion US dollars to 24.6 billion US dollars, and the import trade volume from 1.5 billion US dollars to 14 billion US dollars.
208
Fig. 6.2. Numbers of Published Patent Filings for Pharmaceuticals Source: SIPO website.
[ Institutional Infrastructure for IPR-Based Development in Asia ]
In order to find the major segments of the industry and the key leaders in those segments, IPC analyses were done. The top 30 patent classes (down to sub-class) are listed in Fig. 3, which shows that A61k35/78 was the most competitive patent area, followed by AK36/185. The top 30 sub-segments accounted for 64,642 applications, about half of the total.
Fig. 6.3. IPC Analysis of Pharmaceutical Patents Source: SIPO website.
7. Observations and Recommendations
209
Based on the overall observations of this report, we found that China has established a comprehensive institutional infrastructure for IPRs. However, there is still work to be done, and we make the following recommendations.
7.1. Need for Specific Guidelines for Biological and Pharmaceutical Inventions As shown in the second part of this report, patent quality relies on the effectiveness of patent examination, and China has established a relative comprehensive system. There is an overall examination guideline for each technology field and there are also specific provisions for certain technologies such as computer software-related inventions, biological inventions and pharmaceutical inventions. However, the provisions on biological and pharmaceutical inventions are ambiguous.
Therefore we suggest that there should be specific examination guidelines for biological and pharmaceutical invention applications: there should at least be a separate chapter in the overall guidelines for these two areas.
7.2. Need for Specific Regulations for TK and Genetic Resources According to Article 6 of the Copyright Law, regulations for the protection of copyright in expressions of folklore shall be established separately by the State Council. However, there is no specific regulation for copyright protection of TK and this should be established to protect the rights of TK holders. China has made great efforts on the IP protection of genetic resources, (it has been a contracting party of the Convention on Biological Diversity (CBD) since December 29, 1993), and the Third Amendment of Chinese Patent Law, which will enter into force on October 1, 2009 requires the disclosure of the origin of genetic resources upon which an invention relies.
7.3. Strategic Use of Patent Information and Non-Patent Literature in key Policy Areas Patent documents contain descriptions of scientific and technical concepts as well as practical details of processes and apparatus. They play an important role in the economic and technical development of a country. For technology assessment, patent documents generally convey the most recent information which is not divulged in any other literature. An investigation made by the U.S. Patent and Trademark Office shows that as much as 70% of the technology disclosed in U.S. patent documents from 1967 to 1972 had not been disclosed in non-patent literature.
[ Institutional Infrastructure for IPR-Based Development in Asia ]
According to the fifth part of this report, the number of biotechnology patent filings and domestic patent grants exceed the number of foreign patent filings and grants. Biotechnology has been listed as the strategic focus of China's scientific and technological development over the next 15 years. R&D in this area increased overall with an accumulation of independent IPRs and increased public awareness. At the same time, in the sixth part of this report, the following conclusion could be drawn: At present, pharmaceutical patents of process, product and usage, except for processes for diagnosis and treatment of human and animal diseases, are patentable. Patent subjects are wide in Chinese pharmaceutical industry. Our data show a high level of patent activity in Chinese medicine, but the number of chemical patents is low, especially for Chinese assignees. It will therefore be a major task for China to continue to promote new chemical developments: the pharmaceutical industry is also characterized by a dual protection of patent and administration which regulates the R&D and approval of new drugs, strengthens the supervision and management of new drugs, maintains the order of fair competition and ensures public safety.
210
However, according to our investigation, the use of patent information in some key policy areas is still very limited. For example, in the computer software technology field, incomplete databases (prior art) limit the use of patent information and lead to relative low quality patents thereby impeding innovation in this field which is primarily characterized by sequential and accumulative development. On the other hand, skills on the use of patent information in this field need to be enhanced. Programmers should be better aware of the state-of-the-art, including the latest developments and existing IPRs in the country (such as validity, ownership, etc.) which is particularly important to avoid infringement actions. Patent information would also allow them to assess particular technical approaches (whether they have been tried before and might be worth pursuing or whether they would lead to wasteful duplication of research effort), solve specific technical problems, improve existing products or processes and/or develop new ones. For genetic resources and TCM, it is also necessary to establish non-patent literature databases since, at the moment, the patentability of subject matters in these two fields is still ambiguous.
7.4. Strengthening of International Cooperative Research and Practice Since one of the principal mandates of WIPO is to offer technical assistance to developing countries, this should include facilitating the access to, and use of, technological information contained in patent documents, and enhancing the quality of patent examination to accelerate economic, social and cultural development in developing countries. We suggest that cooperation could be further strengthened under the WIPO’s guidance and coordination in:
[ Institutional Infrastructure for IPR-Based Development in Asia ]
(1) (2) (3) (4)
Sharing and transfer of regional and international data; Development and upkeep of a “prior arts” database; Procedure control management in patent examination; Joint training and education for examiners.
In this research we found that more patent information and better tools to analyze data should be available for enterprises and other research units (especially in developing countries) to aid in the development of innovation and marketing strategies. Therefore, we suggest that WIPO organize an international cooperative research project on patent data analysis techniques for guiding innovation in enterprises. This would assist developing countries and countries in transition in establishing their national industrial property information systems to meet the growing information needs of national industries, business sector and R&D community in these countries.
Institutional Infrastructure for IPR-Based Development in Asia
1. Introduction 2. Patent Applications and Examinations 2.1. Patent Applications, Requests for Examination, Patent Registrations 2.2. Decisions to Refuse and Appeals against Decisions to Refuse 2.3. Patents Granted and Appeals for Invalidation of Patents Granted 3. Business Method Patent 4. IP Lawsuits 5. General 5.1. Numbers of Patent Applications in all Areas of Technology 5.2. Numbers of Claims in Each Application 5.3. The Rate Increase in Foreign Applications 5.4. Utility Models 5.5. Researchers and Research Expenses 5.6. Relationship between R&D, Patent Applications and Patent Examination Requests 5.7. Fees for Patent Procedures 6. Outline of Examination Guidelines 6.1. Patent Law Section 29(2) 6.2. Examination Guidelines in Specific Technological Fields 6.3. MSE Relationship with the JPO 7. Retrieval System (Information System) 7.1. The Use of Printed Matter in Patent Searches and Examinations to Enhance Patent Quality 7.2. The Availability of National Patent Data, including Technical Disclosure and Access to Updated Legal Status, Especially Online Availability 7.3. Patent Landscaping, including the Use of Patent Information for Policymakers and Strategic Purposes. 7.4. Information Sources Used by the Office for Search and Examination 7.5. Retrieval System for Applicants (Digitization of National Patent Documents) 7.6. National Patent Data used to Track and Monitor Trends and Developments 7.7. Possibilities for using National Patent Information to Supplement Existing PPP Undertaken by International Organizations 8. Conclusions
1. Introduction Under Japanese patent law, the substantive examination principle has been adopted, which aims at granting a stable and reliable patent right.40 This rapid examination system is necessary for granting a stable patent right and for encouraging coherent applications, and it depends on a country’s examination and information systems for searching prior art. For example, a good system for searching prior art can
* The views expressed in this report are those of the authors and do not necessarily reflect those of the WIPO Secretariat or any of its Member States. 40
Intellectual Property Law (Patent Law), Nobuhiro Nakayama, Koubundo (Japanese).
211
[ Institutional Infrastructure for IPR-Based Development in Asia ]
Japan Sadao Nagaoka and Kazufumi Yaji*
212
enable patent examiners to focus their efforts on appropriate documents. Information provided to the public through the website of a patent office can inform applicants of changes in procedures and help them to file better–prepared applications. In other words, there is a strong connection between the practice and information system of a patent office which has not previously been examined and which this paper sets out to do, looking at the connection between patent office practice and the policy goals of the system, particularly in relation to search and examination and the use of patent information.
2. Patent Applications and Examinations In order to understand the situation from the filing of an application for a patent to its examination, we have gathered the following data: numbers of patent applications, numbers of patent examiners, numbers of patent attorneys, average numbers of claims, numbers and rates of decisions to grant a patent, numbers and rates of refusal decisions, numbers and rates of appeals against an examiner’s refusal decision to refuse, and numbers and rates of appeals for invalidation.
2.1. Patent Applications, Requests for Examination, Patent Registrations
[ Institutional Infrastructure for IPR-Based Development in Asia ]
In this section, data for patent applications, requests for examination, registration and examiners are given. Fig. 1 shows that the number of patent applications filed increased up to 2001 and then remained stable. The leveling off could have been the result of applicants choosing to file more intensively with foreign patent offices, due to the increase in the relative importance of the foreign market, as well as their choosing to bundle more inventions into a patent using the multiple claim system, given that industrial R&D has continued to increase (see Fig. 30.1). Additionally, Japanese companies might have chosen not to disclose certain technology through defensive patent applications as they wished to avoid technology drain through the publication of unexamined patent applications.41
Fig. 1. Patent Applications Source: JPO Annual Report 2007.
41
JPO Annual Report 2007, p.2.
In Fig. 2, the number of requests for examination increased up to 2000 and changed little between 2001 and 2003. After 2004, the number of requests increased significantly as the maximum period available for this was reduced from seven years to three years in 2001: the end of a seven-year period and the start of a three-year period for requesting an examination overlapped in 2004. It has also increased the probability of an examination request by around 10 percentage points.42 Fig. 2 displays the resulting increase in examination requests filed during that year.
213
Fig. 2. Requests for Examination Source: JPO Annual Report 2007.
[ Institutional Infrastructure for IPR-Based Development in Asia ]
Fig. 3 shows that the number of patent registrations increased until 1999 and decreased between 1999 and 2000, remaining constant after 2001. This reflected the change in the numbers of examination requests. In 2006, registrations increased rapidly due to the increase in requests for examination in 2004. (NB patent registration differs from granted patent.)
Fig. 3. Patent Registrations Source: drawn up by the authors from the JPO Annual Report 2007
Fig. 4 shows the change in the number of patent examiners after 1997. Although the years given are different in Figs 1, 2 and 3, we can see that the number of examiners remained constant from 1997 to 2003, increasing rapidly after 2003 due to the JPO’s efforts to deal with the anticipated increase in requests. 42
See Yamauchi, Isamu and Sadao Nagaoka, 2008, Complementary Reforms of the Patent Examination Request System in Japan, IIR Working Paper WP#08-07, Hitotsubashi University.
214
Fig. 4. Patent Examiners Source: JPO Annual Report 2007.
[ Institutional Infrastructure for IPR-Based Development in Asia ]
Fig. 5 shows that the number of patent attorneys increased annually, reflecting both the increasing demand for their services and policy changes which emphasized stronger patent protection. This meant that an increasing number of applications could be processed and an environment could be established where many applications could be more effectively filed, through the knowledge and expertise of the patent attorney in obtaining patent rights, expert knowledge of examination guidelines and access to advanced information systems.
Fig. 5. Patent Attorneys Source: JPO Annual Report 2007.
Figs 1 to 5 show a similar tendency, which seems to indicate stability in the quality of applications, an adequate number of patent attorneys and the expansion of the patent examination capability of the JPO.
2.2. Decisions to Refuse and Appeals against Decisions to Refuse Fig. 6 shows that the rate of refusal decisions remained constant between 2002 and 2005 (around 50 per cent) and between 1998 and 1999 (around 40 per cent). From 2000 to 2002, this increased because standards in the examination for an inventive step were becoming stricter. The results indicate that when patent examination guidelines are well known and used consistently by examiners, a stable rate of decisions to refuse follows. The almost non-existent rate of change (2002 to 2005; 1998 to 1999) resulted from the consistency of examiners’ decisions.
215
Fig 6. Decisions to Refuse Source: JPO Annual Report 2007
Fig. 7 shows that the rate of appeal against an examiner’s decision to refuse was stable from 1998 to 2006 and the rate of amendment in the appeal against such a decision was about 83 per cent in 2006. (rate = numbers of amendments in the appeal against examiners’ decisions (2006)/numbers of appeals against examiners’ decisions ( 2006)) The rate of amendments reveals that applicants attempted to avoid refusals by amending their patent applications. This meant they understood the examination process, the guidelines and the documents of rejection. If these guidelines had not been clear and had a good information system not existed, the annual rate of refusals would have changed significantly. Annual numbers of applications filed might also have changed if applicants had been unable to understand the likelihood of a patent being granted. Figs 6 and 7 show the possibility that the examination guidelines (including standards for an inventive step) and the information system affected examiners’ decisions and rates of acceptance of their decisions. Although the numbers of refusals increased after 1998, the rate of appeals did not change significantly. The rate of successful appeals against a decision to refuse was very low as seen in Fig. 7.2 which shows the effectiveness of good prior art searches by patent examiners through the information systems of the JPO.
[ Institutional Infrastructure for IPR-Based Development in Asia ]
Rate of decisions to refuse = (numbers of decisions to refuse + numbers of withdrawals and abandonments)/(numbers of decisions to grant + numbers of decisions to refuse + numbers of withdrawals and abandonments after first examination) (i.e.: numbers of decisions to refuse (2006)/numbers of decisions to refuse (2006) + numbers of patents granted (2006)) × 100%
216
Fig. 7.1. Appeals against Examiners’ Decisions to Refuse Source: JPO Annual Report 2007.
[ Institutional Infrastructure for IPR-Based Development in Asia ]
Rates of appeal against an examiner’s decision to refuse (%) = Numbers of appeals against such a decision to refuse/numbers of decisions to refuse
Fig.7.2. Successful Appeals against Examiners’ Decisions to Refuse
2.3. Patents Granted and Appeals for Invalidation of Patents Granted Fig. 8 and 9 show that while numbers of patents granted increased substantially from 1993 to 2006 and from 2000 to 2002, rates of patents granted decreased. This might have been caused by amendments to the examination guidelines, especially inventive step which were revised in 2000, making the examination of the inventive step stricter. However, the grant rate has not changed significantly since 2003.
217
Fig 8. Rates of Patents Granted Source: JPO Annual Report 2007.
Source: JPO Annual Report 2007.
Rates of patents granted (%) = numbers of patents granted/(numbers of decisions to refuse +numbers of patents granted + numbers of withdrawals and abandonments after first examination) × 100% (Example: numbers of decisions to refuse (2006)/numbers of decisions to refuse (2006) + numbers of patents granted (2006)+numbers of withdrawals and abandonments (2006)×100%
Fig. 10. Appeals for Invalidation of Patents Granted Source: JPO Annual Report 2007.
[ Institutional Infrastructure for IPR-Based Development in Asia ]
Fig 9. Patents Granted
218
Fig. 11. Rates of Invalidation JPO Annual Report 2007.
Rates of appeal for invalidation of patents granted = numbers of appeals for invalidation/numbers of patents granted (e.g. numbers of invalidations (2006)/numbers of appeals for invalidation (2006) Fig. 10 shows that the number of invalidations of patents granted has fluctuated. However, Fig. 11 shows the rate of change to be very low, so when taken together, they show that the numbers of appeals for invalidation are low. In the next chapter, it will be seen that the establishment of examination guidelines helps effective patent applications, based on experience in the business method patent technology area.
[ Institutional Infrastructure for IPR-Based Development in Asia ]
3. Business Method Patent This chapter shows that examination guidelines affect the number of applications and the stability of patent rights. Fig. 12 shows that the number of business method patent applications increased rapidly between 1997 and 2000, but decreased between 2000 and 2003. This was partly caused by the establishment of examination guidelines for business method patent applications in 2000: as applicants came to understand the standards, fewer business method patents were filed. Since 1997, data has been collected in the CSDB for patent examiners. Since 2003, the public has been given access to this database through the IPDL, which could have had an effect on numbers of business method patent applications; i.e. numbers of applications could decrease as applicants became aware of any prior art
219
Fig.12. Business Method Patent Applications Source: JPO website43
[ Institutional Infrastructure for IPR-Based Development in Asia ]
Fig. 13 shows that from 1996 to 2003, the rate of decisions to refuse fluctuated, indicating that effective examinations were carried out following the establishment of the CSDB. Additionally, the rate of refusals changed little after 2003 which means that the examination guidelines for business method patents and a good information system resulted in more effective examinations. Moreover, rates of appeal against examiners’ decisions to refuse have not changed since 2003. In other words, examination guidelines lead to a more efficient patent application system resulting in the filing of applications more likely to financially benefit applicants.
Fig.13. Business Method Patent Applications Source: JPO website.
43
http://www.jpo.go.jp/tetuzuki/t_tokkyo/bijinesu/interbiji0406.htm.
220
Fig.14 shows that domestic applicants accounted for a large share of all business method patent applications. In comparison, the percentage of applications by foreign residents was small. In Fig. 15 we see that the change in the numbers of employees in the IT industry corresponded to the change in the numbers of business method patent applications. However, Fig. 16 shows that IT GDP increased year-onyear and began rising more sharply from 2000.
Fig.14. Numbers of Patent Applications
[ Institutional Infrastructure for IPR-Based Development in Asia ]
Source: JPO website.
Fig.15. IT Employment
Fig.16. IT GDP (Yen) Source: Annual on the Promotion of Science and Technology, 2006.
4. IP Lawsuits
221
A stable IPR (i.e. one that results from a high-quality patent examination and that cannot be easily invalidated in a court of law) affects the number of lawsuits filed against a patent. Figs 17 and 18 show that the number of IP lawsuits did not change significantly, which means that stable IPRs were granted. If the numbers of IP lawsuits changed year-on-year, it would mean that the public had not recognized the concept of stable IPRs.
Fig. 17. IP Lawsuits (District Court): left axis for the number of cases
[ Institutional Infrastructure for IPR-Based Development in Asia ]
Source: http://www.ip.courts.go.jp/eng/index.html.
Fig. 18. IP Lawsuits (High Court): left axis for the number of cases Source: http://www.ip.courts.go.jp/eng/index.html.
222
Fig. 19. Average Amount of Damages from Lawsuits related to Patents (10000Yen) Source: JPO Annual Report 2007.
5. General This chapter concerns research conducted on the data relating to patent applications: numbers of applications in all areas of technology, numbers of claims in each application, rate increases of foreign applications, utility models, numbers of researchers, research expenses and fees relating to patent procedures. The data indicate the necessity for an information system for conducting searches in all areas of technology
5.1. Numbers of Patent Applications in all Areas of Technology
[ Institutional Infrastructure for IPR-Based Development in Asia ]
Figs 20 to 24 show the numbers of patent applications in all technology areas, divided into agriculture, fisheries, food, tobacco; basic electric circuits, electric communication based on the areas of technology listed in the 2007 Annual Report of the JPO.44 Fig. 20 shows that the applications in the medical machinery and medical IPC classes have increased over the past 10 years in comparison with those in other areas of human necessities which means that Japanese medical machine technology has improved. Figs 20 to 24 show that the highest numbers of applications were filed in the areas of measuring optics, horology and controlling computing, basic electrics and basic electric circuitry and electric communication technology. As shown in Fig. 24, figures for measuring optics and horology and controlling computing have increased for the past 10 years. We also see that applications under IPC sections G and H are where most patent applications have been filed. As shown in Figs 20 to 24, applications have been filed in all areas, proving the necessity for an information system for prior art searches.
44
http://www.jpo.go.jp/cgi/link.cgi?url=/shiryou/toushin/nenji/nenpou2007_index.htm.
223
Fig.20. Section A – Human Necessities
Fig. 21. Section B - Performing Operations, Transportation Source: taken by the authors from the JPO Annual Report.
Fig. 22. Section C - Chemistry and Metallurgy Source: taken by the authors from the JPO Annual Report.
[ Institutional Infrastructure for IPR-Based Development in Asia ]
Source: taken by the authors from the JPO Annual Report
224
Fig. 23. Sections C, D, F - Chemistry, Metallurgy, Textiles, Paper, Fixed Construction
[ Institutional Infrastructure for IPR-Based Development in Asia ]
Source: taken by the authors from the JPO Annual Report.
Fig. 24. Sections G and H – Physics, Electricity Source: taken by the authors from the JPO Annual Report.
225
Fig. 25. Growth Rates in All Areas of Technology Growth rates = (The Number of Patent Applications in 2005 – The Number of Applications in 1995 / The Number of Applications in 1995 x 100%
[ Institutional Infrastructure for IPR-Based Development in Asia ]
Table 1. High Growth Rate Areas
Fig. 26. Percentage Ratio in All Technology Areas in 2005
226
5.2. Numbers of Claims in Each Application The average number of claims in an application has increased since 2000. This means that in Japan, technology is improving and becoming more complex every year, especially in the biotechnology and nanotechnology fields, and this phenomenon indicates that applicants are trying to acquire patent rights in a more comprehensive manner.
Fig. 26. The Average Claim Source: taken by the authors from the JPO Annual Report
5.3. The Rate Increase in Foreign Applications
[ Institutional Infrastructure for IPR-Based Development in Asia ]
Fig. 27 shows that the rate of foreign applications has increased since 1995. This means that more foreign companies value patent rights in the Japanese economy, demonstrating the necessity for an information system for applicants from abroad.
Fig. 27. Ratio of Foreign to Domestic Applications Source: taken by the authors from the JPO Annual Report.
5.4. Utility Models
227
In Japan, a utility model system is available and is quite different from the patent system. A utility model right is granted without examination and the period runs for 10 years from the date of filing. Fig. 28 shows that the number of such applications increased significantly in 2005, although it was much lower than that for patents. The reason was that the period of a utility model right increased from six to 10 years in 2004. An applicant for a utility model can also apply to register it, although a rights holder can only exert his right if the utility model has been registered and a report by the JPO on its validity is provided.
Fig. 28. Utility Models Source: taken by the authors from the JPO Annual Report.
Figs 29 and 30 show that numbers of researchers and research expenses increased up to 1999 and leveled off between 2000 and 2005. The changes shown in Figs 29 and 30 are similar and correspond to changes in the numbers of patent applications shown in Fig. 1. While numbers of researchers and research expenses are very likely to affect the numbers of patent applications, the latter also depend on the likelihood of a grant.
Fig. 29. Number of Researchers Source: taken from the data of the Annual on the Promotion of Science and Technology, 2006.
[ Institutional Infrastructure for IPR-Based Development in Asia ]
5.5. Researchers and Research Expenses
228
Fig. 30. Research Expenses (millions) Source: taken from the data of the Annual on the Promotion of Science and Technology, 2006.
[ Institutional Infrastructure for IPR-Based Development in Asia ]
5.6. Relationship between R&D, Patent Applications and Patent Examination Requests Unlike the US, Japan has not seen a significant increase in the number of patent applications relative to the level of expenditure on R&D. As shown in Fig 3145 the number of patent applications relative to industrial R&D declined from 1991 to 2006. Industrial R&D increased by a fraction less than 40 per cent (we used R&D data with a one-year time-lag, taking account of the delay between the R&D and patent applications), while the number of patent applications increased by only 10 per cent. However, there has been a significant increase in the requests for patent examinations relative to the level of real industrial R&D spending. In addition to the 50 per cent increase since 2004 due to legal changes, there was a gradual but significant increase in requests for examinations relative to industrial R&D expenditure and the number of patent applications: from 1991 to 2003 the increase was almost 70 per cent. In total, the number of examination requests increased by 160 per cent. In this sense there has been a patent explosion in Japan similar to that of the US. The increase in the numbers of examination requests relative to industrial R&D and the numbers of applications seems to reflect the following two important changes in the Japanese system. First, the longrunning increase in numbers of examination requests seems to have been caused by the increase in the value of patents, due partially to increasing numbers of claims per patent and stronger protection of rights. The average number of claims per application has gradually but significantly increased from around three in 1990 to around nine in recent years: the expansion of the scope of claims increases the value of the examination. Policy measures for stronger protection of patent rights include the switch from a pregrant to a post-grant opposition system in 1994; stronger private damage systems; stronger criminal sanctions; the stronger power of a patentee to collect evidence of patent infringement, all of which have been implemented by a series of changes to the law since 1998 as well as the affirmation of the doctrine of equivalents by the Supreme Court in 1998. In addition, the sharp increase in patent examinations since 2004 reflects the 1999 patent law amendment that forces a firm to decide whether it will seek an examination within three years after 45
The data for industrial R&D is based on Japanese science and technology white papers, and the number of patent applications and patent examination requests are based on the JPO annual reports.
application. It was the case that a firm could postpone such a decision for up to seven years after an application until September 2001. Forcing a firm to make an examination request decision within three years after application has resulted in both a temporary acceleration of patent examination requests due to the overlaps of the final years of examination requests of different cohorts of patent applications, as well as the permanent increase in the rate of patent examination requests by around 10 per cent, since a firm has now less time to screen patent applications.
229
Fig. 31. R&D, Patent Application, Examination request
5.7. Fees for Patent Procedures47 The fee list relating to patent procedures is shown in Table 2. Application fees are relatively low in Japan; 15,000 Yen or 150 US dollars (exchange rate: 1 US$=100 Yen). The examination fee, however, is relatively high, amounting to 200,000 Yen or around 2,000 US dollars in the case of a patent application containing
46
The JPO Annual Report 2008.
47
Although costs of patent attorneys and translators are very high, this section focuses on fees required by the government.
[ Institutional Infrastructure for IPR-Based Development in Asia ]
The combination of the increasing complexity of a patent in terms of the numbers of claims and increasing requests for examination have been putting strong pressure on the capacity of the JPO. This is reflected in the increase in the number of patents awaiting examination from 350,000 at the end of 1998 to 890,000 at the end of 200746. In order to prioritize the examinations, however, fast track examinations have been available since 1984 for those who will make immediate use of their patented inventions; those who wish to file foreign patent applications; universities and public research institutions and SMEs as well as individuals.
230
claims. Annual fees and renewal fees tend to increase fairly sharply with the elapse of time from the date of the grant and also with the number of claims, as shown in Fig. 32. Annual fees are therefore higher for a patent with a large number of claims, as Table 2. The JPO raised the examination request fee and decreased the annual fee significantly in April 2004. Before this, the examination request fee was half of the current level, which did not cover costs. An examination request fee substantially below cost has the effect of creating an incentive for applicants to use the patent office to evaluate quality rather than to make an internal assessment before applying or before requesting an examination. Furthermore, since all patent applicants need to pay the examination fee while only successful applicants need to pay annual fees, the above revision of the fee structure favors those with high-quality applications. According to a study by Yamauchi and Nagaoka (2008)48 which examined the effect of the revision of the fee structure, patenting costs of the group of firms with high quality patents49 have declined substantially (from 980,000 Yen to 940,000 Yen for the expected life time fee per patent application), while costs increased for the group of firms with low quality patents, having the effect of reducing examination requests by the latter.
[ Institutional Infrastructure for IPR-Based Development in Asia ]
Table 2. List of Fees
Calculation based on 1 USD = 100 Ұ.
48
Yamauchi, Isamu and Sadao Nagaoka, 2008, Complementary Reforms of the Patent Examination Request System in Japan, IIR Working Paper WP#08-07, Hitotsubashi University.
49
The paper defines the low-quality group as firms for which the grant rate is lower and the renewal periods shorter than average.
231
Fig. 32. Fees for Patenting (in US$ based on PPP Exchange Rates).
[ Institutional Infrastructure for IPR-Based Development in Asia ]
Note. The PPP (purchasing power parity) exchange rate is from the WDI.
[ Institutional Infrastructure for IPR-Based Development in Asia ]
232
Fig. 33. The Patent Application Procedure
6. Outline of Examination Guidelines
233
Examination guidelines affect the patent examination and patent right and therefore have a financial impact on an applicant. In this chapter, the examination guidelines, especially for an inventive step, are explained: inventive step50 is one of most important requirements for patentability51 and the most difficult point for patent examiners to examine.52 For example, there were 185 cases of litigation relating to inventive step out of a total of 318 cases in 2008.53 This also means that an information system for searching a wide range of technologies from many perspectives is needed to examine for an inventive step. Before explaining the examination guidelines for an inventive step, a summary of the relevant article in Japanese Patent Law (Section 29(2)), is explained in brief.
6.1. Patent Law Section 29(2) “Where an invention could easily have been made, prior to the filing of the patent application, by a person with ordinary skill in the art to which the invention pertains, on the basis of an invention or inventors referred to in any of the paragraphs of Subsection (1), a patent shall not be granted for such an invention notwithstanding Subsection (1)”. The purport of the provision of Patent Law Section 29(2) is not to grant a patent to such inventions that could easily be made by a person skilled in the art, since granting a patent to such inventions does not contribute to and even hampers the progress of technology.
points being probable cause or motivation and workshop modification of design.
Flowchart for an Inventive Step Examination I. II. III. IV.
Understanding the claimed invention. Retrieval of one or more cited inventions, one of which is selected as the main cited invention. The differences between the claimed inventions and the main cited invention are determined. If compositions relating to the difference are shown in other cited documents which explain the other cited invention, select “yes,” and consider V. If compositions relating to the difference are not shown in any other cited documents, select “No” and consider VI.
50
There are some countries that use “non-obviousness” instead of “inventive step”, for example the US. In Japanese examination guidelines the term “inventive step” is used.
51
In article 27 of the TRIPS Agreement, the following content is regulated: ” 1.Subject to the provisions of paragraph 2 and 3, patent shall be available for any inventions provided that they are new, involve an inventive step and are capable of industrial application.”
52
“Novelty and inventive steps account for the major part of the reasons given by examiners for rejecting patent applications. Adequate description is also important in an initial rejection, but it is less important as a reason for the final rejection.”, Sadao Nagaoka, How does Priority Rule Work? Evidence from the Patent Examination Records in Japan.
53
This data was researched by the authors using the Japanese court website. Selecting “administrative litigation” and inputting paragraph 2 of Article 29 and “1st January 2008 to 31st December 2008”, 185 hits were obtained. Inputting without the 2nd paragraph of Article 29, http://www.courts.go.jp/search/jhsp0010?action_id=first&hanreiSrchKbn=01.
54
2007 Report on Studying The Inventive Step, March, 2007, JPO, http://www.jpo.go.jp/shiryou/toushin/kenkyukai/pdf/sinposei_kentoukai/01.pdf.
[ Institutional Infrastructure for IPR-Based Development in Asia ]
The examination process for an inventive step is given in the following flowchart,54 its most important
[ Institutional Infrastructure for IPR-Based Development in Asia ]
234
V. If the claimed invention is a combination of the main cited invention and another invention or if one part of the main cited invention is replaced resulting in the claimed invention, select “yes” and consider VII. Identify the purpose of the invention to be one of the following: similarity between the main cited invention and other cited inventions, similarity to a problem to be solved between the main cited invention and other cited inventions, similarity of function, work or operation between the main cited invention and other cited inventions, and suggestion to combine and replace shown in the contents of cited inventions. However, the purpose of the invention may be changed if it is altered in any way. If that is the case, select “Yes” in V. and consider VII. VI. If the difference between the claimed invention and the main cited invention is a matter of workshop modification, etc. select “Yes,” with the result that the invention lacks an inventive step. A workshop modification is considered to fall under one of the following categories: selection of an optimal material; workshop modification of design in main cited invention to be similar to the claimed invention; optimizing or fitting the evaluated range of the main cited invention to be similar to the claimed invention, replacing one part of the main cited invention with the equivalent to be similar to the claimed invention, and “design modification for applying technology concretely in main cited invention to be similar to the claimed invention. However, if the advantageous effect is caused by the difference between the claimed invention and the main cited invention even though the difference is the matter of a workshop modification and if this difference could not be routinely discovered or foreseen by one skilled in the art, then select “No,” giving the result that the invention has an inventive step. VII.If the difference between the main cited invention and the claimed invention could not be routinely discovered or foreseen by one skilled in the art, select “Yes” with the result that the invention has an inventive step. If the difference could have been routinely discovered or foreseen by one skilled in the art, select “No” with the result that invention does not contain an inventive step.
[ Institutional Infrastructure for IPR-Based Development in Asia ]
235
Fig. 34. Flow Chart of the Inventive Step Examination Source: The Report of Study of the Inventive Step, March, 2007, JPO
236
6.2. Examination Guidelines in Specific Technological Fields In addition to the examination guidelines for the common technological fields, there are examination guidelines for the following: computer software-related inventions, biological inventions and pharmaceutical inventions. For biological inventions there are five kinds of examination guidelines: genetic engineering, microorganisms, plants, animals and deposit. However, the JPO has not created any special examination guidelines or databases for TK and genetic resources. If a patent examiner has to examine prior art documents concerning TK he/she has to examine printed matter and JPO websites: there is a library for employees in the JPO.
6.3. MSE Relationship with the JPO The JPO has agreements regarding MSE (Modified Substantive Examination) with both the Singapore Patent Office and the Croatia Patent Office. If a right has been granted in the JPO, only a modified examination is required for an application for the same invention in the country with which Japan has an MSE agreement.
7. Retrieval System (Information System) In chapters 1–6, we saw the necessity for examination guidelines and a good information system, based on the basic data on patent applications, etc. In this section, the JPO patent information system is considered.
[ Institutional Infrastructure for IPR-Based Development in Asia ]
There are retrieval systems in the JPO for patent examiners and applicants. That for patent examiners was specifically designed by the JPO for retrieving prior art and draft documents for patent examination and examiners can enhance the quality of their work by using the retrieval system. There is also the IPDL, which is accessible through the Internet to enable applicants to retrieve prior art documents and decide whether to file an application or request an examination. In this section, these retrieval systems are explained.
7.1. The Use of Printed Matter in Patent Searches and Examinations to Enhance Patent Quality Retrieval System for Patent Examiners in the JPO 7.1.1. Hardware There is a specific all-in-one terminal for examining patent applications in the JPO, which means that patent examiners can retrieve prior art documents and draft notifications of examination results using one terminal. Every examiner has his/her own all-in-one terminal for conducting fast and accurate examinations.
7.1.2. Database Internal Database Using the above system, examiners can retrieve prior art documents from JPO databases, which consist of a domestic, a foreign and a non-patent literature (NPL) database. Patent examiners can use cluster searches (explained below) in these databases. The domestic patent database contains patent and utility model documents published after 1922. The NPL database contains a computer software facility, a journal of technical disclosure and selected nonpatent literature. The computer software database contains some key technological terms and the titles of
hard copy prior art documents, usually technical journals, academic papers, technical magazines, etc. It also contains image and text data.
237
The foreign patent database contains documents from Canada, China, Germany, France, the UK, the US, WIPO, the EPO, etc. Patent examiners can retrieve documents from the WPI, ICIREPAT, and the DNA databases through the all-in-one terminal system. These data are collected in the JPO and referred to as an in-house-database: patent examiners use the search methods which correspond to each database. In addition to the above, there is an appeals database which contains gazettes and other documents concerning appeal and trial decisions that have been converted into electronic format and correspond to certain key words: this is the J-term database. Patent and appeal examiners can use full-text searches for appeal and trial decisions published after January 2000.
External Database Patent examiners can access more than 20 external databases through the JPO’s all-in-one terminal system. These consist of the following: JDream II, STN, DIALOG, IEEE Xplore, “lsevier Science Direct, PATOLIS, Science Direct, ACM/DL, Nikkei Biotech Online, INTERGLAD, Science Online, ProQuest, Web of Science, G-Search, NRI Cyber Patent Desk, Shoku Net, AIP On-line, I-Chu-Shi WEB, Medical and Pharmaceutical Prepared Document Full Text, Dialog Web, QWEB2, JJAP Online, Colour Index, Nature.com, Chemical Documents Library and CiNii.
As mentioned above, patent examiners can use internal and external databases to research prior art documents. Therefore, domestic patent applications in the life science fields are collected in a domestic patent database and foreign applications in a foreign patent database. The JPO also purchases data from WPI, ICIREPAT and DNA and stores it in its in-house-database. Patent examiners can search prior art documents in life science fields in the above databases.
7.1.3. Cluster Search In order to retrieve prior art documents to examine patent applications fast and accurately, the FI, F-term and CS-term systems were developed in the JPO. Additionally, patent examiners can use these systems in a cluster search. For this, they can also use the ECLA, USC, Free-word and Full-text search systems. The search keys for all of the systems can be used simultaneously in a cluster search because they have been cross-referenced. The FI and F-term systems are briefly explained below. FI is an abbreviation of File Index. The IPC has been subdivided to form the FI, since such segmentation enhances the efficacy of a search. An example of an FI classification is A01C1/
[email protected] F-term is an abbreviation of File Forming Term. The FI has not been segmented to a significant extent because the number of technological fields has increased recently. Therefore, the F-term was developed
55
JPO, 2008, The outline of IPC, FI and F-term and search by using IPC, FI and F-term, pp.25-29, http://www.jpo.go.jp/torikumi/ibento/text/pdf/h20_jitsumusya_txt/02ipc_01.pdf.
[ Institutional Infrastructure for IPR-Based Development in Asia ]
Database for Life Sciences, including Pharmaceuticals and Various Areas of Biotechnology
238
by subdividing multiple FI fields into smaller technology fields. All IPCs were segmented to about 2,600 themes and F-term lists were developed for about 1,800 themes.56
Fig.35. Retrieval System for Patent Examination
7.2. The Availability of National Patent Data, including Technical Disclosure and Access to Updated Legal Status, Especially Online Availability
[ Institutional Infrastructure for IPR-Based Development in Asia ]
National patent data can be searched through internal databases. Patent examiners can also conduct searches on external databases via the Internet. They can access the legal status of an application through the Internet and Intranet of each issuing division. The JPO also holds explanatory meetings for patent examiners when the patent law is revised.
7.3. Patent Landscaping, including the Use of Patent Information for Policymakers and Strategic Purposes. Upon revision of the patent law, the JPO issues a publication concerning the changes. It also publishes annually a manual and guide book for patent strategy and in 2009 it published the Manual of Patent Strategy for Small and Medium-Sized Enterprises (SMEs). These publications can be accessed and downloaded through the JPO website.57
7.4. Information Sources Used by the Office for Search and Examination In this section, the way to retrieve patents in special technological fields such as biological and biotechnology inventions, pharmaceuticals and TK and genetic resources, is explained.
7.4.1. Biology and Biotechnology The JPO has published a Guidebook for Patent Retrieval58 for some fields. A guidebook for patent retrieval in biology and biotechnology has also been published.59 This explains how to conduct prior art searches effectively in smaller technological fields. The following databases are usually used to search prior art in 56
JPO, 2008, “The outline of IPC, FI and F-term and search by using IPC, FI and F-term”, pp.32-43, http://www.jpo.go.jp/torikumi/ibento/text/pdf/h20_jitsumusya_txt/02ipc_01.pdf.
57
http://www.jpo.go.jp/cgi/link.cgi?url=/torikumi/chushou/chusyoyjirei.htm (Japanese).
58
http://www.jpo.go.jp/shiryou/s_sonota/pat_guidebook.htm (Japanese).
59
http://www.jpo.go.jp/shiryou/s_sonota/pdf/pat_guidebook/07.pdf (Japanese).
these fields: JPO DB (F-term, FI, Keyword, DNA DB), REGISTRY (STN), CA (STN), BIOSIS (STN,DIALOG), DWPI(STN,DIALOG,QUESTEL), MEDLINE(STN, Web site), JDream II (Keyword search), electronic journals, and websites on biotechnology.
239
Source: Guidebook of Patent Retrieval in Biotechnology.
The symbol indicates the effectiveness of these databases in prior art searches. The ranking of effectiveness is as follows: ◎>○>△>no symbol. “No symbol” does not mean that a prior art search is not possible. This chart means that only searches of general prior art can be conducted.
7.4.2. Pharmaceuticals
Source: Guidebook of Patent Retrieval in Pharmaceuticals
The symbol indicates the effectiveness of searching prior art. The ranking of effectiveness is: ◎>○>△>no symbol. “No symbol” does not mean that prior art search is not possible. This chart means that only searches of general prior art can be conducted.
7.4.3. Traditional Knowledge and Genetic Resources Traditional Knowledge Patent examiners usually use STN, Dialog, Medline, JDream II to search prior art. They also conduct searches in research centers for medicine and TCM (Traditional Chinese Medicine) via the websites of these institutions. There is no special database for TK in the JPO, only patent literature. Additionally, applicants have to search magazines and STN, Dialog Medline, and JDream II themselves. 60
http://www.jpo.go.jp/shiryou/s_sonota/pdf/pat_guidebook/15_iryouyou18.pdf (Japanese).
[ Institutional Infrastructure for IPR-Based Development in Asia ]
A Guidebook of Patent Retrieval in Pharmaceuticals has been published by the JPO,60 and the following databases are usually used to search prior art in this field: JPO DB (F-term, FI, Keyword), Cluster search (FI, F-term, ECLA), WPI/L, CAS, BIOSIS, Medline EMBASE, and JDream II.
240
Genetic Resources Patent examiners usually use DDBJ and websites related to genetic resources (i.e. laboratories abroad, etc.) to search prior art. There is no special database for searching genetic resources in the JPO as it only stores patent literature. Applicants have to search magazines and STN, Dialog Medline, JDream II themselves.
7.5. Retrieval System for Applicants (Digitization of National Patent Documents) What is the extent of digitization of national patent documents, including applications and granted patents? To what extent is this information available online to the general public? The JPO offers two main ways to retrieve prior art documents. One is for an applicant to use the same retrieval system as that used by the JPO patent examiner: anyone can access this. Cluster searches for prior art collected in the relevant databases are free of charge. The other method is to search prior documents of industrial property rights through the IPDL accessible via the Internet.
7.5.1. IPDL The Availability of National Patent Data (Especially Online)
[ Institutional Infrastructure for IPR-Based Development in Asia ]
Anyone can access the IPDL via the Internet.61 IPDL is an abbreviation of Industrial Property Digital Library and was established in March 1999. Anyone can conduct searches of the 61 million prior art documents concerning industrial property. They can use IPC, FI, F-term and CS-term for searching patent documents in the IPDL and they can view the content and the images of publications of unexamined applications and patent documents. If they use CS-term to retrieve documents, they can only view bibliographic information on each document, including title and keywords. The IPDL has the following functions: simplified search for beginners (patents and utility models); patent/utility model gazette database searches; searches for patent/utility model documents by reference number; front page searches for publication of patent applications; gazette text searches; patent classification searches; patent map guidance; Japanese patent abstracts (PAJ search) and online file inspections.62 In addition to the above, users can retrieve published appeals and trial decisions from 1940 onwards.
The Availability of Access to Updated Legal Status The JPO has created a website63 that discloses and provides an explanation of the up–to-date legal status of an application: it also holds meetings with applicants for this purpose. The JPO has also published a guidebook for retrieving prior art effectively in certain technological fields.64
7.6. National Patent Data used to Track and Monitor Trends and Developments 7.6.1. The Life Sciences including Pharmaceuticals and Various Areas of Biotechnology; The JPO publishes Research of the Technology Trend from the Viewpoint of Patent Applicants every year in specific areas of technology.65 Up to four themes in the life sciences, including pharmaceuticals and various area of biotechnology, are selected and reported each time. The aim of the publication is to show
61
IPDL, website, http://www.ipdl.inpit.go.jp/homepg.ipdl (Japanese) and http://www.ipdl.inpit.go.jp/homepg_e.ipdl (English).
62
All functions are explained in Information services available to the public on: http://www.wipo.int/cgiipoa/atr_public/atr_details_query.pl?country_id=JP&type_name=Patent&atrid=1364&atr_year=2006&atr_year_filter=2006&status =2&type_id=102&atr_type=PI&short_name=Japan&language_id=en.
63
http://www.jpo.go.jp/index.htm.
64
http://www.jpo.go.jp/shiryou/s_sonota/pat_guidebook.htm.
65
http://www.jpo.go.jp/shiryou/gidou-houkoku.htm (Japanese).
the trends in patent application filing and the underlying research in fields of current interest. This publication is therefore useful for companies in establishing their strategic direction.
241
7.7. Possibilities for using National Patent Information to Supplement Existing PPP Undertaken by International Organizations The best way is for WIPO to establish an international patent retrieval system accessible via the Internet. If such a system were established, all countries that have patent examination systems would be able to retrieve prior art documents and grant stable patent rights. Additionally, all countries should publish examination guidelines so that an applicant can determine whether to file an application. If such guidelines were published worldwide, applicants could file patent applications very easily.
8. Conclusions
While there has been no significant increase in patent applications in Japan in recent years, the numbers of examination requests has increased very significantly, due to the long-running changes in stronger patent protection and increasing patent scope in terms of numbers of claims; due also to patent law amendments shortening the time available for requesting an examination. Numbers of patent applications are highest in measuring optics, musical instruments, basic electrics, basic electric circuitry and electric communication technology. In these areas, numbers of applications have increased year-on-year. The JPO’s capability to meet such an increase as well as the structural change in the applications and examination requests in these fields has been bolstered by the development of the infrastructure for examination in terms of guidelines and database. Figs 1, 29 and 30 show the possibility that numbers of researchers and levels of research expenses affect numbers of patent applications. Figs 1-9, show that Japanese patent examination guidelines and a good information system assist the patent examiner’s decisions, resulting in stable patent rights and effective patent applications by self-selection, leading to enormous economic benefits. When numbers of researchers, level of research expenses, GDP, etc. increase, it follows that numbers of patent applications increase. Patent examination guidelines should therefore be published and an effective information retrieval system should be established. This would lead to an increase in successful patent applications and stable patent rights, providing great economic benefit. It is also possible that foreign patent applications will further increase. Therefore, the database retrieval system should be reinforced (broadened and be made more user-friendly).
[ Institutional Infrastructure for IPR-Based Development in Asia ]
The Japanese experience, including business method patents, suggests that the JPO’s examination guidelines and information system have helped the patent examiner to take decisions. They have also assisted applicants to obtain stable patent rights and to make effective applications since patent examination guidelines are published and the JPO has set up an extensive database for applicants to make prior art searches. This therefore reduces the cost of patent applications and enhances the economic benefits to applicants.
Institutional Infrastructure for IPR-Based Development in Asia
242
Korea Sun Hee Yun*
[ Institutional Infrastructure for IPR-Based Development in Asia ]
1. Introduction 2. Laws and Legal and Administrative Guidance Relating to IPRs in Korea 3. Conditions for Patent Application and Examination 3.1. Patent Applications, Examination Requests, Patent Registrations 3.2. Refusals and Appeals against a Decision 3.3. Grant of Patents and Appeal for Invalidation Trial 4. Intellectual Property Lawsuits 5. General 5.1. Numbers of Patent Applications in all Technological Areas 5.2. Increase in the Rate of Foreign Applications 5.3. Utility Models 5.4. Researchers and Research Expenses 5.5. Fees for Patent Procedures 5.6. Procedure for Granting Patents and Utility Models 6. Outline of Examination Guidelines 6.1. Definition of an Invention under the Patent Act 6.2. Method of Determining an Inventive Step 7. Retrieval System (Information System) 7.1. KIPOnet 7.2. KIPRIS 7.3. Biological and Biotechnology 7.4. Traditional Knowledge (TK) Database and Search Service 8. Conclusions and Recommendations
1. Introduction The Korean patent system which grants to the inventor the exclusive right of using an invention or a technical creation for a fixed period of time is based on Article 22 of the Constitution of the Republic of Korea, the purpose of which is to promote the advancement and development of technology and national industry through protecting technological creation (Article 1 of the Korean Patent Law). In order to accomplish this, applicants can easily secure the right through rapid examination, with the public freely able to use the information. We will demonstrate the direction being taken by the development of technology through researching the relation between national patent policy and patent office practice. In this context we will review the laws, regulations, institutions, patent application information and patent information systems and we will specifically examine life sciences and traditional knowledge (TK).
*
"This study was completed with the assistance of co-researcher Whoon Gun Kim. The views expressed in this report are those of the authors and do not necessarily reflect those of the WIPO Secretariat or any of its Member States.
2. Laws and Legal and Administrative Guidance Relating to IPRs in Korea
243
Korean laws relating to industrial property rights include: the Patent Act, the Utility Model Act, the Design Protection Act, the Trademark Act and the Invention Promotion Act. Regulatory guidance also includes: the Patent/Utility Design Examination Guidebook, the Method Examination Guidebook, the Priority Registration Utility Design Examination Guidebook, the Computer-Related Invention Examination Standards, the Chemical-Field Industry Examination Standards, the Commodity/ServiceRelated Code Explanation Book, the PCT International Investigation and International Preparatory Examination Guidelines, the Korean Classification/International Classification Comparison Chart, the Commodity and Service Industry Comparison List, the Related-Products/Service Industry Examination Standards (the 9th edition of the Nice Classification), the Trademark/Design Examination Standards, the Trademark Examination Manual, the Design Examination Manual, the Semiconductor Examination Manual and the Patent Client Service Guidebook. All these administrative guidelines have been published by the Korean Intellectual Property Office (KIPO): however, we have not so far been able to find any guidelines relating to life sciences and TK.
3. Conditions for Patent Application and Examination In this chapter, in order to understand the current situation regarding patent application and examination, we have gathered the following data: the number of patent applications, patent examiners and patent attorneys; the numbers and rates of decisions for granting patents or for refusals; appeals against the examiners’ decisions to refuse and appeals for invalidation.
3.1. Patent Applications, Examination Requests, Patent Registrations
Fig. 1 shows the numbers of patent applications which have been increasing steadily with the exception of 1997. It is probable that this decrease was related to the financial crisis in Korea at that time: applications have increased continuously since 2000. Korea ranks fourth in the numbers of patent applications worldwide, owing to its policy of enhancing an inventor’s competitiveness and discriminative goods.
Fig. 1. Numbers of Patent Applications
[ Institutional Infrastructure for IPR-Based Development in Asia ]
In this section we will provide data regarding patent applications, examination requests, patent registrations and patent examination.
244
Fig. 2 shows the numbers of examination requests submitted. The upward curve is very similar to that for patent applications: however, in 1997, the number of examination requests also decreased. By comparing Figs 1 and 2 we can easily see the rise in the numbers of examination requests.
Fig. 2. Numbers of Examination Requests
[ Institutional Infrastructure for IPR-Based Development in Asia ]
Fig. 3 shows the change in numbers of patent registrations, which is very similar to Figs 1 and 2. However, on closer inspection, we can see a time lag between application and registration.
Fig. 3. Numbers of Patent Registrations The Korean Intellectual Property Office (KIPO) greatly increased the number of examiners during 2002 to 2005, resulting in the reduction of time for processing patents from 17.6 months in 2005 to 9.8 months in 2006; the shortest in the world. As a result of this policy the number of patent examiners totaled 728 in 2005, but decreased to 636 in 2007 due to increases in the number of trial examiners with the aim of reducing the time for trial processing and expanding industrial property-related matters.
KIPO’s efforts reduced examination processing time to 9.8 months in 2006. The economic benefit accrued by reducing examination processing time during 2003 to 2006 was estimated at KRW 2,446.4 billion: KIPO achieved the shortest examination processing time for patents in both 2006 and 2007.
245
Fig. 4. Patent Examiners
[ Institutional Infrastructure for IPR-Based Development in Asia ]
Fig. 5 describes the increase in patent attorneys year-on-year.
Fig. 5. Patent Attorneys Figs 1 to 5 above show a similar pattern. This means that the numbers of patent applications, examinations requested, examiners and patent attorneys correlate significantly with each other.
246
3.2. Refusals and Appeals against a Decision Fig. 6 gives the numbers and rates of refusals. These numbers increased slightly during 2003 to 2006 then decreased in 2007. On the contrary, the rate of decisions in the same period decreased steadily. This tendency is related to the fact that the applicants submitted their arguments or complementary statements more often. In addition, it was greatly influenced by KIPO’s customer-oriented examination service and newlyintroduced system of examination in 2007.
Fig. 6. Refusals Rates of refusals = numbers of refusals/(numbers of refusals + numbers of patents granted)
[ Institutional Infrastructure for IPR-Based Development in Asia ]
Fig. 7 shows the numbers and rates of appeals against an examiner’s decision to refuse. The graph shows a slight increase from 2005 to 2007, with a similar pattern in the rate of refusals.
Fig. 7. Appeals against Examiners’ Decisions to Refuse Rates of appeals against examiners’ decisions to refuse = numbers of appeals against examiners’ decisions to refuse/numbers of refusals
3.3. Grant of Patents and Appeal for Invalidation Trial
247
Fig. 8 shows that the numbers of patents granted rose sharply between 2004 and 2006, due to an increase in the numbers of examiners during that period. Compared with 2006, figures for 2007 were slightly lower.
Fig. 8. Patents Granted
[ Institutional Infrastructure for IPR-Based Development in Asia ]
In Fig. 9 no wild fluctuations appear in the numbers of patents granted. This means that KIPO has attained a stable and highly credible standard in the examination of patent applications.
Fig. 9. Numbers of Patents Granted Percentage of patents granted (%) = (numbers of patents granted)/(numbers of refusals +numbers of patents granted)×100
248
Fig. 10 shows the change in numbers of appeals for invalidation trials from 2005 to 2006. While there was a slight increase from 2005 to 2006, the increase from 457 in 2006 to 616 in 2007 was steeper.
Fig. 10. Appeals for Invalidation Trials of Patents Granted
4. Intellectual Property Lawsuits
[ Institutional Infrastructure for IPR-Based Development in Asia ]
Fig. 11 shows the numbers of civil lawsuits in the district courts relating to IPRs from 2003 to 2007. It also shows that lawsuits based on registered intellectual property continuously increased during this period. Numbers include patents, utility models, designs and trademarks.
Fig. 11. Numbers of Civil Lawsuits relating to IPRs (District Courts)
5. General
249
In this chapter the data relating to patent applications such as numbers of applications in all areas, Increase in the rate of foreign applications, utility models, numbers of researchers, research expenses and fees relating to patent procedures are analyzed.
5.1. Numbers of Patent Applications in all Technological Areas Figs 12 to 16 show the numbers of patent applications in all technological areas. These areas are divided according to IPC classes.
Fig. 12. Section A
[ Institutional Infrastructure for IPR-Based Development in Asia ]
Fig. 12 includes agriculture, fisheries; food, tobacco; household utensils; medical machinery, medical; and amusement, rescue.
250
Fig. 13 is divided up into treatment, isolation, mixture; metal processing, production machinery; cutting, material processing; printing, stationery, ornaments; cars, shipping, airplanes; packaging, containers; nanotechnology.
Fig. 13. Section B
[ Institutional Infrastructure for IPR-Based Development in Asia ]
Fig.14 comprises inorganic chemistry, fertilizers; organic chemistry; high polymers; wash, applied composition, dyestuffs, petroleum chemistry and biotech, the beer, alcohol and sugar industry; genetic engineering.
Fig. 14. Section C
Fig. 15 includes metallurgy, metal treatment; textiles, textile treatment; paper; road building, railways; drilling machinery, engines, pumps; general engineering, elements; lighting, heating; and weaponry, blasting.
251
Fig. 15. Sections D-F
[ Institutional Infrastructure for IPR-Based Development in Asia ]
Fig. 16 shows patent applications in measuring, optics, horology, control, computing, education, musical instruments, information storage, nucleonics, basic electrics and basic electric circuitry, electric communication technology.
Fig. 16. Sections G and H Looking more closely at Figs 12 to 16, we can see that patent applications have generally increased in every area.
252
5.2. Increase in the Rate of Foreign Applications Fig. 17 shows that the ratio of foreign to domestic patent applications has changed very slightly irrespective of the numbers of applications.
Fig. 17. Ratio of Foreign to Domestic Patent Applications
[ Institutional Infrastructure for IPR-Based Development in Asia ]
5.3. Utility Models Korea still uses the utility model system under its Utility Model Act, which is somewhat different from the patent system. Firstly, only devices related to the shape or structure of an article or a combination of articles satisfying a lower standard of patent invention can be registered as utility models. Second, the rights period is 10 years from the date of filing of the application. Third, the period for an examination request is three years from the filing date. Fig. 18 shows the numbers of applications and registrations of utility models from 1995 to 2007 and the numbers of “registrability reports of utility models” from 2004 to 2007. Applications decreased sharply between 1996 and 1998, although registrations increased when the examination system revising the Utility Model Act from a substantive examination to a non-examination system changed in 1997. On the contrary, registrations have decreased due to a decrease in applications. When a utility model application is submitted to KIPO, it is checked to ensure that all requirements have been satisfied under Article 8(1) of the Enforcement Regulations of the Utility Model Act. As there is no substantive examination concerning novelty, standard of invention and industrial applicability under the non-examination system, examinations are made of the basic requirements to avoid and eliminate inconsistent elements in the application before registration. Thus, technical evaluation (a registrability report of the utility model) is different from a substantive patent examination. As the subject matter is already registered in the system before technical evaluation, this can be requested for each claim while
a request for a substantive examination should be made for all claims. Fig. 18 shows a marked contrast between numbers of registrability reports of utility models and utility model registrations.
253
Fig. 18. Utility Models
5.4. Researchers and Research Expenses
[ Institutional Infrastructure for IPR-Based Development in Asia ]
Figs 19 and 20 give numbers of researchers and levels of research expenses from 2004 to 2006: both showed a tendency to increase.
Fig. 19. Researchers
254
Fig. 20. Research Expenses (million Won)
5.5. Fees for Patent Procedures Table 1 List of Fees
[ Institutional Infrastructure for IPR-Based Development in Asia ]
Korean Won
US dollars (Calculation based on 1US$=1,000 KRW)
255
[ Institutional Infrastructure for IPR-Based Development in Asia ]
5.6. Procedure for Granting Patents and Utility Models
Fig. 21. Flowchart showing Procedure
256
6. Outline of Examination Guidelines A patent application will be taken up for examination only if a request is made either by the applicant or by any other interested party within five years (three years in case of an utility model application) from the filing date of the application. If no request is made within this period, the application is deemed to have been withdrawn. Once a request for examination has been filed, it cannot be withdrawn. A patent application is taken up for examination in the order of filing the request. For a patent to be registered under the Patent Act, it should meet the following requirements; (a) It should fall under the definition of invention. (b) It should demonstrate novelty, industrial applicability and inventive step. (c) It should not fall into any of the categories of non-registrable patents prescribed in Article 32 of the Patent Act.
6.1. Definition of an Invention under the Patent Act Inventive step describes the level of creativity of the invention and requires that it be a non-obvious progression of prior art. Inventive step is an academic concept that means the degree by which those skilled in the art cannot easily invent given the technical standard at the time of the patent application. A novel invention may lack an inventive step and granting monopoly protection to such an invention, which belongs in the realm of free technology, is against the purpose of patent law; whose aim is to promote technological progress. Many countries, including Korea, in Article 29.2 of the Act, impose this requirement, despite certain differences in language.
6.2. Method of Determining an Inventive Step
[ Institutional Infrastructure for IPR-Based Development in Asia ]
The process of determining an inventive step is: • first, the invention stated in the claim is examined by the same method as for novelty; • second, the invention of reference is examined by the same method as for novelty; • third, the invention stated in the claim and the invention of reference are compared and similarities and differences are noted; • fourth, whether or not the invention stated in the claim can obviously be derived by a technical standard in the relevant area at the time of the patent application is articulated; • fifth, if the above can be articulated, the invention is considered to lack an inventive step, but if this cannot be articulated, the contrary applies. Establishing logic, similarity and difference of the element must be clarified by comparing the reference invention to the invention stated in the claim. With respect to difference one must enquire whether or not the invention of reference implies the invention stated in the claim; the commonality of tasks, use and function of the invention can give a perspective on the motivation. Also, whether or not the invention stated in the claim is an improvement on the invention of reference. For example, even though the invention stated in the claim can easily be produced by those skilled in the art from the combination of multiple inventions of reference existing, if it shows an unusual or new aspect, then the inventive step may be acknowledged.
7. Retrieval System (Information System)
257
7.1. KIPOnet KIPOnet is an office automation system enabling complete electronic management of IPRs. It provides applicants with various electronic services such as online filing and patent information searches. All KIPO’s administrative procedures are computerized: when it receives an application via the Internet or in hard copy, everything is handled electronically including filing, prior art searches, examination, registration and publishing.
(a) System Overview As of 2007, the KIPOnet system comprises 39 subsystems while integrating redundant legacy systems; for example, the Electronic Application Preparation System (KEAPS), the General Receiving System, the Formality Check System, the Search System, the Trial Administration System, and the Gazette Publication System. For customer security, KIPO has adopted the Government Public Key Infrastructure (GPKI) for encryption and decoding of applications and the Secure Socket Layer (SSL) for networking. Internal KIPO users can access the KIPOnet system through the GPKI-based Single Sign-On: security has been further increased by the introduction of SSL as part of a comprehensive control system.
The KIPOnet system also shifted from Standard Generalized Markup Language (SGML) to the international document standard eXtensible Markup Language (XML) and it also adopted state-of-the-art technologies such as Workflow and an image management system. KIPO has acquired an ISO 20000 certification for IT service management and an ISO 27001 for information security management. Reliability increased greatly when in 2006 the disaster recovery system in the Seoul Branch, which received every type of application, examination, registration and trial, was disbanded.
(b) Operational Status of the System The receipt or rejection of an Internet-based application is immediately communicated to the applicant or transmitted to a KIPO examiner via its internal server in real time through the SSL channel. Applications passing a formality examination are loaded into an integrated database such as an XML-based electronic dossier, which enables examiners to judge their patentability. After examination, the application data is utilized for registration and publication. Internet gazettes have been made available in PDF-format on KIPO’s website (http://www.kipo.go.kr) since July 2001. All notifications emanating from KIPO are converted to PDF files and provided to the public in real time. For the convenience of customers, KIPO sends notices such as an expected examination date or decision by a variety of means including email or SMS.
[ Institutional Infrastructure for IPR-Based Development in Asia ]
In February 2005, KIPO integrated networks, which had been physically split, into an internal network for IPR administration and an external network for public access; providing access to internal and external sites simultaneously. The introduction of the Enterprise Security Management System and the Security Patrol Center enabled KIPOnet to operate around the clock, even in an emergency.
258
7.2. KIPRIS The Korea Intellectual Property Rights Information Service (KIPRIS) has gathered approximately 3.5 million cases of patents, utility models, designs and trademarks since 1948. It has also provided patent information from the Trilateral Offices (USPTO, JPO, EPO) since 1980: it is based on the KIPOnet database. In addition, KIPRIS provides bibliographic information including application number; applicant; title of invention; technical information including abstract; representative drawings; specification and administrative information including examination; trial proceedings; written verdict; registration, etc.
7.3. Biological and Biotechnology Patome@Korea is a database server for Korean patent sequences (DNA and proteins), which are provided by KIPO once a month, according to agreements between KIPO and the Korean Research Institute of Bioscience and Biotechnology (KRIBB) dated July 8, 2004. The database mainly consists of two parts. One is PatSeq, in which patent sequences and related data are provided: the other is GenePat, for gene-patent data that is created by the Korean Bioinformation Center (KOBIC). It provides annotated gene information. The Patome@Korea database and server is constructed and maintained by KOBIC and is updated once a month. Patome@Korea also provides the BLAST service, in which users can align their sequence against the Korean patent/application sequence database.
[ Institutional Infrastructure for IPR-Based Development in Asia ]
7.4. Traditional Knowledge (TK) Database and Search Service The development of biotechnology has increased the economic and industrial importance of traditional medical knowledge and genetic resources. In particular, right after the US announced ‘the guideline for industrialization of natural medicines in August 2000, other countries, mainly China and India, intensified their efforts to protect traditional medical knowledge. Discussions on such subjects as terminology, definitions and protection of TK and the means of making it prior technology have been ongoing with the Intergovernmental Committee of WIPO as its focal point. As protection of intellectual property has extended not only to cutting-edge technology but also TK, KIPO has pursued the project to build Korea’s TK into both Korean- and English-language databases in order to prevent foreigners from acquiring patents for its use either at home or abroad.
Table 2. Progress on a Project to Build a Database for Korea’s Traditional Knowledge
259
[ Institutional Infrastructure for IPR-Based Development in Asia ]
In particular, KIPO has opened a Korean TK site (www. Koreatk.com), which enables users to search and use the database that has been built up since December of 2007.
Fig. 22. Korean Traditional Knowledge Site
260
8. Conclusions and Recommendations • • • • • •
The patent examination process should be shortened. The patent trial system should be improved. The number of examiners should be increased. Examiners’ qualification should be improved. Incentives for invention should be introduced. An effective method of rights protection should be developed.
References
[ Institutional Infrastructure for IPR-Based Development in Asia ]
1. Korea Patent Office (KIPO), Annual Reports 2008-2000. 2. Korea Institute for Industrial Economies and Trade (KIET), Results of Social and Economic Effects due to Shortened Examination Processing Period. 3. Song YoungSik et al., Intellectual Property Law (9th ed.), Sechang Publishing, 2007. 4. Ubiquitous IPR Management, KIPOnet, KIPO. 5. Understanding the Patent Act of the Republic of Korea, KIPO. 6. Yun SunHee, Intellectual Property Law (9th ed.), Sechang Publishing, 2007. 7. Yun SunHee, Patent Law (3rd ed.), Bumunsa, 2007. http://www.kipo.go.kr. http://www.kipris.or.kr. http://www.kiporo.go.kr. http://www.koreantk.com. http://verdi.kobic.re.kr/patome_kr/.
Institutional Infrastructure for Patent-Based Development in Asia Singapore Wee Loon Ng-Loy*
261
Introduction 1. Overview of the Patent System 2. Patent Registration Procedure 3. Searches for Novelty and Inventive Step 4. Empirical Analysis of the Patent Registration Process 5. Use of the Patent Information Retrieval System Conclusion
Introduction Singapore’s report will contribute to the research project by providing the following information and analysis. Section 1 provides an overview of the patent system in Singapore (membership of international patent conventions; the source of its domestic patent law). Section 2 explains the mechanics of the patent registration process in Singapore. Section 3 sets out the legal principles governing searches for novelty and for inventive step. Section 4 provides an empirical analysis of the patent registration process.
Finally, this report draws a conclusion in which a recommendation for future cooperation is made.
1. Overview of the Patent System Singapore does not provide any legal protection for petty patents or utility models. Therefore, the term “patents” as used in this report does not include either. More specifically, “patents” refers to the legal regime that protects the subject matter defined in Art 27(1) of the TRIPS Agreement, i.e. “inventions, whether products or processes, in all fields of technology, provided that they are new, involve an inventive step and are capable of industrial application”.
(a) Membership of International Conventions Singapore is a party to the following international conventions which have implications for patents: • The WTO/TRIPS Agreement (date of membership: January 1, 1995) • The Paris Convention for the Protection of Industrial Property (date of membership: February 23, 1995) *
The views expressed in this report are those of the author and do not necessarily reflect those of the WIPO Secretariat or any of its Member States.
[ Institutional Infrastructure for IPR-Based Development in Asia ]
Section 5 describes the patent information retrieval system available in Singapore.
262
• The Paris Cooperation Treaty (date of membership: February 23, 1995) • The Budapest Treaty on the International Recognition of the Deposit of Microorganisms for the Purpose of Patent Procedure (date of membership: February 23, 1995)
(b) Source of the Domestic Patent Law Governing patent legislation in Singapore is the Patents Act 1994, which came into force on February 23, 1995. Prior to this, Singapore had a patent re-registration system, i.e. where a person seeking patent protection in Singapore would first have to obtain a patent in the UK and then apply to register it in Singapore within three years of the grant in the UK.66 Therefore, up to February 23, 1995, there was no concept of patent search and examination: the country was content to grant a patent on the basis of search and examination conducted by other patent offices (the UK Patent Office and the European Patent Office (EPO)). Even today, the concept of patent search and examination in Singapore is, to a large extent, non-existent. Although Singapore now has its own Patent Act, it continues to rely on the search and examination capacities of foreign patent offices. The collaboration between the Singapore Patent Office and patent offices in other countries will become apparent in the next section which sets out the patent registration procedure.
2. Patent Registration Procedure
[ Institutional Infrastructure for IPR-Based Development in Asia ]
When the patent office of Singapore – which is located within the Intellectual Property Office of Singapore (IPOS) – receives a patent application, a preliminary examination is conducted where the examination focuses solely on compliance with what are known as formal requirements, such as the use of the correct form, the inclusion of an address for service in Singapore, the contents of the abstract. In short, the preliminary examination is a formality examination. When the patent application satisfies all the formal requirements, IPOS notifies the applicant and from this point on there are various options available to the applicant as illustrated in Table I below.
66
This re-registration system is set out in the (repealed) Registration of United Kingdom Patents Act 1937. Singapore’s reliance on the UK patent system is not surprising, given that Singapore was a British colony.
[ Institutional Infrastructure for IPR-Based Development in Asia ]
Table 1. Options Available to a Patent Applicant
263
[ Institutional Infrastructure for IPR-Based Development in Asia ]
264
From the options set out in Table 1, it is obvious that the search and examination reports for a patent application are not issued by IPOS itself. Rather, these reports may (depending on the option chosen by the patent applicant) emanate from one of the following sources:
265
• The patent office in Australia, Austria, Canada, China, Denmark, Finland, Japan, Korea, New Zealand, the Russian Federation, Spain, Sweden, the UK or the US. • The EPO. • The Nordic Patent Institute. Upon receipt of the search and/or examination reports issued by the foreign patent office(s), the applicant decides whether to apply to IPOS for grant of the patent. When IPOS receives an application, it is assessed for compliance with the following provisions: (a) (b) (c) (d)
There is no unresolved objection on the grounds that there is no unity of invention. Each claim in the application has been examined. The invention does not offend the ordre public provision. No earlier grant of a patent in respect of the same invention has been made to the applicant.
What IPOS does not do at this final stage is make an assessment of the novelty and non-obviousness of the subject matter of the application. It takes the view that this would have been done by the foreign patent office(s), and it further relies on the applicant’s good faith in that his decision to apply for a grant must have proceeded on the basis that the foreign patent office had issued a favorable examination report. For this reason, the patent registration system in Singapore has been described as a selfassessment system.
fraud and misrepresentation on the part of the applicant, and, in some cases, non-disclosure or inaccurate disclosure of material information whether or not the applicant knew or ought reasonably to have known of such information or the inaccuracy of such information. The latter ground for revocation is a very clear indicator that the self-assessment system requires a high standard of diligence from the patent applicant. The flow chart below sets out the essential steps in the patent registration process.
1
Section 82 lists the type of proceedings in which the validity of the patent may be put at issue: infringement proceedings; “groundless threats” proceedings; proceedings for declaration of non-infringement; revocation proceedings; proceedings for compulsory license for government use.
[ Institutional Infrastructure for IPR-Based Development in Asia ]
Challenges to the patent’s validity are made in, for example, revocation proceedings or in infringement actions.1 To ensure the effective operation of this self-assessment system grounds for revocation include
[ Institutional Infrastructure for IPR-Based Development in Asia ]
266 Patent Registration Process
3. Searches for Novelty and Inventive Step
267
As indicated above, IPOS does not examine an invention for compliance with the novelty and inventive step requirements at the time it has to decide whether to grant a patent for a specific invention. This is done at a later stage: in particular, in revocation proceedings or in infringement actions (wherein the invalidity of the patent is raised as a defense). The following is a summary of the law on novelty and inventive step, as developed in the Singapore courts. (Note that IPOS does not issue examination guidelines.)
(a) Novelty An invention shall not be considered new if at any time before its priority date, it has been “made available to the public (whether in Singapore or elsewhere) by written or oral description, by use or in any other way”.2 In short, Singapore adopts the world standard in its novelty requirement. The novelty standard is very strict,3 in the sense that an invention shall be taken to have been made available to the public even if its disclosure or use was only to a single member of the public. The invention is anticipated by prior disclosure only if this disclosure is an enabling disclosure, that is, one where the instructions are sufficiently clear and complete to allow a skilled operator to reproduce the invention.4 In other words, there is no need for absolute clarity and completeness in prior disclosure.5
(b) Inventive Step An invention shall be taken to involve an inventive step if “it is not obvious to a person skilled in the art”. In this enquiry for non-obviousness, the following 4-step approach is used as a guide:
(2) Assume the mantle of the normally skilled but unimaginative operator in the art at the priority date and impute to him what was, at that date, common knowledge in the art in question. (3) Identify what, if any, differences exist between the matter cited as being “known or used” and the alleged invention. (4) Ask whether, viewed without any knowledge of the alleged invention, those differences constitute steps which would have been obvious to a skilled operator or whether they require any degree of invention.
2
See section 14(1) of the Singapore Patents Act.
3
Institut Pasteur v. Genelabs Diagnostics Pte Ltd [2000] SGHC 53.
4
Genelabs Diagnostics Pte Ltd v. Institut Pasteur [2001] 1 SLR 121.
5
Ng Kok Cheng v. Chua Say Tiong [2001] 3 SLR 487.
6
See section 15 of the Singapore Patents Act.
7
This 4-step approach has been endorsed by the Singapore Court of Appeal (which is the highest appellate court in Singapore) in various cases, for example, First Choice Currency Pte Ltd v. Main-Line Corporate Holdings Ltd [2008] 1 SLR 335.
[ Institutional Infrastructure for IPR-Based Development in Asia ]
(1) Identify the inventive concept embodied in the invention.
[ Institutional Infrastructure for IPR-Based Development in Asia ]
268
The essence of the above 4-step approach is set out in the flow chart below.
It is clear from the flow chart that the 4-step approach merely provides a general framework within which the enquiry for an inventive step is conducted: it does not provide any assistance as to how the tribunal should determine if the difference(s) in the invention constitute(s) steps which are obvious or which require some degree of invention. On this last question, the courts have developed guidelines: • Commercial success of the invention – If the invention enjoys commercial success which is attributable to the invention itself (and not to other factors such as clever advertising and marketing of the invention) this is an indication that it involves an inventive step.8 The rationale for this guideline has been explained as follows: commercial success indicates that the invention meets a long-felt need in the industry and, if the invention was obvious, why was it not produced before? • Simplicity of the invention – The invention is not obvious merely because it is a simple invention. The question should not be whether the difference(s) in the invention (relative to the cited prior art) is/are a small step forward. Rather, the relevant question should be: is it a significant step forward that nobody else had taken before?9 The assessment is therefore qualitative and not quantitative in nature.
8
FE Global Electronics Pte Ltd v. Trek Technology (Singapore) Pte Ltd [2006] 1 SLR 874, and Ng Kok Cheng v. Chua Say Tiong [2001] 3 SLR 487.
9
Peng Lian Trading Co v. Contour Optik Inc [2003] 2 SLR 560.
4. Empirical Analysis of the Patent Registration Process
269
The efficacy of the patent registration process in a country may be gauged by reference to different indicators including: the rate of patent grants; the resilience of a patent to revocation; the cost of obtaining a patent; the number of patent professionals. It must be noted that these are quantitative indicators, that is, they are attempts to measure the efficacy of the patent registration system by using numbers and statistics. A qualitative assessment of its efficacy is extremely difficult, if not impossible, in a research project of this nature. This section will look at these quantitative indicators for Singapore. The data collected for this purpose is spread over a 13-year period, from 1995 (when the self-assessment system started) to 2007. (a) Rate of Patent Grants Factors that have an impact on this indicator normally include the following: numbers of applications filed; numbers of requests for examination; numbers of patent examiners; numbers of examinations per examiner; numbers of patent grants issued. In the case of Singapore, however, where search and examination is not conducted within the national patent office, many of these factors are irrelevant. What is provided here is (i) the number of applications filed and (ii) the number of patent grants issued.
[ Institutional Infrastructure for IPR-Based Development in Asia ]
Fig. 1 shows the number of applications filed per year, and Fig. 2 shows the breakdown of these applications into those filed by local applicants and those filed by foreign-based applicants.
Fig. 1. Numbers of Patent Applications
270
It can be seen from Fig. 1 that there was an unusual jump in the number of patent applications in 1996. This was due to the transition from the re-registration system to the current self-examination system. The transitional provisions granted a grace period for the registration of UK patents, and many applicants took advantage of this. Disregarding this unusual upswing, the statistics show that there was a significant increase in the number of filings in1995 when Singapore severed its reliance on the UK patent system and developed its own system. For the years 1990–1994, the average number of patent applications filed per year was 2,800; for the years 1997–2007 this was 7,873. Various reasons could account for this increase: one possibility is that inventors found the former system cumbersome. Equally possible is the fact that in later years as Singapore moved towards a knowledge-based economy and more R&D activities were carried out, a greater number of inventions were developed.
[ Institutional Infrastructure for IPR-Based Development in Asia ]
Fig. 2. Rate of Foreign Applications Ratio of foreign applications = Numbers of foreign applications in Year 00/Numbers of all applications in Year 00 × 100 per cent.
It is obvious from Fig. 2 that the vast majority of filings were made by foreign-based applicants. This has not changed over the 13-year year period under survey: on average, 94 per cent of applications each year come from foreign-based applicants. This data shows that the R&D scene is still heavily reliant on MNCs. Nonetheless, local applicants do have some impact. In the IPOS listing of the top 10 patent filers in the years 2001 to 2007 there was a Singapore-based applicant for every year, except for 2005. In 2001–2004, Chartered Semiconductor Manufacturing Pte Ltd was included on the list; in 2006–2007, the Agency for Science, Technology and Research (which is the national research institute) was included. Fig. 3 tracks the number of patents granted in each year versus the number of applications filed in that same year as well as the rate of patents granted.
271
Fig. 3 Numbers of Patent Applications and Grants Rate of grant = (Numbers of patents granted in Year 00)/(Numbers of patent applications in Year 00) x 100 per cent.
When the rate of grant is compared with the other countries surveyed in this research project, the reader must bear in mind the peculiarity of the Singapore system; that is, the fact that substantive patent examination (for novelty and inventive step) is not carried out within IPOS and grants are made upon request by the patent applicant under the self-assessment system. Therefore, it would be difficult to draw any inferences from the fact that the rate of grant is very high in a particular year (say, 81 per cent in 2006) when compared with the situation in Japan (49 per cent in 2006), in Korea (74 per cent in 2006) or in Thailand (97 per cent in 2006).
(b) Resilience of the Patent to Revocation This indicator may be measured quantitatively by looking at factors such as the rate of success in appeals against the examiner’s decision and the rate of success when the validity of a patent is challenged in administrative and/or civil actions before the courts. In the case of Singapore, the validity of a patent may be challenged in, for example, revocation proceedings or infringement proceedings. (See section 2, footnote 3.) Revocation proceedings may be started in the patent office (in which case the adjudicator would be the Registrar of Patents) or in the High Court (in which case, the adjudicator would be a High Court judge). Civil infringement proceedings, however, must be started in the High Court. Very few revocation proceedings are started in the patent office. According to the statistics released by IPOS, it received on average only one application for revocation per year in the period 2001–2007. So far, there has been no decision from the Registrar of Patents to revoke a patent on the grounds that it lacks novelty and/or an inventive step.
[ Institutional Infrastructure for IPR-Based Development in Asia ]
Thus, the rate of patents granted does not illustrate the percentage of applications resulting in a patent grant which were filed in one particular year. For example, the fact that the rate of grant in 2006 was 81 per cent does not mean that 81 per cent of the patent applications filed in that year were granted a patent. In other words, the rate of grant as shown in Fig. 3 does not measure the success rate of a patent application (i.e. the likelihood of an application resulting in a grant by the patent office). Therefore, the rate of grant shown in Fig. 3 does not serve as an indication of how strict or how lenient the Singapore patent examination process is.
272
There were only nine civil patent infringement actions fought in the High Court in the period 1995–2007.10 Of these, seven involved challenges to the validity of the patent in suit (including novelty and/or inventive step): only one succeeded. In other words, the court held that the patent was valid in 86 per cent of these cases. This could be considered a favorable indicator of the strength of patents granted in Singapore.
(c) Cost of Obtaining a Patent One of the factors that an inventor or business takes into account when considering whether to go through the process of obtaining a patent is the cost involved. This is particularly important in the case of inventors in start-ups and for small and medium–sized enterprises. It is with this in mind that the Economic Development Board of Singapore ran a scheme (known as the Patent Application Fund Plus) that provided funds to help cover some of the cost of patent filing. Tables 2 and 3 show fees for filing and renewal. The exchange rate used in this section (US$1 = S$1.66) is based on the World Bank PPP 2005 exchange rate.
Table 2. Fees
[ Institutional Infrastructure for IPR-Based Development in Asia ]
When filing an examination request, the fee payable is not dependent on the number of claims in the patent application. However, this number is relevant when the applicant requests grant of patent: beyond the fixed fee of S$200 (121 US dollars); there is a fee of S$20 (12 US dollars) per claim if the applicant makes more than 25 claims.
Table 3. Renewal Fees
A patent’s validity in Singapore generally lasts 20 years from the date of filing. However, in certain circumstances,11 the patentee may apply for an extension beyond the 20-year period. The first renewal of the patent is needed for the fifth year and every subsequent year thereafter. The renewal fee varies, depending on the age of the patent.
10
This figure, therefore, does not include infringement actions where the parties enter into judgment by consent.
11
There are essentially two scenarios where an extension of a patent term may be allowed: (i) if there is an unreasonable delay in the grant of the patent (either on the part of IPOS or of a foreign patent office); and (ii) if there is a delay in the grant of marketing approval of a pharmaceutical product. See section 36A of the Singapore Patents Act.
(d) The Patent Professionals
273
The profession of patent agent is relatively new: the register of patent agents was set up on February 2, 2002. Today, only a registered patent agent who holds a practice certificate is allowed to conduct patent agency work and advertise himself as a patent agent.12 To qualify as a registered patent agent, an individual must satisfy the following conditions:13 • Be resident in Singapore. • Hold a university degree or equivalent qualification approved by the Registrar of Patents. • Have passed the Graduate Certificate in the Intellectual Property Law course conducted by the Faculty of Law at the National University of Singapore. • Have undergone a one-year internship in patent agency work. • Have passed the Patent Agents Qualifying Examination conducted by IPOS.
Fig. 4. Number of Registered Patent Agents
5. Use of the Patent Information Retrieval System One of the specific aims of this research project was to examine if, and to what extent, patent information retrieval systems are used by patent offices during the search and examination process. The reason for this is that the quality of a patent is enhanced when examiners have access to patent information systems and search facilities. The availability of a comprehensive patent information retrieval system is particularly important with advancements in technology becoming more and more sophisticated. In Singapore, the three areas of technology where most patent grants are made are:
12
Note that an advocate and solicitor of the Supreme Court of Singapore with a valid practicing certificate may conduct patent agency work, but he is not allowed to advertise himself as a patent agent. (See section 104 of the Singapore Patents Act.)
13
See section 104(1) of the Singapore Patents Act and the Patents (Patent Agents) Rules 2001.
[ Institutional Infrastructure for IPR-Based Development in Asia ]
Fig. 4 shows a slow but steady increase in the numbers of registered patent agents from 2002 (when the register was set up) to 2007.
274
• Section C (chemistry and biotechnology); • Section G (optics; computing); and • Section H (electronic circuitry; electric communication).
[ Institutional Infrastructure for IPR-Based Development in Asia ]
The patents in these three areas account for almost 75 per cent (on average) of all patents granted in each year. Of these three areas, Section C (chemistry; biotechnology) is increasing in prominence relative to Sections G and H (optics and computing; electric circuitry and electric communication). This trend accords with the Singapore government’s shift of focus from the electronics to the biomedical sciences in recent years. The data is set out in Fig. 5 below.
(Numbers of patents in that section of technology for Year 00)/ (Total number of patents for Year 00) x 100 % Section A = Agriculture; foodstuffs; medical machinery, etc. Section B = Machinery; transport etc. Section C = Chemistry; biotechnology, etc. Section D = Textiles; paper Section E = Construction of roads, building, railways Section F = Engineering machines, weaponry, etc. Section G = Optics; computing Section H = Electric circuitry; electric communication techniques Fig. 5. Distribution of Patent Grants According to IPC Symbols (%) A patent information retrieval system is not only important in the search and examination process; it can also serve as a valuable tool for the community of researchers. In Singapore, this community is increasing in size. Table 4 shows the numbers in the group known as RSEs (Researchers, Scientists and Engineers), and Table 5 shows the amount spent on research (gross expenditure on R&D). This data was provided by the A*STAR (Agency of Science & Technology), the agency in charge of national research institutes.
Table 4. Researchers, Scientists and Engineers
275
Table 5. Amount spent on R&D
*Exchange rate (US$1 = S$1.66) is based on the World Bank PPP 2005 exchange rate.
In Singapore, there is a patent information retrieval system known as SurfIP (www.surfip.gov.sg) which is the brain child of IPOS.
(i) Contents of the System
• • • • • • • • • •
Canada (CIPO) China (SIPO) Europe (EPO) Japan (JPO) Korea (KIPO) Singapore (IPOS) Taipei (TIPO) Thailand (TIPIC) UK (UK-IPO) US (USPTO)
A search on SurfIP can also reveal what are called Technology Competitive Intelligent (TCI) reports provided by a commercial company. These reports may be used, for example, to track trends in patent filings in a particular area of technology, in a country or by a particular company.
(ii) Users of the System The SurfIP patent information system is available to any member of the public (inside and outside of Singapore). Other than the TCI reports, access to the documents available in this system is free. (In the case of the TCI report, payment is due to the company which prepared the reports.) Because substantive examination (for novelty and inventive step) is not conducted within IPOS, the most frequent users of the SurfIP patent system are external parties such as researchers, inventors, businesses and patent agents (assisting their clients). It is conceivable, though, that when the patent offices in Australia, Austria or Denmark examine an application pursuant to a request from IPOS (if this is the option chosen by the applicant in Singapore), the examiner in this foreign patent office will carry out the examination in the light of the prior art from the patent databases in SurfIP, in particular the documents from IPOS’ own
[ Institutional Infrastructure for IPR-Based Development in Asia ]
The patent databases in SurfIP include documents from WIPO’s PCT database and documents from the following patent offices:
276
digital patent database. The IPOS digital patent database is available on SurfIP, as well as on a separate and independent website (www.epatent.gov.sg). Apart from offering search facilities, ePatents is also the platform for electronic filing of patent applications with IPOS.
Conclusion
[ Institutional Infrastructure for IPR-Based Development in Asia ]
As indicated in this report, the availability of a comprehensive patent information retrieval system is very important for patent examiners as well as for the research community. At present, Singapore has two such systems, one which is a database of Singapore patents and one which is an amalgamation of the patent databases from a number of countries. Contained in the latter database is a very useful resource, namely TCI reports (also known as patent maps). Use of such patent mapping strategies may help chart the direction to take in R&D work, and in this way enhance the level of innovation in a country. They can also be helpful in the examination process for novelty and inventive step. Therefore, there should be cooperation among countries to raise awareness of the value of patent mapping strategies.
Institutional Infrastructure for IPR-Based Development in Asia Thailand Wisanu Subsompon*
277
1. Introduction 2. Patent Applications, Requests for Examination, Patent Registrations 2.1. Decisions to Refuse and Appeals against Examiners’ Decisions to Refuse 3. IP Lawsuits 4. General 5. Outline of Examination Guidelines 6. Patent Agents 7. Retrieval System (Information System) 8. Conclusions and Proposals
1. Introduction The international market is forcing every country to create and enhance its trade potential and advantages through producing innovative goods and services to capture consumers’ interest. Intellectual property therefore plays a significant role in world trade and offers a means to boost competitiveness, especially with regard to patents.
In this study, we will cover both invention patents and petty patents since they are related; where “invention” under Section 3 of the Patents Act is defined as any innovation or invention which creates a new product or process, or any improvement of a known product or process. One difference between them is that the criteria for a petty patent only require novelty and an industrial application, not an inventive step. Not every product and process can be patented; pursuant to Section 9: the following inventions are not protected by the Patent Act: (a) (b) (c) (d) (e)
naturally existing microorganisms and their components, animals, plants or animal and plant extracts; scientific or mathematical rules or theories; computer programs; methods of diagnosis, treatment and care of human and animal diseases; inventions contrary to public order, morality, health or welfare.
Conditions for Patent Application and Examination An applicant for a patent may be either a Thai national or a foreigner. The Patent Act provides legal protection to foreign inventors on the basis of reciprocity. The procedures for granting an invention *
This study was completed with the assistance of co-researcher Dr. Duanghathai Pentrakoon. The views expressed in this report are those of the authors and do not necessarily reflect those of the WIPO Secretariat or any of its Member States.
[ Institutional Infrastructure for IPR-Based Development in Asia ]
The patent system in Thailand was adopted as part of the Thai government’s economic policies and was a result of Thailand’s attempts to accelerate industrial production and trade expansion. The first Thai Patent Act was promulgated in 1979 and amended in 1992 and 1999. Therefore, the current law is the Patents Act (No. 3) 1999. In the Act, “patent” means a document which grants protection to an invention or for a design. There are three different types of patent – (i) an invention patent, (ii) a design patent; (iii) a petty patent or utility model.
patent and a petty patent are presented in Figs 1 and 2, where it is clear that a substantive examination step is required for an invention patent application to be granted. The duration of the grant procedure for both patents is: (i) invention patents approximately 36 to 60 months (based on a simultaneous request for substantive examination) on the category and the complexity of the application; (ii) petty patents, approximately 16 months.
[ Institutional Infrastructure for IPR-Based Development in Asia ]
278
Fig.1. Examination Flow Chart of Invention Patent Applications14
14
Adjusted from the Department of Intellectual Property’s Annual Report 2007
[ Institutional Infrastructure for IPR-Based Development in Asia ]
279
Fig. 2. Examination Flow Chart of Petty Patent Applications
15
Adjusted from the Department of Intellectual Property’s Annual Report 2007
16
280
2. Patent Applications, Requests for Examination, Patent Registrations Figs 3-6 show the statistics for filed and granted invention and petty patent applications, showing that Thai inventors tend to file petty patents rather than invention patents whereas foreign applicants tend to file invention patents. This may be due to less restrictive requirements. Among the foreign invention patent applications filed between 2003-2007, the countries with the highest number of filed and granted applications were: Japan (approx. 26.5 per cent); European countries (approx. 25.3 per cent); the US (approx. 22.4 per cent); Thailand (approx. 14.9 per cent); other Asian countries (approx. 9.9 per cent).
[ Institutional Infrastructure for IPR-Based Development in Asia ]
Fig. 3. Invention Patent Applications16
Fig. 4. Invention Patents Granted17
16
Department of Intellectual Property
17
Department of Intellectual Property
281
Fig. 5. Petty Patent Applications18
During the period 2001 to 2007, it was observed that physics represented the lowest number of applications (26 per cent for Thai applicants and 16 per cent for non-residents) as shown in Figs 7 and 8. Thais are more likely to file an application in the area of engineering (approx. 43 per cent) whereas nonresidents prefer the fields of chemistry and biochemistry (approx. 57 per cent), especially in the petrochemical and pharmaceutical industries.
18
Department of Intellectual Property
19
Department of Intellectual Property
[ Institutional Infrastructure for IPR-Based Development in Asia ]
Fig. 6. Petty Patents Granted19
282
Fig. 7. Thai Resident Invention Patent Applications Classified by Subject20
[ Institutional Infrastructure for IPR-Based Development in Asia ]
Fig. 8. Non-Resident Invention Patent Applications Classified by Subject21
As mentioned in section 2, a substantive examination is a requirement for the grant of an invention patent application. Figures regarding requests for substantive examinations from 2004 to 2007 were drawn from DIP record data and are presented in Table 1. No major change was seen during this period.
Table 1. Requests for Substantive Examinations from 2004 to 2007
As reported in the 2007, the number of patent examiners since 2002 has been consistent, i.e. 24 patent examiners in 2002 increased to the present figure of 29. The ultimate criterion for patent examiners is educational background, with a bachelor’s degree being the minimum requirement. The existing patent examiners currently work in the fields of engineering, physics, chemistry and biotechnology. Comparing the number of patent examiners with the number of filed invention patent applications, each examiner has to handle an average of approximately 210 applications a year to avoid a backlog.
20
Department of Intellectual Property
21
Department of Intellectual Property
The reasons put forward for such a backlog are: (i) lack of personnel and criteria for the area, such as less expertise in some technical fields; lack of training programs on intellectual property and foreign language difficulties; not up to DIP standards and (ii) the current database and computer systems do not effectively serve current DIP needs in IP management – either for administration or registration.
283
2.1. Decisions to Refuse and Appeals against Examiners’ Decisions to Refuse
Fig. 9. Patent Applications Refused22
Table 2 gives the percentage ratio of the refused to filed invention patent applications [= (the number of decisions to refuse + the number of withdrawals and abandons)/the number of filed invention patent applications] and the refused to granted invention patent applications [= (number of decisions to refuse + number of withdrawals and abandons)/ number of invention patent applications granted] from 2003 to 2007.
Table 2. Percentage of Refused to Filed Patent Applications and Revoked to Granted Patent Applications from 2003 to 2007.
22
Department of Intellectual Property in interview
[ Institutional Infrastructure for IPR-Based Development in Asia ]
A number of decisions to refuse by examiners after substantive examination from 2000 to 2008 are given in Fig. 9. The number of refusal decisions fluctuates and is relatively low. This may be because this information does not include refusals prior to the substantive examination, i.e. decisions to refuse due to opposition or refusals during the formality examination. From unofficial figures from the Department of Intellectual Property, the number of withdrawals and abandons can only be estimated from 2007, at a figure of approximately 773.
284
The percentage ratios for revoked to filed patent applications and revoked to granted patent applications from 2003 to 2006 were minimal. This was due to numbers for withdrawals and abandonments from 2003 to 2006 not being available. In addition, the numbers of appeals against examiners’ decisions and the numbers of amendments in the appeals against examiners’ decisions were not available either.
3. IP Lawsuits Thailand's patent policy is the same as for many other countries, in that it requires local working of patents and the Patent Act contains provisions to cover this in order to control abusive patents. Compulsory licensing and revocation designate essential legal mechanisms to deal with this. An Act for the Establishment of and Procedure for the Intellectual Property and International Trade Court (CIPITC) 1996 was passed by the National Assembly and promulgated in the Government Gazette on October 26, 1996. Under this Act, a Royal Decree was later passed to inaugurate the Central Intellectual Property and International Trade Court on December 1, 1997. The CIPITC Act was the culmination of a joint effort between the Ministry of Justice and the Ministry of Commerce in the wake of negotiations between Thailand and the US as well as the European Community (EU) on trade-related aspects of IPRs. The procedures for the CIPITC require a continuing trial, which arrives at a more rapid judgment than do conventional rules.
[ Institutional Infrastructure for IPR-Based Development in Asia ]
Table 3 shows the number of patent cases filed at CIPITC from 1998 to 2006. From 2000 to 2006, the number of IP disputes settled were generally in the areas of trademarks (49 per cent); copyright (45 per cent); patents (1 per cent). In 1998, the first five patent cases, consisting of three civil appeals against decisions of the patent board and two criminal cases were filed at the CIPITC. The first infringement cases were filed in 1999 and numbers gradually increased. The average period before the courts’ decision is around two years.23
Table 3. Patent Cases Filed at CIPITC from 1998 to 200624
Following the establishment by the Department of Intellectual Property of the Prevention and Settlement of Intellectual Property Disputes Office as an alternative means of dispute resolution by way of mediation and arbitration, many disputes have been referred to this Office: in 2004, 12 IP disputes were successfully mediated. Since the establishment of the Office in 2002, the number of successfully mediated disputes
23
L. Tanasugarn, The First 10 Years of Patent Cases in CIPITC: (1) Results of Preliminary Analyses IP&IT Special Issue 2007: 10th Anniversary.
24
Data obtained from CIPITC.
stands at 17. These can be classified in accordance with the types of intellectual property as follows: 15 copyright disputes, one trademark dispute and one patent dispute. As far as settlement by way of arbitration is concerned, only one dispute, which was concerned with copyright, has been referred to the Office and the proceedings took no more than 90 days.
285
4. General Details of fees for filing invention patent and petty patent applications are given below.
[ Institutional Infrastructure for IPR-Based Development in Asia ]
Table 4. Fees for Filing Patent Invention and Petty Patent Applications25.
25
Ministerial Regulation on Fee and Waived Fee for Patents and Petty Patents, 2004.
286
5. Outline of Examination Guidelines To conduct a substantive examination, the patent examiner reveals the substance of the application under section 5 of the Patents Act, i.e. novelty, inventive step and industrial applicability, in line with sections 6, 7, and 8 as follows: Pursuant to section 6, the following patents are considered to be prior art and shall not be deemed to be new: 1. an invention which is widely known or used in Thailand prior to the date of the patent application; 2. an invention of which the essentials or specification were disclosed in a published document or printed matter, whether in Thailand or abroad, prior to the date of the patent application, whether disclosure was through document, printed matter, exhibition or public disclosure or by any means whatsoever; 3. an invention already patented or petty patented inside or outside Thailand prior to the date of the patent application; 4. an invention where application was made for a patent or a petty patent outside Thailand more than 18 months prior to the date of the patent application but which had not yet been granted; 5. an invention for which an application for a patent or a petty patent had already been made inside or outside Thailand and which was published before the date of filing of the application in Thailand. Pursuant to section 7, an invention shall be taken to involve an inventive step if it is not obvious to a person ordinarily skilled in the art.
[ Institutional Infrastructure for IPR-Based Development in Asia ]
Pursuant to section 8, an invention shall be taken to be capable of industrial application if it can be made or used in any kind of industry, including handicrafts, agriculture and commerce. The applicant must request a substantive examination within five years from the date of publication. Three different options for requesting a substantive examination in Thailand are: (i) submitting the substantive examination report issued in relation to the corresponding priority patent application; (ii) requesting an international service (the Australian Patent Office) to conduct a search through the Thai Patent Office; (iii) requesting a qualified local service to conduct the search through the Thai Patent Office. The Thai examiner will not conduct a substantive examination until receipt either of the substantive examination report described in (i); or a search report described in (ii) or (iii). The examiner normally reexamines the substantive examination or the search report by using an internal database, i.e. the DIP database or one of the most accessible external databases, i.e. the EPO, the USPTO or the JPO.
6. Patent Agents
287
According to DIP records, the current number of registered patent agents is 2,187. Any interested person can obtain a contact address from the DIP website (http://www.ipthailand.org/ipthailand/index.php?option=com_content&task=category§ionid=18&id=4 65&Itemid=706). Previously, to qualify as a patent agent, an applicant had to undergo an accredited patent agents’ course which usually only took five days. Although the number of registered patent agents is relatively high, most of them are inactive or do not practice regularly. This is the reason for the DIP’s recent attempts to revise the list by issuing a new regulation to classify registered patent agents into three different categories. The DIP also established a new patent agent assessment system in 2008, i.e. the newly qualified patent agent was obliged to attend specific lectures and training programs at the DIP before sitting an examination. Patent agents who pass the new assessment test are categorized as professional patent agents.
7. Retrieval System (Information System) The retrieval systems at the DIP for patent examiners and applicants are relatively similar. They can assess the Thai Intellectual Property Information Center via the DIP website (http://patentsearch.moc.go.th/DIPSearch/) which permits them to enter the domestic patent database and foreign patent databases such as the JPO, KIPO, WIPO, the EPO and the USPTO. Aside from these websites, they may also use the Internet to search commercially available information including patent and non-patent literature.
8. Conclusions and Proposals Generally, the current Thai patent system compares favorably with the international patent system, however; there are still some issues to be considered in order to achieve greater efficiency. For example, - increasing the number of patent examiners to deal with the volume of applications filed (each patent examiner currently handles an average of 253 applications each year), especially as Thailand has recently became a member of the Paris Convention with the intention of joining the PCT; - enhancing the patent examiners’ capabilities in the areas of language and technical knowledge (since the latter is constantly changing); - providing a perceptible career path or some incentive to encourage current examiners and to attract more, competent people into this profession; - adjusting official fees (currently relatively low compared with other countries), which should reduce inappropriate patent applications and also generate more revenue to the Patent Office; - improving the retrieval system to cover more relevant databases to assist the patent examiners and to upgrade the quality of their work; - providing a retrieval system for the public to encourage more extensive use of patent information which may help to enhance the quality of patent applications as well as increase the use of patent information.
[ Institutional Infrastructure for IPR-Based Development in Asia ]
For the patent examiner at the DIP, EPOQUENet is another search engine, which provides access to many technical databases which include patent documents, technical journals, classification schemes and standards. Other specialist databases where payment is made are not presently available.
For more information contact the World Intellectual Property Organization Address:
34, chemin des Colombettes P.O. Box 18 CH-1211 Geneva 20 Switzerland Telephone:
+ 41 22 338 91 11 Fax:
or its New York Office at: Address:
2, United Nations Plaza Suite 2525 New York, N.Y. 10017 United States of America Telephone:
+1 212 963 6813 Fax:
+1 212 963 4801
+ 41 22 733 54 28 Visit the WIPO website at:
www.wipo.int and order from the WIPO Electronic Bookshop at:
www.wipo.int/ebookshop
WIPO Publication No. 1018e
ISBN 978-92-805-1926-6