Vol. 3, No. 8
Modern Applied Science
Production of Bio-ethanol from Sugar Molasses Using Saccharomyces Cerevisiae Shanmugam Periyasamy Department of Mechatronics Engineering, K. S. R College of Technology Tiruchengodu, TN, India Tel: 91-4288-274741
E-mail:
[email protected]
Sivakumar Venkatachalam (Corresponding author) Department of Food Technology, Kongu Engineering College Perundurai, Erode - 638052, TN, India Tel: 91-4294-226-602
E-mail:
[email protected]
Sridhar Ramasamy Department of Chemical Engineering, Kongu Engineering College Perundurai, Erode - 638052, TN, India Tel: 91-4294-226-602
E-mail:
[email protected]
Venkatesan Srinivasan Department of Chemical Engineering, Kongu Engineering College Perundurai, Erode - 638052, TN, India Tel: 91-4294-226-602
E-mail:
[email protected]
Abstract Saccharomyces cerevisiae is the cheapest strain available for the conversion of biomass substrate. In the present study, it is used for bio-ethanol production from sugar molasses. The influencing parameters that affect the production of bio-ethanol from sugar molasses are optimized. The optimal values of the parameters such as temperature, pH, substrate concentration, enzyme concentration and fermentation period are found to be 35°C, 4.0, 300 gm/l, 2 gm/l and 72 h respectively. Under this optimum operating condition the maximum of 53% bio-ethanol yield is achieved. The rate of formation of bio-ethanol is found to be well fitted with Michael-Menten equation and the rate constants such as Vmax and Km are found to be 0.71 mol/l sec and 81.63 mol/l respectively. Keywords: Bio-ethanol, Sugar molasses, Fermentation, Saccharomyces cerevisiae 1. Introduction Nowadays the petroleum products are running out of race due to unbalanced relation between supply and demand besides air pollution of sources. The hike in petrol cost is mainly due to shortage of resources which leads to search for alternate fuel to replace fossil fuels. An eco-friendly bio-ethanol is one such alternate fuel that can be used in unmodified petrol engines with current fueling infrastructure and it is easily applicable in present day combustion engine, as mixing with gasoline (Hansen et al., 2005). Combustion of ethanol results in relatively low emission of volatile organic compounds, carbon monoxide and nitrogen oxides. The emission and toxicity of ethanol are lower than those of fossil fuels such as petroleum, diesel etc., (Wyman & Hinman, 1990). More than a few decades, though there have been several reviews of literature (Beatriz Palmarola et al., 2005, Dale, 1987, Ferrari et al., 1992, Martin et al., 32
Modern Applied Science
August, 2009
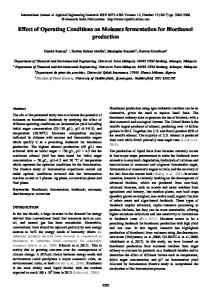
2006, Nigam, 1992, Olsson & Hahn-Hagerdal, 1996) available for the production of bio-ethanol from various sources, only a very few authors (De Vasconcelos et al., 1998; Doelle and Greenfield, 1985; Huertaz-Díaz et al., 1991) have studied kinetics for the production of ethanol from sugar cane using yeast cells (Saccharomyces cerevisiae). Hence in this present research an attempt has been made to optimize the variables which affect the bio-ethanol production from sugar molasses and the experimental results are compared with the available reaction kinetics. 2. Material and Methods 2.1 Experimental methods A known quantity of sugar molasses and Baker’s Yeast (saccharomyces cerevisiae) were taken in fermentation flask and kept in a constant temperature shaker. An anaerobic condition was maintained for four days and during this period, the strain converts sugar into bio-ethanol with the evolution of CO2. A known fermented sample was collected for every 12 h interval. The same procedure was repeated to optimize the parameters such as pH, Temperature, substrate concentration and yeast concentration. 2.2 Identification of bio-ethanol About 5 to 10 ml fermented sample was taken and pinch a of potassium dichromate and a few drop of H2SO4 were added. The colour of the sample turns from pink to green which indicates the presence of bio-ethanol. 2.3 Determination of sugar concentration The sugar concentration was determined by Rapid method. The 5 ml of fermented sample was taken and dissolved in 100 ml of distilled water and mixed with 5 ml of conc. HCL acid and is heated at 70oC for a period of 10 min. The obtained sample was neutralized by adding NaOH and it was prepared to 1000 ml and taken into burette solution. The 5 ml of Fehling A and 5 ml of Fehling B were taken and mixed with 10 to 15 ml of distilled water in a conical flask and Methylene blue indicator was added. The conical flask solution was titrated with burette solution in boiling conditions until disappearance of blue colour. The sugar concentration was calculated by using the formula given below: Sugar Concentration (gm/l) = [(Dilution factor x Fehling factor) / Titrate value] x 100 2.4 Determination of ethanol concentration and pH Ethanol concentrations were determined by gas chromatography, using a CG-3537D gas chromatograph manufactured by Instruments Scientifics CG LTDA with a flame ionization detector and a CG-300 integrator. The pH was determined with a B272 pH digital meter, manufactured by MICRONAL. 3. Result and Discussion 3.1 Optimization of pH The sample was fermented to different pH values between 1.0 and 8.0 to obtain maximum yield of bio-ethanol by adding lime or sulphuric acid. The samples were kept in anaerobic condition for a period of four days and the fermented solution was analyzed for every 12 h intervals. Figure 1 show that the bio-ethanol concentration gradually increases along with the increase in pH and reaches a maximum percentage of bio-ethanol production when pH is equal to 4 and later it starts declining due to the lesser activity of yeast. De Vasconcelos et al., (1998) and Nigam, (1999) are also observed the maximum ethanol productivity at pH of 4.2 to 4.5. 3.2 Optimization of Fermentation temperature The sample maintained at an optimum pH (4pH) was fermented to different temperatures like 25oC, 30oC, 35oC, 40oC and 45oC. The samples were kept for fermentation period of four days and the fermented solution was analyzed for every 12 h intervals. Bio-ethanol production increases with the increase in temperature and reaches maximum value at 350C (Figure 2). Further the increasing temperature reduces the percentage of ethanol production and it is mainly due to the denature of the yeast cells. 3.3 Optimization of sugar molasses concentration The sample was fermented with different quantity of sugar molasses concentration such as 50 gm/l, 100 gm/l, 200 gm/l, 300 gm/l and 400 gm/l at an optimum operating condition. Figure 3 shows that the concentration of bio-ethanol increases along with the increase in sugar concentration and reaches maximum ethanol production at sugar concentration of 300 gm/l and further increasing sugar molasses concentration inhibit the ethanol productivity. Bai et al., (2004) and Vasconcelos et al., (1998) are also observed the maximum ethanol productivity. 3.4 Optimization of yeast concentration The optimum quantity of sugar molasses solution was taken in fermentation flask and the pH and temperature were maintained at 4.0 and 35oC. The various quantities of yeast like 1.0 gm, 2.0 gm, 4.0 gm and 8.0 gm were added and kept for a period of four days and the fermented solution was analyzed at every 12 h intervals. Figure 4 shows that as the concentration of yeast increases, the yield of bio-ethanol increase up to 2 gm and then it starts to decrease. 33
Vol. 3, No. 8
Modern Applied Science
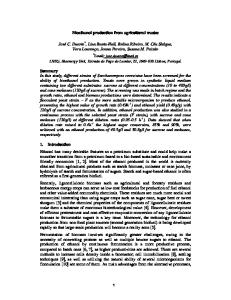
3.5 Productivity of ethanol from sugar molasses Figure 5 shows the productivity of bio-ethanol increases along with the increase in fermentation period and the maximum yield was obtained at 72 h. The maximum concentration of bio-ethanol was found to be 53% at the temperature of 35oC, pH of 4 and yeast concentration of 2 gm. The rate of formation of bio-ethanol is compared with Michael and Mentan equation and was found to be good fit and the rate constants such as Vmax and Km are found to be 0.71 mol/l sec and 81.63 mol/l respectively (Figure 6). 4. Conclusion The optimized conditions were found by analyzing the sugar molasses in the process of fermentation under various parameters like temperature, pH, and time, to obtain maximum yield of bio-ethanol. The optimized conditions of sugar molasses are of temperature 350C, pH 4.0 and the time 72 h which gives maximum bio-ethanol yield of 53%. The fermentation was carried out under anaerobic condition and the results were compared with Michaelis- Menten equation and the obtained values of Vmax and Km are 0.71 mol/l sec and 81.63 mol/l respectively. 5. Nomenclature l
liter
h
hour
gm
gram
gm/l Km
gram/liter Michaelis- Menten constant
Vmax
maximum forward velocity of the reaction
References Bai, F.W., Chen, L.J., Zhang, Z., Anderson, W.A., & Moo-Young, (2004). Continuous ethanol production and evaluation of yeast cell lysis and viability loss under very high gravity medium conditions. J. of Biotechnology, 110, 287-293. Beatriz Palmarola-Adrados, Mats galbe, & Guido Zacchi. (2005). Pretreatment of barley husk for bio-ethanol production. J. of Chemical Technology and Biotechnology, 80, 85-91. Bulock, J.D., Combarbach, D.M., & Ghommidh, C. (1984). Fermentation of biomass for ethanol production. J. of Chem. Engg, 29, B9-B24. Dale BE, (1987). Lignocellulose conversion and the future of fermentation biotechnology. TIBTECH, 5, 287-291. De Vasconcelos, J.N., Lopes, C.E., & de França, F.P. (1998). Yeast immobilization on cane stalks for fermentation. International Sugar J, 100(1190), 73-75. Diez, J.C., & Yokoya, F. (1996). Effect of temperature and pH on ethanol and levan production during sucrose fermentation by zymomonas mobilis. Arq. Biol. Technol, 39, 129-137. Doelle, H.W., & Greenfield, P.F. (1985). The production of ethanol from sucrose using zymomonas mobilis. Appl. Microbial. Biotecnol, 22, 405-410. Favela Torres, E., & Baratti, J. (1987). The effect of pH, temperature and sucrose concentration on high productivity continuous ethanol fermentation using zymomonas mobilis. Appl. Microbial. Biotechnol, 27, 121-128. Ferrari, M.D., Neirotti, E., Albornoz, C., & Saucedo, E. (1992). Ethanol production from eucalyptus wood hemicellulose hydrolysis by Pichia stipitis. Biotechnol. Bioeng, 40, 753-759. Hansen, Alan C., Qin Zhang, Peter, W.L. Lyne. (2005). Ethanol diesel fuel blends – a review. Bioresource Technol, 96, 277-285. Hridayabhiranjan Shukla, Lakshmikanthrao Viswanathan, & Niranjan Prasad Shukla, (1984). Reaction kinetics of D-glucose fermentation by Saccharomyces Cerevisiae. Enzyme Microb. Technol, 6, 560-564. Huertaz-Díaz, H., Cacho, C.L., & Bernard, L. (1991). Fermentation of sugarcane juice and blackstrap molasses by zymomonas mobilis. J. Agric. Univ.P.R, 75(1), 43-50. Kotter, P., & Ciriacy, M. (1993). Xylose fermentation by saccharomyces cerevisiae. Appl. Microbial. Biotechnol, 38 (6), 776–783. Marcia Sadae Tano, & Joao Batista Buzato. (2003). Effect of the presence of initial ethanol on ethanol production in sugar cane juice fermented by zymomonas mobilis. Brazilian J. of Micro, 34, 242-244.
34
Modern Applied Science
August, 2009
Martin, C., Lopez, Y., Plasencia, Y., & Hernandez. (2006). Characterization of agricultural and agro-industrial residues as raw materials for ethanol production. Chem.Biochem.Eng, 20 (4), 443-447. Nigam, J.N. (1999). Continuous ethanol production from pineapple cannery waste. J. of Biotechnol, 72, 197-202. Olsson, L., & Hahn-Hägerdal, B. (1996). Fermentation of lignocellulosic hydrolysis’s for ethanol production. Enzyme Microb. Technol, 18, 312-331. Peres, M.F.S., & Laluce, C. (1998). Ethanol tolerance of thermo tolerant yeasts cultivated on mixtures of sucrose and ethanol. J. Ferment. Bioengin, 85(4), 388-397. Wyman, C.E., & Hinman, N.D. (1990). Ethanol: Fundamentals of ethanol production from renewable feedstocks and use as a transportation fuel. Appl. Biochem. Biotechnol, 24:25, 735–753.
Concentration of Alcohol (%)
Table 1. Properties of baker’s yeast Baker’s Yeast
Property
Dry material
30 - 33%
Nitrogen
6.5 - 9.3%
Proteins
40.6 - 58%
Carbohydrates
35 - 45%
Lipids
5.0 - 7.5%
1 pH 2 pH 3 pH 4 pH 5 pH 6 pH 7 pH 8 pH
60 50 40 30 20 10 0 0
24
48
72
84
Time (h)
Figure 1. Optimization of pH
Concentration of Alcohol (%)
60
25 deg C 30 deg C 35 deg C 40 deg C 45 deg C
50 40 30 20 10 0 0
12
24
36 48 Time (h)
60
72
84
Figure 2. Optimization of temperature 35
Vol. 3, No. 8
Modern Applied Science
50 gm/l
Concentration of Alcohol (%)
60
100 gm/l 50
200 gm/l
40
300 gm/l 400 gm/l
30 20 10 0 0
12
24
36 48 Time (h)
60
72
84
Figure 3. Optimization of sugar molasses concentration
Concentration of Alcohol (%)
60
1 gm/l 2 gm/l 4 gm/l 8 gm/l
50 40 30 20 10 0 0
12
24
36
48 Time (h)
60
72
84
Figure 4. Optimization of yeast concentration
Ethanol Concentration (gm/l)
100 80 60 40 20 0 0
12
24
36
48 Time (h)
60
72
Figure 5. Productivity of bio-ethanol
36
84
Modern Applied Science
August, 2009
2.4 2
1/v
1.6 1.2 0.8 0.4 0 0
0.001
0.002
0.003
0.004
0.005
0.006
0.007
1/G
Figure 6. Plot of 1/G vs. 1/v
37