Parameter influence on moisture induced eigen-stresses in timber
Parameter influence on moisture induced eigen-stresses in timber Martin H¨aglund
To cite this version: Martin H¨aglund. Parameter influence on moistu...
Parameter influence on moisture induced eigen-stresses in timber Martin H¨aglund
To cite this version: Martin H¨aglund. Parameter influence on moisture induced eigen-stresses in timber. European Journal of Wood and Wood Products, Springer Verlag, 2009, 68 (4), pp.397-406. .
HAL Id: hal-00568254 https://hal.archives-ouvertes.fr/hal-00568254 Submitted on 23 Feb 2011
HAL is a multi-disciplinary open access archive for the deposit and dissemination of scientific research documents, whether they are published or not. The documents may come from teaching and research institutions in France or abroad, or from public or private research centers.
L’archive ouverte pluridisciplinaire HAL, est destin´ee au d´epˆot et `a la diffusion de documents scientifiques de niveau recherche, publi´es ou non, ´emanant des ´etablissements d’enseignement et de recherche fran¸cais ou ´etrangers, des laboratoires publics ou priv´es.
Holz als Roh- und Werkstoff
Draft Manuscript for Review
Parameter influence on moisture induced eigen-stresses in timber
Holz als Roh- und Werkstoff
r Fo
Journal:
Manuscript ID: Manuscript Type:
Complete List of Authors:
18-Mar-2009 Häglund, Martin; Div. of Structural Engineering, Building and Environmental Technology, Lund University moisture induced stresses, mechano-sorption, surface coating, moisture content, timber, wood
er
Keywords:
ORIGINALARBEITEN / ORIGINALS
Pe
Date Submitted by the Author:
HRW-09-0056
ew
vi
Re Editorial Office, TU München, Holzforschung München, Winzererstr. 45, 80797 München, Germany
Page 1 of 29
Parameter influence on moisture induced eigen-stresses in timber Martin HÄGLUND Div. of Structural Engineering Lund University P.O. Box 118 SE-22100 LUND, SWEDEN
Moisture induced stress in timber is dependant on many factors. The driving force behind is the moisture variation in the surrounding air which causes induced stress due to restraint of
rP
hygro-expansion within timber elements (this can to some extent be seen analogous to thermally induced stress in steel). Today’s computational power together with advanced constitutive models offers a valuable tool towards understanding and determining moisture
ee
actions on timber. However, it seems that the issue concerning uncertainties of the input parameters is seldom addressed. This paper presents results on how various factors affect the
rR
resulting moisture induced stress by a parametric study of the input values. A small numerical change of one parameter may possibly result in a major change of calculated stress levels. It is for example, shown that coating (paint) and cross-sectional dimensions play an important role for spatial stress distribution.
ev
Einfluss bestimmter Parameter auf Feuchte induzierte Eigenspannungen im Holz Zusammenfassung
Feuchte induzierte Spannungen im Holz hängen von vielen Faktoren ab. Einen wesentlichen Einfluss haben Feuchteänderungen der umgebenden Luft, die wegen behinderter Feuchtedehnung innerhalb der Holzelemente innere Spannungen verursachen (vergleichbar mit Temperatur induzierten Spannungen im Stahl). Die modernen Hochleistungsrechner und verfeinerten Werkstoffmodelle erlauben, Feuchtevorgänge im Holz besser zu verstehen und zu bestimmen. Es scheint jedoch, dass die Unsicherheit der Eingangsdaten dabei bisher selten berücksichtigt wurde. Mittels einer parametrischen Studie der Eingangswerte werden in der vorliegenden Arbeit Ergebnisse vorgestellt, wie verschiedene Faktoren sich auf Feuchte
induzierte Spannungen auswirken. Eine nur geringe numerische Änderung eines Parameters kann zu einer großen Änderung des berechneten Spannungsniveaus führen. So wird unter anderem gezeigt, dass eine Beschichtung (Anstrich) und die Querschnittsabmessungen eine wichtige Rolle bei der räumlichen Spannungsverteilung spielen.
1. Introduction Moisture induced eigen-stresses in timber elements develop because of restraint of hygroexpansion. If the induced stresses are of critical magnitude, cracks may start evolving along the grain direction. In a previous paper (Häglund 2008) a stress model was developed based on separable strains in form of elastic, mechano-sorptive and hygroexpansive strain rates. More background information on mechano-sorption and stresses can be found in, e.g., Armstrong and Christensen (1961), Leicester (1971), Ranta-Maunus (1973, 1975), Grossman (1976), Mårtensson (1992), Toratti (1992), Thelandersson and Morén (1992), Svensson (1997) and Hunt (1999); an informative and comprehensive review of constitutive models is
Fo
presented by Hanhijärvi (2000).
In order to keep the induced stresses at low levels the variation of moisture content must be
rP
controlled. In a normal indoor building environment, the slow annual variation of relative humidity from low in the winter to high in the summer is the most significant effect. There are also more frequent changes on a daily to weekly basis due to random occurrences of rain, sun
ee
and temperature fluctuations over the entire year, see, e.g., Häglund et al. (2005). The consequences of hygroexpansion can be neglected if the timber structures are kept in a constant climate (because there will be no expansion). This is however neither economically,
rR
nor practically feasible in general. A possibly better and more rational method is to use protective water vapour resistant coating on all exposed surfaces.
Parameter values found in literature are in most stress models treated deterministically and not
ev
as being random variables. Each parameter is neither equally influencing (in the perspective of affecting the resulting stress distribution), nor has the same variance. It is thus interesting
to investigate the degree of influence of individual parameters in order to reveal if certain parameters should be considered with greater care when putting a figure on it. And also to underline the issue concerning variability of material between logs and beams; it should not be unknown to anyone that a limiting factor in every model is the quality of what is put in and using accurate and representative values are as important as a proper constitutive model. Here, the presented results encompass effects of beam size, indoor climate, surface coating and several other parameters. The moisture transport is based on diffusion and the calculations are
run on a commercial finite element program (Comsol Multiphysics) using a one-dimensional model. Actual recorded outdoor climate data are used as a basis for determining indoor relative humidity to represent boundary conditions.
2. Material and Theory The theory on moisture transport modelling is presented in a shortened, comprehensive form. The interested reader is referred to Häglund (2007) where more details are given. 2.1
Moisture and Stress in wood
The moisture transport is modelled as a diffusion process and the wood material is treated as isotropic in the transversal directions (experiments on Nordic softwood have shown that the diffusion coefficients are practically the same in the tangential and the radial direction, see, e.g., Rosenkilde and Arfvidsson 1997, Hedenblad 1996 and Hukka 1999). By the empirical
Fo
Fick’s first law the moisture flow vector q [kg/(m2s)] for any chosen moisture state variable θ is expressed as:
q = −D θ grad θ
rP
(1)
where Dθ = Dθ(θ) is the corresponding diffusion coefficient. The Kirchhoff potential, ψ [kg/(m·s)], defined as θ
ψ (θ) =
∫ D θ (θ' )dθ'
(2)
rR
θ ref
ee
is introduced to shorten the calculation time. θref represents a reference moisture state which can be chosen arbitrarily and be expressed in any moisture state parameter. The governing equations in one dimension may hence be expressed as: C ψ (ψ )
where q n is the moisture flux [kg/(m2s)], β ψ = β ψ (ψ ) is the mass transfer coefficient, ψ s
and ψ eq are the Kirchhoff potentials at the surface (immediately under) and at equilibrium in the ambient air, respectively and Cψ(ψ) [s/m2] is the moisture capacity. Based on equated
fluxes, the mass transfer coefficient with respect to the Kirchhoff potential, βψ [m-1], is expressed as: βψ = β v
φ − φ eq ∆v ∆φ = β v v sat = β v v sat s ∆ψ ∆ψ ψ s − ψ eq
(5)
βv is the mass transfer coefficient with respect to vapour content, vsat = v/φ [kg/m3] is the vapour content at saturation (=17.3 g/m3 at 20oC) and φ [%] is the relative humidity. Formatted: Font: Not Bold
Indoor RH can be calculated from outdoor RH according to Eq. (6) under the assumption that
Deleted: (6)
the increase in vapour content due to indoor moisture production, v mp , may be set to a
Formatted: Font: Not Bold, Check spelling and grammar
representative value 3 g/m3 (Nevander and Elmarsson 1994).
Formatted: Font: Not Bold
(6)
o
20 C ,100%} φ indoor = min{( v outdoor + v mp ) / v saturation
The calculations were run on Comsol Multiphysics, a commercial finite element program,
Fo
using Lagrange elements (quadratic) and 17 nodes. The initial moisture content was set to the average of the boundary conditions (expressed in RH) over the calculation time. Material data
rP
was obtained from measurements presented in Hedenblad (1996). Relations between both RH and the Kirchhoff potential and RH and moisture content [kg/m3] were determined for spruce at a temperature around 20°C.
ee
The model was validated against laboratory test results obtained by Jönsson (2004) where the test material was taken from standard glulam beams (quality L40) and moisture sealing was used to have 1D transport perpendicular to grain only.
ev
Stress calculation model
rR
The total strain rate, ε& , is assumed to consist of additive strain rate terms: ε& = ε& e + ε& ms + ε& u
where ε& e = σ& / E is elastic, ε& ms = σ(m u& + βu& ) is mechano-sorptive (Maxwell-type model see,
e.g., Hanhijärvi (2000)), and ε& u = αu& is hygro-expansive strain rate. α is the hygro-expansion coefficient; m and β are mechano-sorption coefficients; σ is the stress; E is the elastic modulus; u is the moisture content [kg/kg]. Time dependant creep is neglected as it is known to be insignificant compared to the mechano-sorption (Kangas and Ranta-Maunus 1989; Svensson and Toratti 2002). For a one-dimensional model (Figure 1), at every time step, ε&
may be set to a linear function ε& ( x ) = ε& 0 + γ& ( x − L / 2) for all layers (i.e., Euler-Bernoulli beam theory where plane cross-sections remain plane after deformation) as a kinematic condition assuming infinite length in the long direction of the cross-section. ε& 0 represents the strain rate in the middle (as well as the average value), γ& represents the inclination of the strain function and L is the width of the cross-section. For constant time-steps ∆t, Eq. (7) can be written as:
Formatted: Font: Not Bold Deleted: (7) Formatted: Font: Not Bold, Check spelling and grammar
∆ε 0 + ∆γ ( x − L / 2) =
∆σ( x ) + ∆ε ms ( x ) + α( x )∆u ( x ) E
(8)
Formatted: Font: Not Bold
Formatted: Font: Not Bold
Force and moment equilibrium must be fulfilled in accordance with Eq. (9), where pext(x) is externally applied stress. L
L
∫ ∆σ(x)dx = ∫ ∆p ext (x )dx 0
Formatted: Font: Not Bold, Check spelling and grammar Deleted: (9)
L
0
Formatted: Font: Not Bold
L
∫ ∆σ(x)xdx = ∫ ∆p ext (x )xdx
and
Fo
0
(9)
0
For linear-elastic materials, an applied force (stress) will be distributed proportionally to the values of the elastic modulus over the cross-section (cf. parallel spring system; also note that
rP
this condition is an approximation if γ& ≠0) and therefore: E( x ) E
∆p ext ( x ) = ∆pext
(horizontal bar represents averaged over cross-section)
(10)
ee
Deleted: (9)
For n different layers, and combination of Eq. (8), (9) and (10), it is found that ∆p ∆ε 0 ∑ C + ∆γ ∑ A C + ∑ B C = ext E k =1 k =1 k =1 n
n
k
k
k
n
k
k
n
n
k =1
k =1
k =1
C ∑ k =1
∆ε 0 ∑ x k C k + ∆γ ∑ A k x k C k + ∑ B k x k C k = k
k
A = ( x − L / 2) ,
k
k
k
Formatted: Font: Not Bold
= ∆p ext L
∆p ext E
k
k ms
Formatted: Font: Not Bold, Check spelling and grammar Formatted: Font: Not Bold
(11)
n
∑ x k Ck k =1
B = (−α ∆u − ∆ε ) ,
k
k
C =d E
Deleted: (8) Formatted: Font: Not Bold Formatted: Font: Not Bold, Check spelling and grammar
k
iew
from which ∆ε 0 and ∆γ can be solved for and then inserted into
∆σ k = E k (∆ε 0 + ∆γ ( x k − L / 2) − ∆ε kms − α k ∆u k )
results (tests with one 100th of a day as time-step were also carried out and yielded the same results). Note that the stress calculation is also valid and applicable to cross-sections of finite length; it is only near the ends (of the long direction) that the model cannot be applied (because of conversion of shear and normal forces in that area). In the case of external Formatted: Font: Not Bold
restraint, i.e., ∆ε0 and ∆γ prescribed, ∆σk can be solved for directly (using Eq. (12)).
Deleted: (12) Formatted: Font: Not Bold, Check spelling and grammar Formatted: Font: Not Bold
moi
n layers (k = 1,2 .... n)
moi
stur e tra nsp
external stress pext(x)
ort in t
ection dinal dir
stur e tra
external stress pext(x)
nsp or
itu he long
t sea
led
gth
n ite le infin
ort seal ed
moisture transport across the layers
x
rP
Figure 1.
L
sp no tran
Fo
Illustration of one-dimensional stress calculation model with n number of slices (layers).
Material data and model validation
ee
From results in Jönsson (2005), the hygro-expansion coefficients for radial direction, αr, and
rR
tangential direction, αt, were set to 1.1 and 2.2 [⋅10-3 (%)-1], respectively. The mechanosorptive coefficients m and β were set to 0.085 and -0.045 MPa-1 based on Ranta-Maunus (1993) and fitting of calculated stresses against the measured ones. The modulus of elasticity
ev
(MOE) was obtained from measurements presented in Jönsson and Svensson (2004) and found to be approximately independent from moisture content in the range considered here. The average MOE for the 11 equally spaced slices is presented in Table 4 (Appendix)
together with the hygro-expansion coefficients. The variation is caused by the orientation of annual rings in the glulam lamellas. The hygro-expansion coefficient was estimated from the average
orientation
of
the
annual
rings
for
each
slice
using
the
relation
α slice = α r cos(ω) 2 + α t sin(ω) 2 , where ω is the average angle between the x-axis (see Figure 1) and the tangent to the annual rings of a specific slice. A 42 mm beam is usually
Deleted: Figure 1
manufactured by sawing a 90 mm beam in two halves. Hence, α and MOE is the same for the
spatially corresponding parts. A 215 mm beam can however not be treated analogously due to general differences in the orientation of the annual rings. Instead, an indirect method is used: from constitutive relations for orthotropic materials, the effective MOE for an arbitrary direction is derived as: E eff (θ) =
E r E t G rt E r G + ( E r E t − G rt (2ν tr E t + 2E r )) cos 2 θ + (− E r E t + G rt (2ν tr E t + E r + E t )) cos 4 θ
(13)
where Er and Et are the MOEs in radial and tangential direction, respectively, Grt is the shear modulus, νtr is the Poisson’s ratio and θ is the angle between the direction of interest and the radial direction. Jönsson (2005) did not measure the shear modulus or the Poisson’s ratio but a reasonable value for the latter is 0.5 (it can also be shown that varying this value has very little influence on Eeff). From a 90 mm cross-section divided into 11 equally space slices, the average angle of the annual rings for the slices could be estimated, and the function Eeff was then fitted against the MOE for each slice in order to obtain MOEs for angles closer to the
Fo
tangential direction, see Figure 2. MOEs for the 215 mm cross-section can now be found from the fitted curve (see Table 4 in the Appendix where the MOEs and hygroexpansion
Deleted: Figure 2 Deleted: Table 4
rP
coefficients are listed). The fitted value for Grt = 42 MPa may seem high compared to other figures found in the literature. Nevertheless, considering that it is an indirect method to obtain MOE values only, the exact value of Grt is of lesser importance as such, and may here to some extent be seen as a fitting parameter only.
ee
The stress model was validated by comparing calculated stresses with measured ones. These measured stresses (from Jönsson 2004) should be regarded as “mean stresses” since the end
effects
are
included.
They
were
therefore
rR adjusted
by
a
factor
1.33,
i.e.,
σ measured,compare ≈ 1.33 σ measured,mean in order to obtain equivalent values (note that this factor is
ev
estimated by Jönsson for his experiment only). A comparison of induced eigen-stresses for drying, wetting, and cycling (weekly, rectangular) after various number of days can be found in Häglund (2008). The calculated stresses matched well with the measured ones. See
Top: Example of typical cross-section 90×270 mm together with estimated values of the average angle (for each entire slice) between the tangential direction of the annual rings and the x-axis. Bottom: Fitted function of Eeff to measured MOEs (marked by x) in Jönsson (2005). The least-squares fit is obtained for ET = 467 MPa, ER = 216 MPa and G = 42 MPa (for νtr set to 0.5). R = radial, T = tangential.
Modelling of moisture induced stress involves several parameters. Tension and compression perpendicular to the grain is a function of geometry, moisture conditions, surface treatment and various material parameters (e.g., the modulus of elasticity and the hygroexpansion coefficient). Stresses are also affected by external mechanical loading due to fasteners, design of supports, large point loads and arches etc. Compared with a relatively well-defined material
like steel (which is homogenous, isotropic and has well-known characteristics), wood does not qualify for such generalizations since deviations between specimens in this context are relatively high (depends on the species, growth conditions etc.) and it is also evidently anisotropic. In other words, the distribution functions of the individual material parameters (generally) have large standard deviations. It is therefore of interest to investigate to what extent moisture induced stresses are affected by each such parameter. The investigated variations are found in Table 1. In the extension, it can be argued that the more accurate a calculation model is, the more important it is to have well-defined representative input
Formatted: English U.K. Deleted: Table 1 Formatted: English U.K.
(principal of consistent degree of crudeness). This study can be seen as a kind of sensitivity analysis in which some of the parameters will prove more or less significant in terms of affecting the stress levels. In Chapter 2.1, a model for moisture and stress was presented and the belonging parameters are here used as basis for a reference calculation. The relative humidity and temperature were obtained from SMHI (Swedish meteorological and
Fo
hydrological institute) for Stockholm between 1961-01-01 and 2003-02-28 (equivalent to 15,399 days) encompassing recordings at intervals between 3 and 12 hours. Daily averages were used as input. Calculated percentiles found in the results section are obtained by finding
rP
the highest value for each full year available and using linear interpolation (since the number of years - 42. - does not allow for direct sorting and extraction of the percentile value)
Table 1.
ee
Parameter variations for the stress calculations
Parameter
Variations
Cross-section Restraint External force (stress) Moisture capacity Mass transfer coefficient Indoor moisture production Hygroexpansion (α) Mechano-sorption (m) Mechano-sorption (β ) MOE
42, 90, 215 mm No and complete restraint (i.e. ∆ε0 = ∆γ = 0) 0, 0.5, 1.0 MPa (tension) factors 0.5, 1.0 and 1.5 times C ψ , calculatio n factors 1.0, 1/5, 1/50 times β v (0.156⋅10-3 m/s) 0, 3, 6 g/m3 factors 0.5, 1.0 and 1.5 times values in Table 4 factors 0.5, 1.0 and 1.5 times 0.085 MPa-1 factors 0.5, 1.0 and 1.5 times -0.045 MPa-1 factors 0.5, 1.0 and 1.5 times values in Table 4
3. Results and Discussion The purpose of this study was to investigate the effects of different parameters on induced tensile stress levels perpendicular to grain. Complex models may be constructed to adapt well to a specific experiment, i.e., for which calculated and measured values have a low discrepancy. A general aspect is that the major difficulty of modelling does not lie within finding a model that proves accurate for one experiment, but for many; finding a generalizable model is a greater challenge. As is shown below, there are clear differences in the distribution of induced stresses depending on which parameter is varied. This kind of information is valuable for improvement of today’s models. Focus may be put on the highly affecting parameters instead of the ones that have no or little effect. Maximum stress levels and distributions for the surface and the middle were determined for the 20 different parameter
Fo
setups shown in Table 2 (the parameters are generally decreased and increased by 50 % where applicable). Table 2.
Setup No.
rP
Deleted: Table 2
Calculation setups. Based on outdoor climate data in Stockholm for the full years of 1961 to 2002, i.e., 42 years. (factor 1.0 in the reference row and related figures are for relative comparison only). Crosssection
Restraint
Moisture capacity
0.5 1.5 -
1.0
1/5 1/50 -
α
β
m
3
1.0
1.0
1.0
1.0
0 6 -
adjusted* adjusted* 0.5 1.5 -
0.5 1.5 -
0.5 1.5 -
adjusted* adjusted* 0.5 1.5
MOE
iew
1.0
0.5 1.0 -
Indoor moisture production
ev
No
Mass transfer coefficient
rR
1 90 No (reference) 2 42 3 215 4 complete 5 6 7 8 9 10 11 12 13 14 15 16 17 18 19 20 * see the appendix
Since any surface treatment, such as wax, varnish or paint hinder moisture transport the mass transfer coefficient is decreased only (note that the surface flux may be regarded as a sort of upper transport limit, i.e., a high enough value of the mass transfer coefficient would cause the cross-sectional moisture distribution to be unaffected by the surface flux equation; the moisture capacity of the inner domain would “slow” the transport down, so that the limiting
flux at the boundary would have a negligible effect). For the cross-sectional variation, the hygro-expansion coefficients and the MOE were adjusted because of a different general orientation of the annual rings; this is due to production and the spatial limitation of a beam Deleted: Figure 3
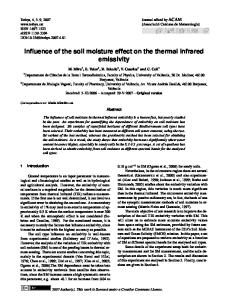
(see Figure 3). Resulting tensile stresses at the surface and in the middle for all setups are presented in Figure 4 and Figure 5. Perhaps most interesting, yet not surprising, is that surface coating has a
Deleted: Figure 4 Deleted: Figure 5
distinct and direct influence on the magnitude of induced moisture gradients. The bars for setups Nr. 9 and 10 show that coating is very effective in keeping high stresses at bay. The lowest of the mass transfer coefficients was set to 1/50 of the reference one, i.e., corresponding to βv = 3.12⋅10-6 m/s. The influence of the mass transfer coefficient is related to the degree of surface coating. Guideline values for the water vapour resistance (denoted by Z) for paint are given in Nevander and Elmarsson (1994) where alkyd paint and acrylic plastic (50 µm layer) lies in the range of 25-75 and 5-20 [⋅103 s/m], respectively (dependant on the
Fo
relative humidity). Converted to β v it is equivalent to 13-200 [⋅10-6 m/s] and is close to the values used in the calculations. From the relation Z total = ∑ Z i it follows that Eq. (14) is valid for one layer of paint.
1
1 β v ,surface
+
1 β v ,paint
Formatted: Font: Not Bold Formatted: Font: Not Bold, Check spelling and grammar Formatted: Font: Not Bold Deleted: (14)
(14)
ee
β v , total
=
rP
For β v,total = 3.1 [⋅10-6 m/s], β v,paint is equal to 3.2 [⋅10-6 m/s] and hence a little lower than the guideline values for one layer of paint only but of course a beam may be painted several times
rR
and then the values would come closer to each other). Other results on positive coating effects are found in, e.g., Gowda et al. (1998). See also Ranta-Maunus and Gowda (1994) and Jönsson (2003).
ev
Furthermore, it is shown that cross-sectional size has an apparent effect on the stress distribution. It is easy to comprehend that smaller sizes lead to low induced stress because
equilibrium can be reached faster, and therefore the hygroexpansion will be more evenly distributed over the cross-section (possible variation between radial and tangential direction will naturally be limited). Fundamentally, there are two main factors affecting the stress: (1) moisture distribution and (2) variation of hygroexpansion. In order to have the same stress state before and after a moisture content change, the expansion must be uniform. Now consider the different beam sizes with reference to the 90 mm beam: the 42 mm beam has lower tensile stress in both the middle and at the surface. The smaller beam evens out
moisture differences faster and therefore prevents higher differences of hygroexpansion to develop. On the other hand, the 215 mm beam has lower stress in the middle but higher at the surface. This is most likely explained by the interaction of two influencing factors mentioned above (see also Figure 6 for a visual explanation to why the hygroexpansion is different between these three analyzed cross-sections).
Formatted: English U.K. Formatted: English U.K. Deleted: Figure 6
One essential question that arises is the applicability of the stress model for situations with externally applied tensile forces. It is namely indicated by the results that the stress model used in this paper may not be applicable under such conditions. The surface stress is more or less unaffected whereas the middle stress in rough figures is increased about two times the applied stress. At first, this was assumed to be due to differences in E-modulus but a test calculation with constant E-modulus over the entire cross-section resulted in a somewhat similar stress pattern. The stress distribution is therefore most likely a product of the combined action of rapid moisture fluctuations at the surface (leading to high accumulation of
Fo
strains which in turns leads to lowered stress) and higher E-modulus in the middle (attracting most of the applied stress) which causes a very non-uniform stress pattern; but yet, intuitively,
rP
there ought to be a noticeable difference also at the surface regions. Hanhijärvi (1995) investigated whether mechano-sorptive creep occurs equally during both wetting and drying or not (it is implied by the model dependence on |∆u|) but he was not able to fully verify it.
ee
Possibly the mechano-sorptive parameters need to be modified at higher stresses but no such available data is known to the author (for that reason no specific validation procedure for externally loaded specimens was possible). Further experimental investigation is needed to be
rR
able to answer the question. Influences of the other parameters are commented and found in Table 3.
Formatted: Complex Script Font: Arial, English U.K. Formatted: Complex Script Font: Arial, English U.K. Deleted: Table 3
Comments on the response of the different parameters
Parameter
Resulting effect on induced stress
Cross-section
See text above.
Restraint
Indication on minor effect. However, difficult to draw any deeper conclusion since complete restraint here defines an ideal situation which is seldom or never found in actual constructions. Restraint caused by, e.g., connectors lies somewhere between no and complete restraint.
External force (stress)
The result is difficult to evaluate since representative cross-sectional measurements for validation of the Maxwell-type mechano-sorptive model under tensile stresses is lacking. It is seen that the applied stress cannot simply be superposed (not even approximately) but whether it is an inherent false effect of the model, or a proper description of the actual response of timber, cannot be concluded without further experiments.
Moisture capacity
Fo
Does not show to have any major effect. In literature, the numerical values vary and there are more or less complicated functions describing its variation, but here it is indicated that the importance is low.
Mass transfer coefficient
rP
Significant effect. Lowering the coefficient by, e.g., paint plays an important role in reduction of stress levels.
Indoor moisture production
Minor effect. The average amount of indoor moisture production is however
ee
most likely negligible in comparison with effect of changes in production from day to night, or between working days and weekends. Hygroexpansion (α)
Major effect with a strict proportional response (σ ∝ α). This was expected
rR
as the stress model states a linear relation between moisture content and hygroexpansive strain. Mechano-sorption (m and β )
Minor to moderate effect. Decreasing m leads to higher stress in the middle but otherwise the stresses falls within ± 20%. In case the mechano-sorptive
ev
effect did not exist the stress would be significantly higher (it can be seen as a sort of a stress-relaxing effect which hinders the development of moisture induced stress) MOE
The diameter of a cut tree limits the maximum width of a glulam lamella to approx. 225 mm. After gluing and planing it is 215 mm which is the widest lamella available in Sweden.
≈ 215 mm
100
rP 5
6
7
8
9
MO E
na l fo rce
Ex
ter
int
4
ter
Re str a
3
Ex
n
se c
se cti o
os s−
Cr
en ce )
Cr
os s−
(re fer
2
10 11 12 13 14 15 16 17 18 19 20 Setup Nr th
ev
Figure 4.
1
rR
tio n
−50
na l fo rce Mois ture cap acit y Mois ture capa city Mass tr ansfer coeff.
0
Ma ss tra ns fer Ind co oo eff rm . ois t. p Ind r o oo d. rm ois t. p Me rod ch . an o− s o Me rp. ch α an o− so rp. Me α ch an o− s o Me rp. ch β an o− so rp. Me β ch an o− so rp. Me ch m an o− so MO rp. m E
50
−100
surface middle
ee
Relative change of the 95th percentile cp. with Setup Nr 1 [%]
150
Fo
Relative increase/decrease of tensile stress of the 95 percentiles between setups 2 to 20 and the reference setup Nr 1 (for which σsurface = 0.97 MPa and σmiddle = 1.09 MPa).
Sample of 90 mm vs. 215 mm beam. Near the surface, the wider beam has much more wood in the tangential direction compared to the smaller one (which instead has a mixture of radial and tangential direction). This is one contributing explanation to why induced stresses differ.
Conclusion This investigation confirms that moisture variation in the ambient air can cause high induced stresses due to hygro-expansion in timber elements. Since the levels may reach values well above the characteristic strength perpendicular to grain (0.5 MPa), the risk of cracking is in many situations ubiquitous (all the same it should be noted that the strength perpendicular to grain is highly size dependent and may be (well) above 0.5 MPa in certain situations) In order to reduce hygro-expansion and induced stress, surface coating is effective as it is a physical barrier to hinder exchange of moisture between the surrounding air and the timber element. Given that the element is in equilibrium when the coating is applied, it is not possible for higher stress levels to develop. On the other hand though, it is important to realize that this method demands that the coating is undamaged and functional during the service life time period. Nevertheless, for loading bearing structures placed indoors (protected environment), problems associated with decay and weathering, e.g., outdoor facings or
Fo
unsheltered structures should not be an issue here. If a higher capacity can be allowed for, then the function of the coating over time must be controlled and analyzed and also protected
rP
from mechanical damage. Studies investigating effects of small cracks/damages in paint layers are not known to the author, but it is a question that undoubtedly will be posed. The cross-sectional size clearly affects the distribution and magnitude of the stresses. In
ee
general terms, higher maximum stress levels are induced in large widths cross-sections than in small ones. This can be explained by differences in moisture content and the occurrence of radial and tangential directions over the cross-section (which is due to production). In many
rR
building codes, e.g., Eurocode and the Swedish code, service class selection does not involve size effects. The results in this paper, however, suggest that effects of moisture are size dependent and should be considered to help improve the design of timber structures.
ev
It is questioned whether the Maxwell mechano-sorptive stress model is applicable under conditions with externally applied tensile forces. The results tentatively indicate that the range
of applicability does not fully encompass external loading. Further mechano-sorptive experiments under loading perpendicular to grain are needed to clarify the actual response of timber.
In summary, it is shown that uncertainties of parameters values may have major effects on calculated moisture induced stress. Discrepancies between experiments and calculations are many times considered being due to the model as such, but one must not forget that input data
is just as important as are the constitutive model structures. If the values of the input parameter are treated deterministically, the output results should be taken with care, especially regarding the high variability that wood holds. Further investigations should include probabilistic analysis in conjunction with Monte-Carlo simulations. Possibly a part of the discrepancies between, e.g., mechano-sorptive experiments and models can be explained by inherent shortcomings in the deterministic parameter approach.
Appendix
Fo
Deleted: Table 4
Used MOE and hygroexpansion values (based on Jönsson 2005) are presented in Table 4.
rP
Table 4. Parameter variation for the stress calculations Slice
References Armstrong LD, Christensen GN (1961) Influence of moisture changes on deformation of wood under stress. Nature; 191:869-870. Gowda S, Kortesmaa et al. M (1998) Duration of load effect on curved glulam beams, part 2: Long term load tests and analysis. ESPOO, VTT Technical Research centre of Finland. Grossman PUA (1976) Requirements for a model that exhibits mechano-sorptive behaviour. Wood Sci Technol 10:163-168. Häglund M, Isaksson T, Holst J (2005) Time-series modeling of moisture exposure on timber structures. Building and Environment 42:1515–1521. Häglund M (2007) Moisture content penetration in wood elements under varying boundary conditions. Wood Sci Technol 41:477-490. Häglund M (2008) Varying moisture content and eigen-stresses in timber elements. Wood Material Science & Engineering 1-2: 38-45. Hanhijärvi A (2000) Advances in the knowledge of the influence of moisture changes on the long-term mechanical performance of timber structures. Materials and Structures 33:4349.
Fo
Hanhijärvi A (1995) Modelling fo creep deformation mechanisms in wood. Technical Research Centre of Finland, Espoo, Finland, VTT Publications 231.
rP
Hedenblad G (1996) Material data for Moisture Transport Calculations, (in Swedish). T19:1996, ISBN 91-540-5766-3, Swedish Council for Building Research, Stockholm, Sweden. Hukka A (1999) The Effective Diffusion Coefficient and Mass Transfer Coefficient of Nordic Softwoods as Calculated from Direct Drying Experiments. Holzforschung 53 No. 5 534-540.
ee
Hunt DG (1999) A unified approach to creep of wood. Proceedings Of The Royal Society Of London Series A-Mathematical Physical And Engineering Sciences 455(1991): 40774095.
rR
Jönsson J, Svensson S (2004) A contact free measurement method to determine internal stress states in glulam. Holzforschung 58:148-153
ev
Jönsson J (2003) The effect of moisture gradients on tensile strength perpendicular to grain in glulam. Holz Roh- Werkst 61:342-348. Jönsson J (2004) Internal stresses in the cross-grain direction in glulam induced by climate variations. Holzforschung 58: 154-159.
Jönsson J (2005) Moisture induced stresses in timber structures. Lund Institute of Technology. Doctoral Thesis Report TVBK-1031.
Kangas J, Ranta-Maunus A (1989) Creep tests on the Finnish pine and spruce perpendicular to the grain, (in Finnish). Technical Research Centre of Finland, Research Notes 969, Espoo. Leicester RH (1971) A rheological model for the mechano-sorptive deflections of beams. Wood Sci Technol 5:211-220.
Mårtensson A (1992) Mechanical behaviour of wood exposed to humidity variations. Lund Institute of Technology. Doctoral Thesis Report TVBK-1006. Nevander LE, Elmarsson B (1994) Fukthandboken. (Moisture design manual). 2nd ed. Svensk Byggtjänst, Stockholm, Sweden. Ranta-Maunus A (1973) A theory for the creep of wood with application to birch and spruce plywood. Technical research centre if Finland, Building Technology and community development. Ranta-Maunus A (1975) The viscoelasticity of wood and varying moisture content. Wood Sci Technol 9:189-205. Ranta-Maunus A (1993) Rheological behaviour of wood in directions perpendicular to the grain. Materials and Structures 26:362-369. Ranta-Maunus A, Gowda S (1994) Curved and cambered glulam beams. ESPOO, Technical Research Centre of Finland. Rosenkilde A, Arfvidsson J (1997) Measurement and Evaluation of Moisture Transport Coefficients During Drying of Wood. Holzforschung 51 No.4 372-380. Svensson S, Toratti T (2002) Mechanical response of wood perpendicular to grain when subjected to changes of humidity. Wood Sci Technol 36:145-156.
Fo
Svensson S (1997) Internal Stress in Wood Caused by Climate Variations. Lund University. Doctoral Thesis Report TVBK-1013.
rP
Toratti T (1992) Creep of timber beams in a variable environment. Helsinki University of Technology, Espoo, Finland. Report 31. Thelandersson S, Morén T (1992) Tensile stresses and cracking in drying timber. Lund, Department of Structural Engineering.
Illustration of one-dimensional stress calculation model with n number of slices (layers).
Deleted: 1
Figure 8.
Top: Example of typical cross-section 90×270 mm2 together with estimated values of the average angle (for each entire slice) between the tangential direction of the annual rings and the x-axis. Bottom: Fitted function of Eeff to measured MOEs (marked by x) in Jönsson (2005). The least-squares fit is obtained for ET = 467 MPa, ER = 216 MPa and G = 42 MPa (for νtr set to 0.5). R = radial, T = tangential.
Deleted: 2
Figure 9
The diameter of a cut tree limits the maximum width of a glulam lamella to approx. 225 mm. After gluing and planing it is 215 mm which is the widest lamella available in Sweden.
Deleted: 3
Figure 10. Relative increase/decrease of tensile stress of the 95th percentiles between setups 2 to 20 and the reference setup Nr 1 (for which σsurface = 0.97 MPa and σmiddle = 1.09 MPa).
Deleted: 4
Figure 11. Boxplot showing the 5th, 25th, 50th, 75th and 95th percentiles of annual maximum tensile stress at the surface and in the middle.
Deleted: 5
Figure 12. Sample of 90 mm vs. 215 mm beam. Near the surface, the wider beam has much more wood in the tangential direction compared to the smaller one (which instead has a mixture of radial and tangential direction). This is one contributing explanation to why induced stresses differ.
Deleted: 6
ee
Table legends
rP
Fo
Table 5.
Parameter variations for the stress calculations
Deleted: 1
Table 6.
Calculation setups. Based on outdoor climate data in Stockholm for the full years of 1961 to 2002, i.e., 42 years. (factor 1.0 in the reference row and related figures are for relative comparison only).
Deleted: 2
Table 7.
Comments on the response of the different parameters
Abb. 1 Darstellung eines eindimensionalen Modells zur Spannungsberechnung mit einer Anzahl an n Scheiben (Schichten) Abb. 2
Oben: Beispiel eines typischen Querschnitts 90x270mm² zusammen mit geschätzten Werten des durchschnittlichen Winkels (jeder Schicht) zwischen der tangentialen Richtung der Jahrringe und der x-Achse, Unten: Angepasste Funktion von Eeff an die gemessenen Elastizitätsmoduli (markiert mit x) in Jönsson (2005). Die beste Anpassung (kleinste quadratische Abweichung) ergibt sich für ET = 467 MPa, ER = 216 MPa und G = 42 MPa (für νtr =0,5). R = radial, T = tangential.
Abb. 3
Der Durchmesser der eingeschnittenen Bäume begrenzt die maximale Breite einer Brettschichtholzlamelle auf ca. 225mm. Nach dem Verkleben und Hobeln beträgt diese 215 mm. Dies ist die größte in Schweden erhältliche Lamellenbreite.
Abb. 4
Prozentuale Veränderung der 95% Fraktilwerte der Zugspannung zwischen den Parametervarianten 2 bis 20 und den Referenzbedingungen der Variante 1 (für diese gilt σsurface = 0,97 MPa und σmiddle = 1,09 MPa).
Abb. 5
5%, 25%, 50%, 75% und 90% Fraktilwerte der maximalen jährlichen Zugspannung an der Oberfläche und in der Mitte.
Abb. 6
Beispiel eines 90mm und eines 215 m Balkens. Im Bereich der Oberfläche ist das Holz des breiteren Balkens sehr viel stärker tangential orientiert als das Holz des schmaleren Balkens (das gemischt radial und tangential orientiert ist). Dies erklärt u. a., warum sich die entstehenden Spannungen unterscheiden.
ee
rP
Fo
Tabelle 1 Gewählte Parameter für die Berechnung der Spannung
rR
Tabelle 2 Rechenannahmen auf der Grundlage von Außenklimawerten in Stockholm im Zeitraum 1961 bis 2002, d.h. über 42 Jahre (der Faktor 1,0 bei den Referenzwerten in der Zeile 1 und den entsprechenden Abbildungen ist lediglich ein relativer Vergleichswert) Tabelle 3 Hinweise zum Einfluss der verschiedenen Parameter
Tabelle. 4 Gewählte Parameter für die Berechnung der Spannung
Pe Upper: Example of typical cross-section 90×270 mm2 together with estimated values of the average angle (for each entire slice) between the tangential direction of the annual rings and the xaxis. Bottom: Fitted function of Eeff to measured MOEs (marked by x) in Jönsson (2005). The leastsquares fit is obtained for ET = 467 MPa, ER = 216 MPa and G = 42 MPa (for νtr set to 0.5). R = radial, T = tangential. 338x243mm (600 x 600 DPI)
The diameter of a cut tree limits the maximum width of a glulam lamella to approx. 225 mm. After gluing and planing it is 215 mm which is the widest lamella available in Sweden. 86x86mm (600 x 600 DPI)
Pe Relative increase/decrease of tensile stress of the 95th percentiles between setups 2 to 20 and the reference setup Nr 1 (for which σsurface = 0.97 MPa and σmiddle = 1.09 MPa) 338x238mm (600 x 600 DPI)
Pe Boxplot showing the 5th, 25th, 50th, 75th and 95th percentiles of annual maximum tensile stress at the surface and in the middle. 338x243mm (600 x 600 DPI)
Sample of 90 mm vs. 215 mm beam. Near the surface the wider beam has much more wood in the tangential direction compared to the smaller one (which instead has a mixture of radial and tangential direction). This is one contributing explanation to why induced stresses differ. 92x141mm (180 x 180 DPI)
Pe Sample of 90 mm vs. 215 mm beam. Near the surface the wider beam has much more wood in the tangential direction compared to the smaller one (which instead has a mixture of radial and tangential direction). This is one contributing explanation to why induced stresses differ. 352x231mm (72 x 72 DPI)