Am J Transl Res 2016;8(3):1581-1592 www.ajtr.org /ISSN:1943-8141/AJTR0025246
Original Article Barcoded sequencing reveals diverse intrauterine microbiomes in patients suffering with endometrial polyps Rui-Li Fang1*, Lin-Xing Chen2*, Wen-Sheng Shu2, Shu-Zhong Yao1, Si-Wen Wang3, Yu-Qing Chen1 1 Department of Gynecology and Obstetrics, First Affiliated Hospital, Sun Yat-sen University, Guangzhou, Guangdong Province, China; 2State Key Laboratory of Biocontrol and Guangdong Key Laboratory of Plant Resources, College of Ecology and Evolution, Sun Yat-sen University, Guangzhou, Guangdong Province, China; 3Department of Vascular Surgery, First Affiliated Hospital, Sun Yat-sen University, Guangzhou, Guangdong Province, China. *Equal contributors.
Received January 30, 2016; Accepted February 29, 2016; Epub March 15, 2016; Published March 30, 2016 Abstract: Results of this study showed that the bacterial composition in vagina (V) greatly differed from intrauterine microbiome (I). Microbiomes were present in all intrauterine samples of healthy women (Group H (I)) and patients with endometrial polyps (EP) (including Group EP (I) and Group EP/chronic endometritis (CE) (I)). Indeed, the intrauterine bacteria population in Group EP/CE (I) were more diverse than those in Groups EP (I) and H (I). The result also confirmed the bacterial composition differences between vagina and uterus as well as the intrauterine microbiome alteration in the patients, compared to the healthy. Although bacteria of Proteobacteria, Firmicutes and Actinobacteria, dominated the intrauterine microbiome in all samples, however, proportions of Firmicutes from Group EP/CE (I) and Group EP (I) were much higher than that from Group H (I), in contrast, the proportions of Proteobacteria were far lower than the healthy. At the genus level, compared to Group H (I), it is found that proportions of Lactobacillus, Gardnerella, Bifidobacterium, Streptococcus, and Alteromonas were significantly higher, and that of Pseudomonas were significantly lower in Group EP/CE (I) or Group EP (I). In addition, lower proportions of Enterobacter and Sphingomonas and a higher proportion of Prevotella were also observed in Group EP/CE (I). In conclusion, uterine microbiomes between patients with EP and the healthy are significantly different and all the potentially important variation of uterine microbes may cause EP, but not definitively related to CE. Further experiments should be performed to test these relationships to endometritis occurrence. Keywords: Endometrial polyps; barcoded sequencing; endometritis
Introduction Endometrial polyps (EP) is a common gynecologic disease featured as a localized overgrowth of mucosa with a prevalence ranging from 7.8% to 34.9% [1, 2]. Clinically, it is often identified in patients with complaints of infertility or abnormal vaginal bleeding, or only observed in routine examination, such as transvaginal ultrasound. However, the etiopathogenesis of EP is not yet fully understood. Some factors such as chronic endometritis (CE), high hormonal influence, imbalance between proliferation and apoptosis, abnormal expression of ovarian steroid hormone receptor, and chromosomal abnormalities are thought to play important roles [3-5]. Previous studies [6, 7]
indicate a correlation between EP and chronic endometritis (CE), and CE was basically caused by a high load of organisms, including Ureaplasma urealyticum or a wide variety of common bacteria [8]. This suggestion may contribute to an assumption that overgrowth of endometrial tissue is related to continuous stimulation of biological inflammatory factors [6, 7]. Many studies have been performed to demonstrate the effect of bacteria on the development of CE [7, 9], but no much effect have been devoted to the relationship between bacteria and EP. Due to the possibility that microorganisms from the endocervical canal can be a contamination of passing through operative instrument, the
Barcoded sequencing reveals diverse intrauterine microbiomes Table 1. Clinical characteristics of women enrolled in the study. Items Age (years) BMI Gravidity Parity Age of menarche (years) Menstrual duration (days) Menstrual average cycle (days)
Group H (n = 10) 30.90 ± 1.56 21.04 ± 1.03 1.60 ± 0.45 0.30 ± 0.15 13.40 ± 0.45 6.00 ± 0.56 28.70 ± 1.16
Group EP/CE (n = 10) 35.2 ± 1.83 21.29 ± 0.99 1.50 ± 0.48 0.90 ± 0.41 13.50 ± 0.58 6.40 ± 0.40 29.70 ± 0.79
Group EP (n = 10) 34.4 ± 2.44 20.47 ± 0.67 0.80 ± 0.33 0.40 ± 0.16 13.80 ± 0.33 5.90 ± 0.41 27.60 ± 1.12
P value 0.289 0.811 0.371 0.491 0.746 0.663 0.370
Notes: Mean ± SE are shown. BMI: Body Mass Index.
argument that the high incidence of positive cultures from intrauterine samples is resulted from contamination [10] was raised by who believes that the endometrial cavity is sterile. Based on the traditional microbial research methods, previous studies [8, 11, 12] have limits to the culturable microbes that only comprise approximately 1% of the total microbiome. Additionally, these studies have failed to assess microbial diversity and community dynamics in the uterine cavity, resulting in a poor understanding of the association between intrauterine microbiota and uterine lesions. Recently, high throughput sequencing techniques based on 16S rRNA gene [13] have facilitated identifying unculturable, low abundance and unclassified microorganisms quickly and accurately. Most importantly, they are also able to analyze the microbial diversity and community dynamics. Here, we used this powerful technique to characterize the intrauterine microbial communities in patients suffering from endometrial polyps combined with or without chronic endometritis, and the intrauterine population difference compared to healthy donors. Materials and methods Patients and sample collection From August 2013 to January 2014, we enrolled 20 patients with endometrial polyps as the study group and 10 healthy women for the healthy controls (group H). Subjects eligible for the study group met the following criteria: 1) regular menstrual cycles, 2) diagnostic hysteroscopy and pathological results showing the presence of EP. Inclusion criteria for patients in the control group: 1) regular menstrual cycles, diagnostic hysteroscopy with endometrial biopsy and laparoscopy as part of their infertility
1582
diagnostic work-up prior to IVF, hysteroscopy and subsequent pathological results having shown no abnormality in the uterine cavities and abdominal cavity, 2) the healthy women recruited had male partners who were infertile and diagnosed with defective sperm function, such as asthenozoospermia, oligoasthenozoospermia, severe oligoasthenozoospermia and azoospermia, defined according to guidelines published by the World Health Organization. Exclusion criteria for patients in the control group and study group: 1) other intrauterine lesions such as intrauterine adhesions, submucosal myoma and uterine septum, 2) uterine myoma, endometriosis, ovarian tumor and hydrosalpinx, 3) abnormal sex hormone level, 4) abnormal leucorrhea, vaginitis and pelvic inflammatory disease. The study subjects were further divided into two groups based on pathologic and immunohistochemical results, in which ten patients with both EP and CE were classified as group EP/CE, and the others only with EP, as group EP. As shown in Table 1, clinical characteristics of these three groups are comparable. Meanwhile, samples from vagina were defined as Group V, and those from the uterine cavity as Group I, that is, microbial samples in Group H (V), Group EP/CE (V) and Group EP (V) were respectively collected from vagina, while Group H (I), Group EP/CE (I) and Group EP (I) were collected from the uterus of women in Group H, Group EP/CE and Group EP, respectively. The study was approved by the Medical Ethics Committees at the First Affiliated Hospital of Sun Yat-sen University (No.201464), and all women gave their written, informed consents. All 30 participants in Group H, Group EP/CE and Group EP were abstained from intercourse
Am J Transl Res 2016;8(3):1581-1592
Barcoded sequencing reveals diverse intrauterine microbiomes
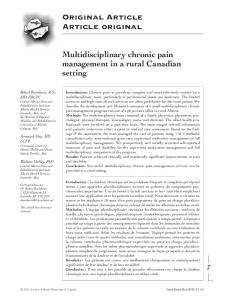
Figure 1. 16S rRNA gene analysis revealing taxonomic variations between uterine and vaginal microbiota and high diversity of the uterine microbiota. A. Bar plots showing the relative abundances of the 10 most abundant bacterial phyla in the vagina and uterine samples. B. Bar plots showing the relative abundances of the 10 most abundant bacterial groups at genus level. C. Rarefaction curves for communities sampled from the vagina and uterus (based on 100-3000 sequences per V4 data set; standard error shown). D. Communities clustered using PCoA based on the weighted UniFrac distance matrix. The percentage of variation explained by the plotted principal coordinates is indicated on the axes. Group V, vagina; Group I, uterus.
for three or more days and did not receive any antibiotic treatment or other medication, including taking a bath or vaginal douche within at least 3 weeks before sample collection. All samples were obtained in the first week after the participants’ menstrual period. Before vaginal disinfection, vaginal swab samples were collected during a speculum examination from the posterior fornix. Then after vaginal and cervical canal disinfection endometrial swabs and endometrial tissues from the uterine cavity were obtained. In order to minimize the risk of contamination, endometrial swabs with sleeves were inserted under visual control into the uterine cavity, taking care to avoid any contact with the vaginal walls. All the vaginal and endome1583
trial swabs were immediately frozen and stored at -80°C for DNA extraction and 16S rRNA profiling/characterization. The endometrial samples were fixed in formalin and embedded in paraffin for immunohistochemistry. Instead of classical tissue staining techniques, immunohistochemistry for the transmembrane heparin sulfate proteoglycan syndecan-1 (CD138) was designed to enhance the diagnostic accuracy of CE (Figure S1). The number of immunoreactive cells was identified under a high microscope magnification (400×) by two independent professional observers. The density of immunoreactive cells was determined in 10 nonoverlapping stromal areas and CE was Am J Transl Res 2016;8(3):1581-1592
Barcoded sequencing reveals diverse intrauterine microbiomes Table 2. AMOVA or ANOSIM on the bacterial strains isolated from intrauterine or vagina of healthy women and patients with EP Comparison H (V)-H (I)1
EP/CE (V)-EP/CE (I)1
EP (V)-EP (I)1
Source of Variation Among populations within regions Within populations Total Among populations within regions Within populations Total Among populations within regions Within populations Total
H (I)-EP/CE (I)-EP (I)2 H (I)-EP/CE (I)2 H (I)-EP (I)2 EP/CE (I)-EP (I)2
d.f. 1 18 19 1 18 19 1 18 19
F stat value/R-value 8.15
P value < 0.001*
5.17
< 0.001*
3.07
0.003*
0.31 0.51 0.35 -0.02
< 0.001* < 0.001* 0.009 0.578
Notes: 1AMOVA, 2ANOSIM. In all cases, the probability (P) of having a more extreme variance component thanthe observed value is P < 0.05.
diagnosed when five or more plasma cells presented [14, 15]. DNA extraction, bacterial 16S rRNA genes amplification and Miseq sequencing DNA was extracted from all swabs using TIANamp Swab DNA Kit (TIANGEN, Dusseldorf, Germany). To characterize vaginal (Group V) and intrauterine (Group I) microbial communities in ten healthy people (Group H), ten patients with both EP and CE (Group EP/CE) and ten patients with only EP (Group EP) (Table S1), the V4 region of a broad range of the bacterial and archaeal 16S rRNA genes was amplified [16] with a sample specific, 12-bp barcode sequences on the reverse primer [17] from the extracted DNA using the universal primer set of 515F/806R [18]. Roughly equal amounts of all amplicons were mixed in a single tube, and the amplicon mixture was gel-purified with an E.Z.N.A Gel Extraction Kit (Omega Bio-Tek, USA) and subsequently sequenced using the Illumina Miseq250 (Illumina, Inc. San Diego, California) [13]. DNA sequence data analysis and taxonomy The paired-end Miseq 250 bp reads sequenced from the 16S rRNA gene (V4 region) PCR products, were firstly quality controlled using inhouse perl scripts. Paired-end reads with one or more ambiguous bases were removed, and
1584
the retained paired-end reads were trimmed at the 3’ end to eliminate the continuous bases with a quality score < 20. Then the quality paired-end reads were combined using the “make. contigs” command in Mothur (version 1.35.0) [19] to get the full V4 region of 16S rRNA genes. The obtained 16S rRNA gene V4 region sequences were processed with the QIIME software (version 1.8.0) [20]. The sequences were firstly assigned to each sample based on the 12-bp barcoding sequences on the primer 806R, and those sequences with length shorter than 240 bp or longer than 260 bp, or with 8 bp long homopolymer were removed. Potential Chimeric sequences were detected using the software of Uchime [21]. Ultimately, we obtained an average of 9641 ± 777.8 reads per sample with a total of 578495 sequences (Table S1), for thirty intrauterine and thirty vaginal samples. Reads sharing 97% or higher sequence similarity were grouped into operational taxonomic units (OTUs) [20], and taxonomic assignment of representative sequences was performed using the Ribosomal Database Project (RDP) Classifier [22] a minimum confidence threshold of 80%. As a result, over 98% of the OTUs could be assigned to a taxonomic group (phylum), and over 50% could be identified at the genus level. In order to control differences in coverage, OTUs were randomly sub-sampled to 3000 sequences per sample for further analysis. We employed rarefaction curves of observed species (i.e., OTUs)
Am J Transl Res 2016;8(3):1581-1592
Barcoded sequencing reveals diverse intrauterine microbiomes Statistical analyses Statistical analyses were performed with Sigma Stat statistical software (version 13.0 for windows). The Kolmogorov-Smirnov test was used to test for data normality. The data were presented in the study as means with standard deviations. Differences in the number of taxa detected in EP and healthy women were assessed with the use of the Mann-Whitney U test. The data were compared by the Student t test, the Mann-Whitney test, or the Kruskal-Wallis analysis of variance on ranks, followed by Dunn’s tests to adjust for multiple comparisons as appropriate. P < 0.05 was considered an indication of statistical significance. Results
Figure 2. 16S rRNA gene analysis indicating lower diversity in Group H (I) and high diversity in the Groups EP/CE (I) and EP (I). A. Rarefaction curves for intrauterine microbiome from Groups H (I), EP/CE (I) and EP (I). B. Shannon index rarefaction curves for intrauterine microbiome from Groups H (I), EP/CE (I) and EP (I). These data were based on 100-3000 sequences per V4 data set. The bars showed the standard errors of observed species and Shannon index of the sample for each group.
to compare richness and Shannon diversity indices to compare the species diversity (alpha diversity) among different communities. In order to visualize differences in overall bacterial community composition, we employed the principal coordinates analysis (PCoA) based on weighted UniFrac distance. Moreover, analysis of Molecular Variance (AMOVA) or the analysis of similarities (ANOSIM) function based on the weighted UniFrac distance matrix was also conducted to test the differences in beta diversity between or among treatment groups. The sequences were deposited in the European Nucleotide Archive (ENA) database under the accession number of PRJEB9626.
1585
Significant differences between vaginal and intrauterine bacterial populations
To clearly characterize the different bacteria population in females’ vagina and uterus, we performed 16S rRNA sequencing, targeting V4 variable region. Our results showed that Firmicutes (65.4%) was the most abundant phylum and Actinobacteria (23.1%) was the second in the vaginal communities; however, compared with these two species in vagina, the mean proportion of them from intrauterine communities were lower, only at 35.1% and 8.9%, respectively (Figure 1A). Actually, the most abundant phylum in uterine cavity (Group I) was Proteobacteria which accounted for 45.3% (Figure 1A). At the genus level (Figure 1B and Table S2), all vaginal bacterial communities were dominated by Lactobacillus (55.1%), followed by Gardnerella (18.5%) and Streptococcus (6.3%); however, intrauterine bacterial communities were domi-
Am J Transl Res 2016;8(3):1581-1592
Barcoded sequencing reveals diverse intrauterine microbiomes
Figure 3. Communities clustered using Principal Component Analysis (PCoA) based on the weighted UniFrac distance matrix. PC1 and PC2 are plotted on x and y axes. Each point is equal to a sample colored by Groups H (I), EP/CE (I) and EP (I). The proportion of variation illustrated by the plotted Principal Component is indicated on the axes. The samples in Group H (I) can be separated distinctly from other samples in Groups EP/CE (I) and EP (I).
nated by Lactobacillus (26.0%), Enterobacter (16.3) and Pseudomonas (12.6%). In additon, rarefaction curves based on a 97% cluster similarity showed the more number of OTUs in the intrauterine samples than those in the vaginal samples (Figure 1C). Furthermore, we applied UniFrac which is a phylogeny-based metric to evaluate the differences in overall bacterial community composition. A smaller UniFrac distance indicates that two communities are more similar, consisting of lineages sharing a common evolutionary history. As shown in Figure 1D, we observed that clustering was associated with sampling location. We demonstrate that the intrauterine microbiome is significantly different with the vaginal microbiome (AMOVA, P < 0.001, Table 2), indicating that swabs sampled in the uterine cavity were less likely to be contaminated by the vagina than expected. Table S2 shows most of genera in the samples from the vagina and uterine cavities. Meanwhile, some taxa failed to be assigned into any genus/ phylum with a confidence level higher than 50%, suggesting they have not been reported before in vagina and uterine samples. Bacterial species richness and diversity between Groups H (I), EP/CE (I) and EP (I) To investigate the bacterial species richness and diversity during different intrauterine, we 1586
subsequently carried out analysis of alpha diversity of the microbes. Rarefaction curves (Figure 2) show that intrauterine communities varied markedly in their level of bacterial diversity. Surprisingly, we found that the uteruses of healthy women are not sterile and actually harbor diverse kinds of bacteria. Moreover, the uterine cavities from patients with EP and CE harbors more phylotypes and have a significantly higher Shannon diversity index value than those only with or without EP, given our beta diversity analysis (Table S3). Bacterial community composite differences between Groups H (I), EP/CE (I) and EP (I)
We assessed differences in overall bacterial community composition using a phylogenybased metric, UniFrac. The UniFrac-based principal coordinates analysis (PCoA, Figure 3) showed no apparent clustering among uterine communities. It seems that variation among the uterine communities is not obvious. However, for further analysis about the shared community structure of uterine cavities significantly associated with EP, an ANOSIM (analysis of similarity) test was conducted. The analysis shows that significant differences were present between Groups H (I) and EP/CE (I) (P < 0.001, Table 2) or Groups H (I) and EP (I) (P=0.009 < 0.05, Table 2), indicating that there is a significant relationship between EP and variation of intrauterine bacteria. Bacterial composition and community structure at the phylum and genus level in Groups H (I), EP/CE (I) and EP (I) To further clarify the imperative differences present in intrauterine microbiotas of these 30 individuals, we analyzed bacterial composition and community structure at the phylum and genus in Groups H (I), EP/CE (I) and EP (I). Figure 4A shows that these three Groups are all dominated by Proteobacteria (0.729 ± 0.019, 0.343 ± 0.010 and 0.287 ± 0.006), Firmicutes (0.139 Am J Transl Res 2016;8(3):1581-1592
Barcoded sequencing reveals diverse intrauterine microbiomes
Figure 4. Composition of the top 10 taxa at the (A) phylum and (B) genus level for all intrauterine samples (Groups H (I), EP/CE (I), EP (I)). Relative abundance (percentage) of the 10 most abundant bacterial phyla (A) or genera (B) across 30 intrauterine microbiomes from healthy women (Group H (I)), EP patients with (Group EP/CE (I)) and without CE (Group EP [I]), based on 16S rRNA high throughput sequencing.
Table 3. Differential relative abundance of the 11 most abundant taxa in these uterine communities among healthy women (Group H), patients with EP and CE (Group EP/CE) and patients with unique EP (Group EP) Genus Lactobacillus Enterobacter Pseudomonas Gardnerella Bifidobacterium Streptococcus Prevotella unclassifid Enterobacteriaceae Alteromonas Euryarchaeota Sphingomonas
P value2 H:EP/CE H:EP EP/CE:EP 0.062 ± 0.005 0.332 ± 0.013 0.386 ± 0.017 0.000 0.000 0.529 0.334 ± 0.020 0.072 ± 0.002 0.083 ± 0.002 0.043 0.089 0.315 0.235 ± 0.013 0.073 ± 0.002 0.070 ± 0.002 0.011 0.015 0.529 0.035 ± 0.003 0.069 ± 0.006 0.055 ± 0.001 0.043 0.023 0.912 0.006 ± 0.000 0.014 ± 0.001 0.048 ± 0.017 0.019 0.005 0.481 0.006 ± 0.000 0.011 ± 0.000 0.026 ± 0.003 0.001 0.000 0.023 0.008 ± 0.002 0.013 ± 0.002 0.013 ± 0.001 0.029 0.105 0.912 0.016 ± 0.000 0.010 ± 0.000 0.009 ± 0.000 0.004 0.001 0.190 0.004 ± 0.001 0.014 ± 0.001 0.011 ± 0.001 0.003 0.019 0.739 0.005 ± 0.001 0.010 ± 0.000 0.009 ± 0.001 0.011 0.019 0.912 0.008 ± 0.001 0.006 ± 0.000 0.004 ± 0.000 0.043 0.143 0.280 Group H1 (n = 10)
Group EP/CE (n = 10)
Group EP (n = 10)
Notes: 1The average relative abundance of genus in the three groups were shown. 2The P value was determined by KruskalWallis test of the relative abundance of a given genus between two groups.
± 0.010, 0.430 ± 0.014 and 0.483 ± 0.014) and Actinobacteria (0.053 ± 0.004, 0.098 ± 0.007 and 0.117 ± 0.008) at the phylum level; however, relative abundance of bacteria-related sequences in different groups may shift significantly. Compared with Group H (I) (Firmicutes: 13.94% and Proteobacteria: 72.90%), the relative abundance of Firmicutes sequences was significantly higher in the uterine communi-
1587
ties of Groups EP/CE (I) and EP (I) (43.00% and 48.27%; P < 0.05), whereas that of Proteobacteria sequences was lower markedly (34.30% and 28.73%; P < 0.05). At the genus level (Figure 4B), the most abundant OTUs were assigned to Lactobacillus (Groups EP/CE and EP: 33.21% and 38.64%), Enterobacter (7.17% and 8.34%), Pseudomonas
Am J Transl Res 2016;8(3):1581-1592
Barcoded sequencing reveals diverse intrauterine microbiomes (7.32% and 7.02%), Gardnerella (6.91% and 5.50%) and Desulfosporosinus (5.41% and 4.23%) from Groups EP/CE and EP, while the most abundant genus detected in Group H (I) was Enterobacter (33.37%), followed closely by Pseudomonas (23.52%), Lactobacillus (6.17%), Desulfosporosinus (4.25%), Ralstonia (4.21%) and Gardnerella (3.54%). To further test difference in microbiomes between Groups H (I), EP/ CE (I) and EP (I), Kruskal-Wallis test was required. Table 3 shows that among the 20 most abundant taxa presented in the communities, Groups EP/CE (I) and EP (I) were composed of more Lactobacillus, Bifidobacterium, Gardnerella, Streptococcus, Alteromonas and decreased Pseudomonas when compared with Group H (I). Meanwhile, the mean proportion of Enterobacter and Sphingomonas was lower and that of Prevotella was higher in Group EP/ CE (I) when compared to Group H (I) (P0.1%) in the samples of in the six groups Genus Lactobacillus Enterobacter Pseudomonas Gardnerella Streptococcus Prevotella Bifidobacterium Desulfosporosinus Ralstonia Veillonella Atopobium Thalassospira Alteromonas Megasphaera Vibrio Cupriavidus
2
Group H (V) Group H (I) Group EP/CE (V) Group EP/CE (I) Group EP (V) Group EP (I) 60.93% 6.23% 56.83% 33.44% 47.48% 38.86% 3.27% 33.41% 1.08% 7.23% 4.47% 8.40% 2.44% 23.56% 0.92% 7.39% 1.78% 7.06% 15.30% 3.55% 23.42% 6.95% 16.93% 5.54% 1.32% 0.59% 3.08% 1.06% 14.55% 2.63% 6.28% 0.83% 2.64% 1.31% 0.86% 1.27% 0.97% 0.58% 5.74% 1.46% 1.01% 4.82% 0.40% 4.33% 0.41% 5.45% 0.61% 4.28% 0.12% 4.26% 0.09% 2.67% 0.13% 1.57% 0.34% 0.21% 0.19% 0.33% 3.83% 0.46% 1.81% 0.58% 0.46% 0.42% 0.57% 0.44% 0.06% 0.79% 0.05% 1.69% 0.07% 1.23% 0.07% 0.45% 0.06% 1.44% 0.06% 1.09% 1.20% 0.52% 0.08% 0.13% 0.12% 0.13% 0.05% 0.74% 0.04% 1.16% 0.06% 0.73% 0.02% 0.92% 0.02% 0.61% 0.03% 0.44%
Barcoded sequencing reveals diverse intrauterine microbiomes Actinomyces Acinetobacter Sphingomonas Ureaplasma Marinobacter Sneathia Klebsiella Pelomonas Muricauda Corynebacterium Stenotrophomonas Erythrobacter Dialister Escherichia Bacillus Staphylococcus Mobiluncus Singulisphaera Halomonas Methylobacterium Loktanella Gramella Fusobacterium Anaerococcus Thermus Porphyromonas Azorhizophilus Aquabacterium Enhydrobacter Opitutus Tolumonas Blastopirellula Campylobacter Gemmata Ktedonobacter Thiothrix Planctomyces Bacteroides Pseudoalteromonas Howardella Simkania Anaeroglobus Thermogymnomonas Methylophaga Dechloromonas Finegoldia Peptoniphilus Deinococcus Kangiella
0.04% 0.01% 0.03% 0.05% 0.03% 0.55% 0.09% 0.02% 0.01% 0.06% 0.00% 0.01% 0.38% 0.03% 0.02% 0.03% 0.32% 0.01% 0.01% 0.02% 0.01% 0.01% 0.00% 0.03% 0.00% 0.03% 0.18% 0.01% 0.00% 0.01% 0.03% 0.01% 0.02% 0.01% 0.01% 0.08% 0.02% 0.00% 0.00% 0.02% 0.00% 0.01% 0.00% 0.00% 0.01% 0.06% 0.08% 0.00% 0.01%
0.03% 0.10% 0.77% 0.03% 0.24% 0.13% 0.53% 0.51% 0.19% 0.06% 0.02% 0.22% 0.14% 0.18% 0.17% 0.03% 0.16% 0.16% 0.11% 0.19% 0.09% 0.07% 0.02% 0.04% 0.04% 0.02% 0.04% 0.10% 0.06% 0.07% 0.15% 0.06% 0.01% 0.11% 0.07% 0.14% 0.03% 0.01% 0.05% 0.00% 0.10% 0.02% 0.06% 0.05% 0.08% 0.06% 0.04% 0.05% 0.02%
0.05% 0.02% 0.04% 0.16% 0.02% 0.03% 0.04% 0.02% 0.01% 0.45% 0.01% 0.02% 0.06% 0.03% 0.02% 0.03% 0.10% 0.01% 0.01% 0.01% 0.01% 0.00% 0.04% 0.20% 0.00% 0.08% 0.14% 0.01% 0.00% 0.01% 0.02% 0.01% 0.08% 0.01% 0.00% 0.05% 0.02% 0.02% 0.00% 0.02% 0.00% 0.02% 0.00% 0.01% 0.01% 0.07% 0.10% 0.00% 0.01%
0.06% 0.77% 0.66% 0.07% 0.56% 0.04% 0.17% 0.46% 0.47% 0.23% 0.44% 0.39% 0.09% 0.27% 0.36% 0.21% 0.07% 0.25% 0.30% 0.29% 0.25% 0.21% 0.04% 0.18% 0.19% 0.19% 0.14% 0.17% 0.16% 0.16% 0.07% 0.15% 0.14% 0.14% 0.12% 0.12% 0.13% 0.03% 0.13% 0.01% 0.12% 0.04% 0.12% 0.11% 0.11% 0.07% 0.11% 0.11% 0.11%
0.87% 0.03% 0.04% 0.72% 0.04% 0.01% 0.10% 0.02% 0.01% 0.22% 0.01% 0.01% 0.14% 0.06% 0.02% 0.32% 0.06% 0.01% 0.01% 0.01% 0.01% 0.01% 0.02% 0.15% 0.00% 0.01% 0.14% 0.02% 0.00% 0.01% 0.04% 0.01% 0.02% 0.01% 0.01% 0.08% 0.03% 0.00% 0.00% 0.13% 0.00% 0.03% 0.00% 0.00% 0.01% 0.11% 0.07% 0.00% 0.00%
Notes: The relative abundance of genus were calculated as the average value of samples in the same group.
3
0.06% 0.14% 0.39% 0.14% 0.40% 0.03% 0.18% 0.21% 0.23% 0.32% 0.02% 0.33% 0.09% 0.37% 0.20% 0.08% 0.06% 0.31% 0.21% 0.13% 0.19% 0.15% 0.20% 0.13% 0.05% 0.07% 0.10% 0.07% 0.05% 0.09% 0.06% 0.12% 0.02% 0.13% 0.14% 0.09% 0.13% 0.13% 0.09% 0.01% 0.05% 0.12% 0.05% 0.07% 0.06% 0.08% 0.08% 0.06% 0.08%
Barcoded sequencing reveals diverse intrauterine microbiomes Table S3. Microbial biodiversity of the six sample groups revealed by Miseq sequencing Group OTUs Chao1 Shannon Simpson Group H (V) 176 514 2.78 0.61 Group EP/CE (V) 178 526 2.66 0.60 Group EP (V) 186 549 2.78 0.60 Group H (I) 331 789 4.07 0.77 Group EP/CE (I) 501 1112 5.66 0.93 Group EP (I) 454 1036 5.19 0.88 Notes: OTUs were defined at 97% sequence identity level. For each sample, 3000 sequences were randomly selected to calculate the number of the OTUs, chao1, Shannon index and simpson index, the average values of the same group were then calculated to represent the value of the corresponding group.
4