DERLEME/REVIEW
Optical Coherence Tomography-A New Diagnostic Tool to Evaluate Axonal Degeneration in Multiple Sclerosis: A Review Multipl Sklerozda Aksonal Dejenerasyon Gelişimini Değerlendirmede Yeni Bir Yöntem: Optik Koherans Tomografi Üzerine Bir Derleme
Nilüfer Kale, Eric Eggenberger Michigan State University, Nöro-oftalmoloji Bölümü, Michigan, Amerika Birleşik Devletleri
Turk Norol Derg 2010;16:121-126
ÖZET Multipl skleroz genifl bir klinik bulgu spektrumu olan, inflamatuvar demiyelinizan santral sinir sistemi hastal›¤›d›r. Multipl skleroz lezyonlar› s›kl›kla optik sinirleri, periventriküler ak maddeyi, beyin sap›, spinal kord ve serebellumu etkiler. Multipl skleroz geliflim mekanizmas›, hastalar aras›nda ve hastal›k dönemlerine göre kompleks ve heterojen özellik göstermektedir. Günümüze kadar, multipl skleroz kesin tan› ve prognozuna yönelik spesifik yöntemler bulunmamaktadir. Aferent görsel yol, retinadan primer görsel kortekse uzan›r ve multipl sklerozda en s›k etkilenen alanlardan biridir (%94-99). Etkilenen optik sinirlerde gözlenen patolojik bulgular aras›nda inflamasyon, demiyelinizasyon, akson ve retinal sinir liflerinin (RNFL) hasarlanmas› ve RNFL incelmesi bulunmaktad›r. RNFL miyelinsiz aksonlardan oluflur, RNFL kal›nl›¤›n›n de¤erlendirilmesi akson hasar›n› yans›tarak hastal›k progresyonunun de¤erlendirilmesinde yard›mc› olur. Aferent görsel yolun klinik, görüntüleme ve elektrofizyolojik metodlarla de¤erlendirilmesi multipl skleroz patofizyolojisinin anlafl›lmas› ve hastal›k prognozunun de¤erlendirilmesinde önem tafl›maktad›r. Optik koherans tomografi RNFL kal›nl›¤›n› ölçerek multipl sklerozun santral sinir sistemi üzerine etkilerini de¤erlendiren, pratik uygulan›m› olan, tekrarlanabilir bir metottur. Bu derleme ile optik koherans tomografinin multipl skleroz tan›, hastal›k prognozu ve tedavi yaklafl›mlar›n›n etkilerinin de¤erlendirilmesindeki yeri tart›fl›lacakt›r. Anahtar Kelimeler: Multipl skleroz, optik nörit, tomografi, optik koherans.
121
Kale N, Eggenberger E.
Optical Coherence Tomography in Multiple Sclerosis
ABSTRACT Optical Coherence Tomography-A New Diagnostic Tool to Evaluate Axonal Degeneration in Multiple Sclerosis: A Review Nilüfer Kale, Eric Eggenberger Department of Neuro-ophthalmology, Michigan State University, Michigan, USA
Multiple sclerosis is an inflammatory demyelinating disorder of the central nervous system with a wide spectrum of clinical signs and symptoms. Multiple sclerosis lesions have a predilection for the optic nerves, periventricular white matter, brainstem, spinal cord, and cerebellum. The mechanisms responsible for multiple sclerosis are complex and heterogeneous across patients and disease stages. No specific markers exist for the definite diagnosis and prognosis of multiple sclerosis. The afferent visual pathway, which extends from the retina to the primary visual cortex including the optic nerve, is one of the most commonly affected sites in multiple sclerosis (94-99%). Pathology of affected optic nerves exhibits inflammation, demyelination, gliosis, axonal injury, and thinning of the retinal nerve fiber layer (RNFL). The RNFL is composed of unmyelinated axons, and measuring RNFL thickness is a viable method to monitor axonal loss reflecting disease progression. Optical coherence tomography is a noninvasive and reproducible tool in assessing the impact of multiple sclerosis on the thickness of the RNFL. Assessment of the afferent visual pathway using clinical, imaging and electrophysiological methods provides insights into the pathophysiology of multiple sclerosis and may also serve a prognostic role in multiple sclerosis. Key Words: Multiple sclerosis, optic neuritis, tomography, optical coherence.
Multiple sclerosis (MS) is an inflammatory demyelinating disorder of the central nervous system (CNS) with a wide spectrum of clinical signs and symptoms (1). The mechanisms responsible for MS are complex and heterogeneous across patients and stages of the disease, and no specific markers exist for the definite diagnosis and prognosis of MS. MS pathology is characterized by inflammation, axonal loss and neurodegeneration; demyelinated lesions are observed not only in the white matter but also in the cortex and deep gray matter nuclei, affecting additionally the normal-appearing white matter, leading to diffuse injury (2). MS lesions have a predilection for the optic nerves, periventricular white matter, brainstem, spinal cord, and cerebellum (3). The afferent visual pathway, which extends from the retina to the primary visual cortex including the optic nerve, is one of the most commonly affected sites, and optic nerve lesions are reported in 94-99% of MS autopsy cases (3). Pathology exhibits inflammation, demyelination, gliosis, axonal injury, and atrophy and thinning of the retinal nerve fiber layer (RNFL) and ganglion cell layer as a reflection of the disease process (2,3). MS diagnosis and prognosis require integrating clinical findings with the assessment of magnetic resonance imaging (MRI) and other paraclinical methods, and elimination of alternative disorders that might mimic MS (4,5). To date, biomarkers or imaging techniques remain insufficient to estimate prognosis and provide evidence for development of neuronal loss and atrophy. A study by Whiting et al. suggested histopathology as the gold standard for diagnosis; however, biopsy and autopsy data are rarely available and vary with morbidity (6).
122
Assessment of the afferent visual pathway also provides insights into the pathophysiology of the demyelinating lesion and shows potential in investigating new therapies in optic neuritis and MS. Imaging the visual pathway including the optic nerves may reveal hyperintense lesions on T2-weighted images and gadolinium enhancement during an acute ON episode. MRI-quantified atrophy of the optic nerve may indicate the degree of axonal loss. Magnetization transfer ratio (MTR), diffusion tensor imaging (DTI) and functional MRI have been utilized to assess different aspects of the MS outcomes. Visual function can also be assessed by Sloan contrast acuity, Farnsworth-Munsell 100-hue color vision tests, visual acuity testing, Humphrey perimetry, visual evoked potentials (VEPs), optical coherence tomography (OCT), scanning laser polarimetry, and confocal scanning laser ophthalmoscopy (4,7). These techniques provide detailed quantitative information on different aspects of vision or help to identify conduction delay, reflecting demyelination, and quantify RNFL thickness (7-9). The aim of this review was to provide insights into the utilization of OCT in patients with MS and further, to discuss OCT as a valuable tool in diagnosing and monitoring the disease course in MS. Pathology of Multiple Sclerosis and Axonal Degeneration Neuronal injury and axonal loss occur in MS during the disease process, and the extent of axonal injury correlates with the degree of inflammation that leads to permanent disability (1,2). Neuropathology studies have tried to yield novel insights regarding potential mechanisms in-
Turk Norol Derg 2010;16:121-126
Multipl Sklerozda Optik Koherans Tomografi
volved in lesion formation, the pathologic substrate of disability; however, the pathology behind the progressive disease stage leading to further atrophy remains unexplained. One possible explanation is that in the progressive stage, inflammation becomes trapped within the brain compartment behind a closed or repaired blood–brain barrier (7). Lymph follicle-like structures are formed in the meninges and large perivascular spaces and are associated with rapid disease progression and profound brain damage (10). It has also been suggested that chronic inflammation creates a microenvironment favoring the homing and retention of inflammatory cells within this compartment. Another interesting aspect of inflammation in MS is the difference in the pattern of T-cell, B-cell and plasma cell infiltration (2). T-cell and B-cell infiltrates correlate with demyelinating activity, whereas plasma cell infiltrates are most pronounced in patients with progressive disease stage, which may also explain the persistence of oligoclonal bands in the cerebrospinal fluid in chronic brain inflammation (7) (Figure 1). Axonal transection may cause Wallerian degeneration even in acute MS lesions, leading to subsequent axonal degeneration, and axonal loss contributes to brain atrophy (3,4). The pathophysiology of the visual system involves different pathways and may be affected as foci of primary demyelination, as a consequence of Wallerian degeneration secondary to lesions of the connecting white matter tracts or as a result of trans-synaptic degeneration due to lesions in an anatomically linked remote region. Imaging and Para-Clinical Assessment of Multiple Sclerosis MS-related injury in optic nerves is evidenced clinically in chromatic contrast sensitivity, VEP, visual field, OCT, temporal frequency discrimination, and pupil light reflex abnormalities (4). It is important to capture neuronal injury, and a review suggested three primary outcomes in MS to assess the development of progression, atrophy and neuroprotective measures in MS: 1. Changes in whole-brain volume to gauge general cerebral atrophy; 2. T1 hypointensity and MTR to monitor the evolution of lesion damage; and 3. OCT findings to evaluate the anterior visual pathway (3). Assessing the afferent visual pathway using clinical, imaging and electrophysiological methods not only provides insights into the pathophysiology of MS but also aids in estimating the prognostic factors of MS. Optical Coherence Tomography and Multiple Sclerosis OCT is a noninvasive and reproducible diagnostic tool to assess the thickness of the RNFL. The RNFL is com-
Turk Norol Derg 2010;16:121-126
Kale N, Eggenberger E.
posed of unmyelinated axons, and measuring RNFL thickness is a viable method to monitor axonal loss, reflected as disease progression (8,9,11). RNFL thickness correlates with visual acuity, visual field, low-contrast letter acuity, contrast sensitivity, color vision, and pupil reactions (12-17). Studies have also shown a possible correlation between the optic nerve area evaluated by MRI, VEP amplitudes, OCT measures, neurological impairment scores, disease duration, and clinical course (8,16,17). A study comparing RNFL thickness values obtained with imaging devices against measurements obtained histologically in a human eye showed that imaging data appeared qualitatively similar when compared to the histologically derived data (18). The Physics of Optical Coherence Tomography OCT measures the echo time delay and intensity of back-reflection of light from different structures in the eye. An interferometer is used to measure the light reflected from a reference arm and from structures within the eye, and when back-reflected light from these structures has traveled exactly the same distance, interference is produced and measured by the interferometer. This provides information about the distance traveled, creating a cross-sectional image of the retina. The signal intensity of the back-reflected light is used to differentiate the layers in the retina. Studies have shown that OCT had good reproducibility (8,9); however, there are certain factors that can influence OCT scan acquisition (9). The factors that have an impact on the assessment include scan displacement, signal strength, eye movements, pupil size, the presence of cataracts, and contact lenses (19-22). Scan centering on the optic disc is an important factor when interpreting OCT results. Scan displacement can significantly affect quadrant thicknesses especially in the vertical quadrants, but average RNFL may not be affected (19). Another factor to consider when assessing scan quality is the signal strength of the scan (20). The signal strength represents the image quality; < 5 is poor quality, while average signal strength ≥ 9.5 is good. Although the OCT manual recommends a minimal signal of 5, there has not been a consensus as to what strength is “adequate”; however, the majority of the studies require signal strength of 7. Although most patients in clinics undergo OCT testing after they have been dilated, studies have shown that pupil size is often an insignificant factor, especially if at least 3 mm (21). Lens opacities can lead to underestimation of RNFL thickness. Contact lenses can decrease the signal strength and it is important to note these factors to optimize the measurement techniques (22). Because of its potential role in defining axonal loss and assessing longitudinal changes in the RNFL, a multidisciplinary expert panel on the utility of OCT in clinical practice suggested that:
123
Kale N, Eggenberger E.
Optical Coherence Tomography in Multiple Sclerosis
Microns
143
300 S
200 100
51
0
A) 0
20
40
TEMP
60
80
100
SUP
120
140
160
NAS
180
200
INF
220
T
N I
240
TEMP
131
Microns 300
227 S
200 100
B)
113
214
0
0
20
40
TEMP
60
80
100
SUP
120
140
160
NAS
180
200
INF
220
N
T
75
I
240
TEMP
201
Microns
132
300 S
200 100
51
0
C)
0
20
40
TEMP
60
80
100
SUP
120
140
160
NAS
180
200
INF
220
T
N
86
T
25
I
240
TEMP
117
Microns
95
300 S
200 100
46
0 D)
0
TEMP
20
40
60
80
100
SUP
120
140
160
NAS
180 INF
200
220
240
TEMP
N I 69
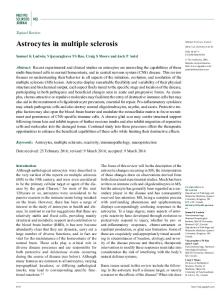
Figure 1. OCT bands are related to specific retinal layers and OCT measures the overall RNFL thickness. The colors represent the normal distribution percentiles and the values are categorized as: 100-95% white layer, 95-5% green layer, 1-5% yellow layer, 0-1% red layer. The superior (S), inferior (I), nasal (N) and temporal (T) RNFLs are also measured individually. Here we present the OCT evalation of an MS patient who presented with ON OS revealed normal OCT measures OD (A) and elevated RNFL OS (B). The six month follow-up revealed normal results OD (C) and decrased RNFL OS (D).
1. OCT is valid and reproducible; 2. OCT has yielded some important limited data in some cross-sectional studies with ON and MS; 3. More studies are required to correlate OCT results with other measures of MS disease activity; and
124
4. After correlation with these other measures and upon agreement of standardized technical and statistical methods, OCT may evolve into a important primary or secondary outcome metric for MS clinical trials and patient care (12).
Turk Norol Derg 2010;16:121-126
Kale N, Eggenberger E.
Multipl Sklerozda Optik Koherans Tomografi
Clinical Multiple Sclerosis Subtypes and Optical Coherence Tomography To date, it is not clear whether patterns of RNFL thickness loss are sufficiently different in MS compared to other diseases. A large cross-sectional study analyzed the patterns of axonal loss of retinal ganglion cells in MS patients with and without a history of ON compared to patients with glaucomatous disease and healthy controls. OCT revealed significant average and quadrant RNFL loss in both MS and glaucoma patients compared to healthy controls (p< 0.01). The age- and gender-adjusted average and quadrant RNFL thickness did not differ significantly between the MS and other patients; however, RNFL thinning was significantly worse in MS/ON versus MS/nonON eyes, with the highest degree of RNFL loss in the temporal quadrant (p< 0.001) (23). Costello et al. investigated the relationship between RNFL values and the subsequent risk of developing clinically definitive MS (CDMS) after clinically isolated syndrome (CIS) (13). Although the difference in RNFL thickness was not significant between CDMS and controls two years following presentation of ON, progressive RNFL thinning was more apparent in affected eyes of CDMS patients as opposed to affected eyes of non-MS patients. A study showed the relation between total MS lesion load and RNFL thickness and suggested that these modalities were predictive of visual function impairment as a disease outcome (24). Two studies compared CIS, relapsing-remitting MS (RRMS) and secondary progressive MS (SPMS) and compared the extent of RNFL loss among MS subtypes. Both studies showed that RNFL thinning was greater in progressive MS than in other subtypes. Costello et al. noted that the trend toward a decrease in average RNFL in SPMS versus both RRMS and CIS was only significant in eyes without prior ON (8,13). Another study failed to show differences between PPMS and relapsing forms of MS subgroups; however, this may be due to the duration and power of the study. RNFL thickness was reduced in eyes with previous ON, and Expanded Disability Status Scale (EDSS) correlated significantly with visual and OCT measures (25). A study quantified changes in the RNFL of patients with MS over a one-year period and assessed visual acuity and color vision. The study utilized OCT, scanning laser polarimetry (GDx) and VEP to detect axonal loss. A statistically significant difference was observed between the two OCT examinations for the overall mean and inferior RNFL thickness, as well as for the temporal-superior-nasal-inferiortemporal average standard deviation provided by GDx. Axonal loss in the optic nerve of patients with MS was greater than that expected in healthy subjects, regardless of the presence of a previous ON (26). During the disease course, the optic nerve may be affected structurally rather than functionally, reflecting silent lesions. Subclinical ganglion cell loss may be detected in MS patients with normal visual function, and OCT is a
Turk Norol Derg 2010;16:121-126
useful technique to identify this silent ongoing damage (27). Quantification of RNFL provides insights regarding the impact of disease, and effectiveness of long-term MS treatment can also be assessed by measuring RNFL changes over time (24). OCT may also be a valuable tool to evaluate RNFL loss not only in MS but also in neuromyelitis optica (NMO) (28). NMO is part of the idiopathic inflammatory demyelinating disorder spectrum and characteristically presents with severe ON and myelitis (29-31). OCT seems to be a promising new method of quantifying RNFL and evaluates axonal thickness, and it can be further utilized as a reliable outcome measure to assess axonal loss in demyelinating disorders. CONCLUSION Axonal loss is a prominent feature of MS, and axonal transection has been demonstrated in MS lesions. Axonal transection occurs even in acute lesions. As a part of the disease process, the optic nerve is also involved during an acute ON attack. A close correlation was observed between the OCT and the retinal layers seen by light microscopy (32). Reduced RNFL thickness may be a potentially useful MS outcome and serve as a surrogate marker for MS disability. OCT measures of RNFL thickness may also improve assessment of treatment efficacy and effects of diseasemodifying therapies on visual dysfunction in patients with MS. Measurement of RNFL can be utilized as a model to advance our understanding of the mechanisms of axonal and neurodegeneration and the corresponding impact of these processes upon the pathophysiology of MS and related disorders. OCT seems to be a promising technique to investigate the pathological process of the optic nerve and the visual system involvement in MS. Its ease of use, low variability, noninvasive nature, and relatively low cost make it useful for assessing several clinical situations (33). As OCT systems are developed and utilized for serial analysis for monitoring of disease progression, these assessments may correlate with accumulation of disability, and ascertain the effects of candidate neuroprotective therapies (34). A combination of advanced neuroimaging, neuropathological, immunological, and genetic expression tools will yield greater insights regarding the pathogenic mechanisms of neuronal degeneration in MS. Understanding the disease process would lead to novel pharmacotherapeutic approaches targeting the global pathology of the disease (35).
REFERENCES 1.
Lassmann H, Brück W, Lucchinetti CF. The immunopathology of multiple sclerosis: an overview. Brain Pathol 2007;17:210-8.
2.
Hu W, Lucchinetti CF. The pathological spectrum of CNS inflammatory demyelinating diseases. Semin Immunopathol 2009;31:439-53.
125
Kale N, Eggenberger E.
Optical Coherence Tomography in Multiple Sclerosis
21. Savini G, Zanini M, Barboni P. Influence of pupil size and cataract on retinal nerve fiber layer thickness measurements by Stratus OCT. J Glaucoma 2006;15:336-40.
3.
Kolappan M, Henderson AP, Jenkins TM, Wheeler-Kingshott CA, Plant GT, Thompson AJ, et al. Assessing structure and function of the afferent visual pathway in multiple sclero sis and associated optic neuritis. J Neurol 2009;256:305-19.
4.
Barkhof F, Filippi M, Miller DH, et al. Comparison of MR imaging criteria at first presentation to predict conversion to clinically definite multiple sclerosis. Brain 1997;120:2059-69.
5.
Polman CH, Reingold SC, Edan G, Filippi M, Hartung HP, Kappos L, et al. Diagnostic criteria for multiple sclerosis: 2005 revisions to the “McDonald Criteria”. Ann Neurol 2005;58:840-6.
6.
Whiting P, Harbord R, Main C, Deeks JJ, Filippini G, Egger M, et al. Accuracy of magnetic resonance imaging for the diagnosis of multiple sclerosis: systematic review. BMJ 2006;332:875-84.
7.
Frischer JM, Bramow S, Dal-Bianco A, et al. The relation between inflammation and neurodegeneration in multiple sclerosis brains. Brain 2009;132:1175-89.
8.
Kallenbach K, Frederiksen J. Optical coherence tomography in optic neuritis and multiple sclerosis: a review. Eur J Neurol 2007;14:841-9.
25. Siepman TA, Wefers M, Hintzen RQ. Retinal nerve fiber layer thickness in subgroups of multiple sclerosis, measured by optical coherence tomography and scanning laser polarimetry. J Neurol 2010.
9.
Subei AM, Eggenberger ER. Optical coherence tomography: another useful tool in a neuro-ophthalmologist’s armamentarium. Curr Opin Ophthalmol 2009;20:462-6.
26. Garcia-Martin E, Pueyo V, Martin J, et al. Progressive changes in the retinal nerve fiber layer in patients with multiple sclerosis. Eur J Ophthalmol. 2010;20:167-73.
10. Magliozzi R, Howell O, Vora A, et al. Meningeal B-cell follicles in secondary progressive multiple sclerosis associate with early onset of disease and severe cortical pathology. Brain 2007;130(Pt 4):1089-104.
27. Pueyo V, Ara JR, Almarcegui C, et al. Sub-clinical atrophy of the retinal nerve fibre layer in multiple sclerosis. Acta Ophthalmol 2009.
11. Sergott RC, Frohman E, Glanzman R, Al-Sabbagh A. OCT in MS Expert Panel. The role of optical coherence tomography in multiple sclerosis: expert panel consensus. J Neurol Sci 2007;263:3-14. 12. Glisson CC, Galetta SL. Nonconventional optic nerve imaging in multiple sclerosis. Neuroimaging Clin N Am 2009;19:71-9. 13. Costello F, Hodge W, Pan YI, Eggenberger E, Coupland S, Kardon RH. Tracking retinal nerve fiber layer loss after optic neuritis: a prospective study using optical coherence tomography. Mult Scler 2008;14:893-905. 14. Younis A, Eggenberger E. Correlation of relative afferent pupillary defect and retinal nerve fiber layer loss in unilateral or asymmetrical demyelinating optic neuropathy. Invest Ophthalmol Vis Sci 2010;51:4013-6. 15. Salter AR, Conger A, Frohman TC, Zivadinov R, Eggenberger E, Calabresi P, et al. Retinal architecture predicts pupillary reflex metrics in MS. Mult Scler 2009;15:479-86. 16. Cettomai D, Pulicken M, Gordon-Lipkin E, Salter A, Frohman TC, Conger A, et al. Reproducibility of optical coherence tomography in multiple sclerosis. Arch Neurol 2008;65:1218-22. 17. Henderson AP, Trip SA, Schlottmann PG, Altmann DR, GarwayHeath DF, Plant GT, et al. An investigation of the retinal nerve fibre layer in progressive multiple sclerosis using optical coherence tomography. Brain 2008;131:277-87. 18. Blumenthal EZ, Parikh RS, Pe'er J, Naik M, Kaliner E, Cohen MJ, et al. Retinal nerve fibre layer imaging compared with histological measurements in a human eye. Eye 2009;23:171-5. 19. Cheung CY, Yiu CK, Weinreb RN, et al. Effects of scan circle displacement in optical coherence tomography retinal nerve fibre layer thickness measurement: a RNFL modelling study. Eye 2009;23:1436-41. 20. Cheung CY, Leung CK, Lin D, et al. Relationship between retinal nerve fiber layer measurement and signal strength in optical coherence tomography. Ophthalmology 2008;115:1347-51.
126
22. Youm DJ, Kim JM, Park KH, Choi CY. The effect of soft contact lenses during the measurement of retinal nerve fiber layer thickness using optical coherence tomography. Curr Eye Res 2009;34:78-83. 23. Bock M, Brandt AU, Dörr J, Kraft H, Weinges-Evers N, Gaede G, et al. Patterns of retinal nerve fiber layer loss in multiple sclerosis patients with or without optic neuritis and glaucoma patients. Clin Neurol Neurosurg 2010;112:647-52. 24. Frohman EM, Dwyer MG, Frohman T, Cox JL, Salter A, Greenberg BM, et al. Relationship of optic nerve and brain conventional and non-conventional MRI measures and retinal nerve fiber layer thickness, as assessed by OCT and GDx: a pilot study. J Neurol Sci 2009;282:96-105.
28. Nakamura M, Nakazawa T, Doi H, Hariya T, Omodaka K, Misu T, et al. Early high-dose intravenous methylprednisolone is effective in preserving retinal nerve fiber layer thickness in patients with neuromyelitis optica. Graefes Arch Clin Exp Ophthalmol 2010. 29. Wingerchuk DM, Hogancamp WF, O'Brien PC, Weinshenker BG. The clinical course of neuromyelitis optica (Devic's syndrome). Neurology 1999;53:1107-14. 30. Weinshenker BG. Neuromyelitis optica is distinct from multiple sclerosis. Arch Neurol 2007;64:899-901. 31. Wingerchuk DM, Lennon VA, Pittock SJ, Lucchinetti CF, Weinshenker BG. Revised diagnostic criteria for neuromyelitis optica. Neurology 2006;66:1485-9. 32. Toth CA, Narayan DG, Boppart SA, Hee MR, Fujimoto JG, Birngruber R, et al. A comparison of retinal morphology viewed by optical coherence tomography and by light microscopy. Arch Ophthalmol 1997;115:1425-8. 33. Leung CK, Cheung CY, Lin D, Pang CP, Lam DS, Weinreb RN. Longitudinal variability of optic disc and retinal nerve fiber layer measurements. Invest Ophthalmol Vis Sci 2008;49:4886-92. 34. Balcer LJ, Frohman EM. Evaluating loss of visual function in multiple sclerosis as measured by low-contrast letter acuity. Neurology 2010;74(Suppl 3):S16-S23. 35. Barkhof F, Calabresi PA, Miller DH, Reingold SC. Imaging outcomes for neuroprotection and repair in multiple sclerosis trials. Nat Rev Neurol 2009;5:256-66.
Yaz›flma Adresi/Address for Correspondence Nilüfer Kale 1626 Spartan Vlg Apt J 48823 E. Lansing - United States E-posta:
[email protected] gelifl tarihi/received kabul edilifl tarihi/accepted for publication
15/07/2010 05/08/2010
Turk Norol Derg 2010;16:121-126