MONITORING AND CONTROLLING OF THE INDUSTRIAL PROCESS WITH HELP OF CAM AND EIS SYSTEMS PAVLAS ROMAN VŠB – Technical University of Ostrava, 17. listopadu 15, 708 33 Ostrava, tel.: +420 59 732 3585, fax: +420 59 691 6129, e-mail:
[email protected] Abstract: This paper focuses on obtaining, saving and processing of service data from the production line of the industrial company LG. Philips Display Czech Republic, Ltd. Hranice in the way to be useable for monitoring and controlling of the industrial process. Preliminary part decribes methods of collecting data. As a result of these is developed concrete database project which is made for the evidence of the vacuum trolley repairs and for statistical processing of saving data. Based on users requirements analysis of monitored key performance indicators is done. Indicators are able to reflect actual status of the production (quantity, material consumption, production efficiency etc.). After that data and functional analysis of projected system is designed following the realization in database system Oracle. That are processed on basis these indicators for realization of EIS. Keywords: CAM, EIS, monitoring, controlling, performance indicators.
1 INTRODUCTION Tricolor tube plant LG Philips Displays Czech Republic Ltd. (formerly known as LPD Hranice) was founded in 2000 in Hranice na Moravě. It’s Philips (tricolor tube division) and LG Electronics joint-venture company. Enterprise IS functionality and reliability is based on data, which are read from divisions and plants. LPD Hranice is one of them. Local IS supply data generation and distribution. These data must be compatible with defined data formats with respect to EIS and enterprise information and communication philosophy. The aim is to provide local EIS, based on process and top management requests. This is a typical general IS design situation, when IS is to be enriched with new features during the implementation. These new features should be implemented with respect to minimal costs.
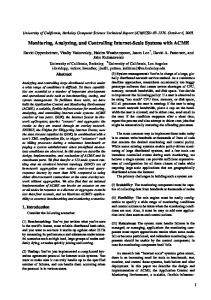
2 PRODUCTION PROCESS DESCRIPTION We can divide the whole production scheme in LPD into two production lines, which are independent. Basically there are two plants which are connected only with IS data flow and production outputs. Both production lines have almost the same scheme, with small differences. Production line 1, also known as Jumbo, is built with the new production technology, but CAM data acquisition is similar to production line 2, also know as Large. This production line is built with older technology and data acquisition has been implemented during production and is still in development. The aim is to improve it to perfect. Production process scheme is on figure 1st.
R093 - 1
Figure 1 - Production process in LPD Hranice
Each division has its own name and provides some main processes: Mask – shade make-up: normalizing, cooling, tempering, black mask degreasing, mask and shake make-up. Screen – screen make-up: washing, coloring, graphite matrix creation, phosphoric layers spreading RGB, aluminizing, mask and screen assembling. Thermal – screen and mask thermal processing – metal cone adjustment, washing, drying, glass cone adjustment, washing, drying, painting, enameling, welding, anti-implosion frame assembly, electronbeam gun sealing. MMM (Manual Matching) – screen activation and setting, packing: seasoning, degauss, test, deflecting coil assembly, setting, final control, packing. Chemical – provides chemicals needed in production: phosphor production, painting materials, aluminum, supplies both production lines. Reclaim – scraps correction: disassembly, component re-use preparation, provides screen refreshing also. 3 EIS DATA SOURCES Suggested system implements three data source types: 1. CAM enterprise system - ORACLE database 2. ERP SAP system – SAP transaction database 3. manual inputs 3.1 CAM system Data acquisition and production process monitoring is done via CAM. This system is internal built and isn’t used for process control. CAS is requisite for QAM – to control, provide and reserve production quality. It’s based on industrial bus, connected with barcode readers, PLCs, regulators and measuring systems. These means are connected with workstations via serial port. Every component and product is assigned with barcode to identify. In the beginning there was very high information loss. Barcode labels were spoilt because of high temperature, mechanical and chemical means. There are a lot of technologies to provide barcode labels on the market nowadays.
R093 - 2
Special barcode label printers are used in the field. Unique ID marking is used to identify screens and shades. In case of different ID system alarm is fired to inform the operator, while production process goes on. Product barcode is scanned during the production process and data are stored into Access database on the workstation. There are tens of such areas on the production line. Every one of them is equipped with one workstation at least. Number of workstation goes to hundreds peaces. CAM system is divided into five standard levels, see figure 2nd.
Figure 2 - CAM architecture, 5-leveling structure
Level description: Data acquisition – production process data acquisition is done on the base level. Technical means (barcode readers, PLCs, measuring units) communicate via RS232 serial link with workstations. Workstation – the second level. Workstations are connected to LAN. Data are stored locally, equipped with Windows NT4, MS Access database and two other applications. CamWorkstation communicates with technical means and database, CamInterface provides reporting and message queuing. Communication to database is via ODBC. Cell Controller – this is quasi cluster system, based on three IBM RS 6000 servers with Unix OS. Two are masters and one is slave. In case of master failure, slave begins to communicate. Pyrrho communication software is used to identify, organize, evaluate, receive, and forward system messages. Line database – cluster of two HP L2000 servers. ORACLE database is used as db backend, server are running ULTRIX OS. This is the production process data store and reports are generated there. 3.2 ERP SAP system ERP SAP system is important part of data processing. On picture 3rd we can see the function of SAP EIS in the enterprise. Modules above dashed line have been already implemented. They provide live data and cooperate on production process. We can find here modules such as financial, planning, management, marketing, and distribution.
R093 - 3
Finanční účetnictví
SAP
SKLAD Controlling
CAM
EXPEDICE LOKÁLNÍ EIS
PERSONALISTIKA
CÍL
QAM
reporting
CENOVÁ POLITIKA
CENTRÁLA FINANCE EIS
Figure 3 - ERP SAP-R/3 in architecture of enterprises IS/IT
4 REQUIRED EIS OUTPUTS Variables used in formula, see figure 4th.
I E D A F
Internal repair External repair Rejection Off-line repair Amount of units stored Figure 4 - Block chart of process step
A) Production yield Direct yield:
YD =
F ⋅ 100[% ] F +D+E+I + A
(1)
Yp =
F ⋅ 100[%] F +D+E+I
(2)
Process yield:
Total yield:
Yt =
F ⋅ 100[%] F +D+E (3)
R093 - 4
These formulas define yield types. Following indicators are used in the enterprise: • Front – End Direct Yield - matrix creation, aluminizing, spreading, painting • Back – End Direct Yield – includes all final processes – sealing, packing, degaussing, and seasoning. • Factory Total Yield – includes all final assembly processes • Salvaging Yields – monitors following areas: input control, separation, repair, and output control • Panels - Salvaging Yields • Pipes - Salvaging Yields B) Material consumption Material consumption Mc is defined as a sum of material delivered S (both internal and external resources) divided by sum of goods stored
S ⋅ 100 [%] F F+L Mc = ⋅ 100 [%] F Mc =
(4) (5)
where L is total material loss. C) Enterprise Efficiency, Production, and Actual Load These indices represent standard performance values used in Business Group Display Components. All central EIS reports are defined with respect to these three indices. 5 SUGGESTED EIS ARCHITECTURE
CAM
SAP
ETL
Proces extrakce dat
Oblast vývoje Transformace a načítání
KPI database
Přístup k datům a analýza dat
Zdrojové systémy
Figure 5 - Suggested EIS architecture
As we can see on figure 5th, after identification we need to read data from source systems to move data into data store. We can read data in many ways and this process is called extraction. Data read can be extraction, transformation, and loading. Tools are SQL statements or other specialized tools. Data store – Key Performance Indicators Database is realized as special database instance running together with other instances. Database runs ORACE 9i server. Data access: Data access is based on Oracle 9i AS front-end tools. Intranet application is used there. The main tools are Oracle Discoverer, Oracle Reports, and Presentation Services which provide reporting capabilities, such as creating, managing and defining user reports.
R093 - 5
6 APPENDIX The presented paper was created with support of MSMT project No. 272300012.
References: [1] ABBEY, M.; CORREY, M.; ABRAMSON, I. Oracle9i. Přeložil: Jiří Penc. Praha : SoftPress, 2002. ISBN 80-86497-24-0. [2] LAUDON, K. C.; LAUDON, J. P. Management Information Systems. Organization and technology. Prentice Hall, Englewood Cliffs, 1996. [3] HUMPHRIES, M. & COL. Data Warehousing návrh a implementace. Praha : Computer Press, 2002. ISBN 80-7226-560-1.
R093 - 6