Modeling Type 1 Diabetes in NOD Mice Joseph M. Mahaffy Nonlinear Dynamical Systems Group Computational Sciences Research Center Department of Mathematical Sciences San Diego State University October 2006
– p. 1/3
University of British Columbia
Sabbatical leave with host
Leah Edelstein-Keshet
Diabetes Oct 2006 – p. 2/3
Outline • Biology - Diabetes and Immune Response • Mathematical Model • Bifurcation Analysis • Simulations • Discussion and Conclusions
Diabetes Oct 2006 – p. 3/3
Glucose Metabolism • Ingest food - Breaks down to simple sugars • Blood absorbs sugar • •
• •
- Raises blood glucose concentration β cells in pancreas respond - Insulin released Cells increase glucose uptake - Insulin facilitates glucose transport across cell membranes, especially in skeletal muscles Glucose converted to glycogen - Preferred energy storage of cells Blood sugar level decreases - Body tightly regulates glucose levels
Diabetes Oct 2006 – p. 4/3
β Cells - Insulin Release
Diabetes Oct 2006 – p. 5/3
Type 1 or Juvenile Diabetes - Overview • Diabetes mellitus results from the loss of β cells - An auto-immune disease • Insulin production is severely reduced • Hereditary disease - about 4-20 per 100,000 people • Peak diagnosis occurs around age 14 • 10% of diabetes cases are Type 1, while 90% are Type 2 (where cells become insulin resistant, mostly in obese individuals) • Treatment is regular injections of insulin - transplants are usually attacked by immune system
Diabetes Oct 2006 – p. 6/3
Type 1 or Juvenile Diabetes - Symptoms • Classic Symptoms - Polyphagia (hungry) - Polydipsia (thirsty) - Polyuria (frequent urination) • Other Symptoms
-
Blurred vision Fatigue Weight loss Poor wound healing
Diabetes Oct 2006 – p. 7/3
Type 1 or Juvenile Diabetes - Disease • Increased heart disease - Atherosclerosis from low insulin • Blindness (retinopathy)
- Increased pressure in eye • Nerve damage (neuropathy) • Kidney damage (nephropathy)
Diabetes Oct 2006 – p. 8/3
T Cell Activation
• T cells mature in the thymus - Cross-react with self-protein to prevent autoimmunity • T cells migrate to Lymph nodes
- Interact with antigen presenting cells (APCs) - APCs present antigen protein fragment (about 9 AAs) inside MHC (major histocompatibility complex) - The peptide-MHC complex interacts with T cells surface receptors - T cells with appropriate specificity become activated • Most antigens are foreign proteins from viruses and bacteria
Diabetes Oct 2006 – p. 9/3
T Cell Immune Response • Activated T cells proliferate about 6 cell divisions • Most become Effector cells (cytotoxic T-lymphocytes or CTLs)
- CTLs are efficient specific killers, destroying target cells - Relatively short-lived • Some become Memory cells - No immediate effect - Long-lived cells - New exposure to same antigen, rapidly activated - Strategy for vaccines • Type 1 diabetes when CTLs attack β cells in pancreas • Other autoimmune diseases are similar
Diabetes Oct 2006 – p. 10/3
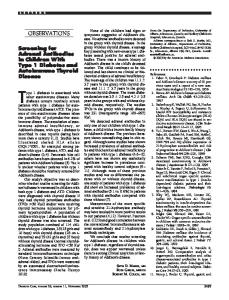
Model Scheme for Diabetes
LYMPH NODE
PANCREAS Apoptotic β cell
peptide p activation
β Cell
111111 000000 000000 111111 000000 111111 000000 111111 000000 111111 000000 111111 000000 111111 000000 111111 000000 111111 000000 111111 000000 111111 injury 000000 111111 000000 111111
naive T cell
p−MHC
apoptosis Dendritic cell
f1
A E
111 000 0000 1111 000 111 000 111 000 111 000 111 0000 1111 000 111 000 111 000 111 000 111 0000 1111 000 111 000 111 000 111 000 111 0000 1111 000 111 000 111 000 111 000 111 0000 1111 000 111 000 111 000 111 000 111 0000 1111 000 111 000 111 000 111
Effector (CTL) T cells
Activated T cell
f2
M
Memory cells
Diabetes Oct 2006 – p. 11/3
Animal Model for Diabetes • Non-Obese Diabetic or NOD mice undergo apoptosis or programmed cell death of β cells in the pancreas shortly after birth • Clearance of apoptotic cells by macrophages is reduced
- Possibly forms self-antigen - Experiments suggest a fragment from IGRP (glucose-6-phosphate catalytic subunit-related protein) produces a dominant antigen • Experiments designed to find autoreactive CD8+ T cells in pancreas of NOD mice • Observed three waves of CD8+ T cells before mice became diabetic around 16 weeks
Diabetes Oct 2006 – p. 12/3
NOD Mice Data
Link to Model Simulation
Diabetes Oct 2006 – p. 13/3
Simple Model Schematic f1 f1
M f
2
A 1−f
2
E
B
p
• A = Activated T cells • M = Memory cells • E = Effector or killer T cells • p = peptide • B = Fraction of remaining β cells
Diabetes Oct 2006 – p. 14/3
Feedback Functions memory
activation
f 2 (p)
f1 (p)
k2
Activation function
Inhibition function
k1
p pn f1 (p) = n k1 + p n
ak2m f2 (p) = m k2 + p m
Diabetes Oct 2006 – p. 15/3
Complete Model dA dt dM dt dE dt dp dt dB dt
= (σ + αM )f1 (p) − (β + δA )A − ǫA2 = β2m1 f2 (p)A − f1 (p)αM − δM M = β2m2 (1 − f2 (p))A − δE E = REB − δp p = −κEB
with nonlinear feedback functions f1 (p) =
pn k1n + pn
f2 (p) =
ak2 m k2m + pm
Diabetes Oct 2006 – p. 16/3
Activated T cells dA dt dM dt dE dt dp dt dB dt
= (σ + αM )f1 (p)−(β + δA )A − ǫA2 = β2m1 f2 (p)A − f1 (p)αM − δM M = β2m2 (1 − f2 (p))A − δE E = REB − δp p = −κEB
The production of activated T cells, A, from naive T cells and memory cells.
Diabetes Oct 2006 – p. 17/3
Activated T cells dA dt dM dt dE dt dp dt dB dt
= (σ + αM )f1 (p)−(β + δA )A−ǫA2 = β2m1 f2 (p)A − f1 (p)αM − δM M = β2m2 (1 − f2 (p))A − δE E = REB − δp p = −κEB
The production of activated T cells, A, from naive T cells and memory cells. The loss of activated T cells, A, becoming effector and memory T cells, decaying, and competing with others.
Diabetes Oct 2006 – p. 17/3
Effector T Cells and β Cells dA dt dM dt dE dt dp dt dB dt
= (σ + αM )f1 (p) − (β + δA )A − ǫA2 = β2m1 f2 (p)A − f1 (p)αM − δM M = β2m2 (1 − f2 (p))A − δE E = REB − δp p = −κEB
The effector T cells, E , destroy β cells producing the protein that activates T cells.
Diabetes Oct 2006 – p. 18/3
Complete Model - Discussion • 5-Dimensional Model - Highly nonlinear - Difficult to analyze • 17 Physiological parameters
- Many are known or have good estimates - Constrains possible solutions • Time Scale - The peptide, p, has fast reaction kinetics - This allows Quasi-Steady State Approximations - The β cells, B , have slow dynamics - This allows consideration of slow changing parameter
Diabetes Oct 2006 – p. 19/3
Quasi-Steady State Model The model for analysis consists of three equations: dA dt dM dt dE dt
= (σ + αM )f1 (p) − (β + δA )A − ǫA2 = β2m1 f2 (p)A − f1 (p)αM − δM M = β2m2 (1 − f2 (p))A − δE E
together with the QSS peptide expression p ≈ (RB/δp )E
3-D system of differential equations permits a more complete analysis.
Diabetes Oct 2006 – p. 20/3
QSS Model - Discussion • Equilibria - There are 1-5 equilibria - With physiological parameters, 3 equilibria exist • Linear Analysis of 3 Equilibria
- Origin is a Stable Node - Diseased State is a Node that is Stable or Unstable depending on parameters - Third equilibrium is a Saddle Node
Diabetes Oct 2006 – p. 21/3
3D Phase Portrait Diabetes Model
1
0.8
E
0.6
0.4
3
0.2 2.5 2
0 1
1.5 0.8
1
0.6 0.5
0.4 0.2 0
0
A
M
Diabetes Oct 2006 – p. 22/3
3D Phase Portrait
0.1 0.08 0.06 0.04 0.02 0 0.2
*
0.15
0.8 0.6
0.1
0.4 0.05
0.2 0
0
Diabetes Oct 2006 – p. 23/3
QSS Model - Parameter Study • Parameters - Experimental data compiled by Marée, Santamaria, and Edelstein-Keshet - Physiological range of parameters limited by their study for most parameters in the model - Several parameters remain unknown, so varied to obtain desired behaviour - Sensitivity of the parameters was studied
Diabetes Oct 2006 – p. 24/3
QSS Model - Bifurcation Study • Bifurcation Analysis - Many parameters investigated using AUTO with XPP - Chose peptide clearance rate δp as it is believed that poor clearance could induce diabetes - In the normal range of clearance, the most solutions approached the Origin - When halved, the many solutions oscillated about the Diseased State - The QSS approximation is RB E, p≈ δp
so δp increasing is similar to B decreasing
Diabetes Oct 2006 – p. 25/3
Bifurcation Diagram Y1 2 1.8 1.6 1.4 1.2 1 0.8 0.6 0.4 0.2 0 0
0.5
1
1.5
2 a15
2.5
3
3.5
4
Diabetes Oct 2006 – p. 26/3
Bifurcation Diagram Y1 3.5
3
2.5
2
1.5
1
0.5
0 2
4
6
8
10
12
14
16
18
a15
Diabetes Oct 2006 – p. 27/3
Homoclinic Bifurcation S
S
D
H
H
S
S
D
D
H
L
D
H
Diabetes Oct 2006 – p. 28/3
Link to Diabetic SimulationLink to Normal Simulation
Complete Model - Normal Mouse • Simulated complete model for a normal mouse - Assumed an initial response of Effector T cells - Normal parameter values - Some β cells die, but levels at high equilibrium
Diabetes Oct 2006 – p. 29/3
Simulation - Normal Mouse 1.8
1.6
1.4
1.2
1
0.8
0.6 B 0.4 E
M
0.2 A 0
−0.2
0
20
40
Link to Homoclinic Diagram
60
80
100 t
120
140
160
180
200
Diabetes Oct 2006 – p. 30/3
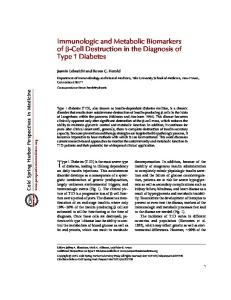
Complete Model - Diabetic Mouse • Simulated complete model for a diabetic mouse - Assumed an initial response of Effector T cells - Lower peptide clearance - Increasing spikes of Activated T cells - Waves of short-lived Effector T cells - High Memory cell populations allow new response - Slow decline of β cells until diabetic
Diabetes Oct 2006 – p. 31/3
Simulation - Diabetic Mouse 3
2.5 A 2
1.5
1 M
B 0.5 E 0
−0.5
0
20
40
60
80
100 t
120
Link to Experimental dataLink to Homoclinic Diagram
140
160
180
200
Diabetes Oct 2006 – p. 32/3
Discussion and Conclusions • Designed a reasonable model for NOD mice • Parameters fit physiological data • Simulations indicate parameters and initial conditions may be too sensitive • Excellent qualitative behaviour of the model • Good example of a homoclinic bifurcation • Model supports biological theory of defective clearance after apoptosis
Diabetes Oct 2006 – p. 33/3