MAGNETIC ORIENTATION OF LOGGERHEAD SEA TURTLE HATCHLINGS: MIGRATORY STRATEGIES IN THE GULF OF MEXICO By Maria W. Merrill
A Thesis Submitted to the Faculty of The Charles E. Schmidt College of Science in Partial Fulfillment of the Requirements for the Degree of Master of Science
Florida Atlantic University Boca Raton, Florida May 2010
ACKNOWLEDGEMENTS My research and the writing of this thesis could not have been accomplished without the hard work and support of many people. First and foremost, I want to extend the greatest thanks to my major advisor, Dr. Mike Salmon. I gratefully acknowledge the advice, encouragement, and unending patience that fostered my development as a scientist. His passion for sea turtle behavioral ecology, and indeed all aspects of scientific research and discovery, continues to educate and inspire me. Mote Marine Laboratory‟s Sea Turtle Conservation and Research Program supplied the beach access, nesting data, and laboratory facilities that made my research possible. I am especially indebted to the program‟s director, Dr. Tony Tucker for his logistical support, guidance throughout two summers of research, and contributions as a member of my thesis committee. I am also grateful to Dr. William Tavolga for providing the laboratory space at Mote Marine Laboratory that housed much of my equipment and in which I spent countless days and nights. Numerous other people played an important role in my education and in the completion of this thesis. Dr. Steve Kajiura provided guidance and made valuable contributions as a member of my thesis committee. I also thank Dr. Kate Mansfield, Dr. Laurent Cherubin and Dr. Ken Lohmann for imparting knowledge essential to the development of my thesis. I am grateful to the FAU Foundation for funding assistance and especially to Dr. Mike Salmon and Dr. Jeanette Wyneken for their contributions to and management of this fund. iii
Some of the most important people in this process were my lab mates and friends. Their ability to challenge my ideas, to provide valuable feedback and to keep me laughing is greatly appreciated. I especially want to thank Jeff Guertin, Cody Mott, Justin Perrault, Jeremy Conrad, James Beerens, Erin Dougherty, and Rachel Welicky for their friendship in classes, in the lab and overseas. I also offer sincere gratitude to Jeff Guertin for his assistance and friendship as my roommate and lab mate over two summers of field work. Thanks to Cody Mott for his unmatched skill in reassembling my equipment at the start of my second season. The love and support from Misha Kerr, Yenvy Truong, Sadia Sharfi, Pamela Harris, Ryan Deibler, Elizabeth Barnum and Maura Smyth were also vital to the completion of this degree. Finally, I thank my family for their continual encouragement and love. My parents Cynthia and Clark Merrill set a high bar for academic excellence and have seen me through all my endeavors, and for that I am extremely grateful. I am also thankful to my sisters Emily, Christina and Madeleine for inspiring me with their courage and cheering me with their humor. I can never say thank you enough to my grandmother Carole “Grammy” Robledo, for being my rock, my best friend and my major source of support throughout these years. I also must thank Maureen Merrill, Mark and Flori Robledo, Lyn Davis, Sarah Davis, Anita and Joseph Chandler, and Boynton “Grandaddy” and Marian “Gigi” Merrill for their endless encouragement. Thank you.
iv
ABSTRACT Author:
Maria W. Merrill
Title:
Magnetic orientation of loggerhead sea turtle hatchlings: migratory strategies in the Gulf of Mexico
Institution:
Florida Atlantic University
Thesis Advisor:
Mike Salmon
Degree:
Master of Science
Year:
2010 Loggerhead sea turtles nest on either the Atlantic or Gulf coast of Florida. The
hatchlings from these nests migrate offshore in opposite directions. The purpose of my study was to determine if Gulf coast hatchlings use magnetic maps, as Atlantic coast hatchlings do, both to locate areas favorable for survival in the Gulf of Mexico and to orient appropriately within surface currents that could transport them into the Atlantic Ocean. To find out, I presented Gulf coast hatchlings with magnetic fields corresponding to different locations inside the Gulf, and within currents leading into (Florida Straits) and within (Gulf Stream) the western portion of the Atlantic Ocean. I conclude that Gulf coast hatchlings (i) use a high resolution magnetic map for navigation within the Gulf of Mexico, (ii) initially remain within the eastern Gulf, but later may (iii) gain entry into currents that transport them into Atlantic waters.
v
TABLE OF CONTENTS
LIST OF TABLES ........................................................................................................... viii
LIST OF FIGURES ........................................................................................................... ix
INTRODUCTION .............................................................................................................. 1
MATERIALS AND METHODS ........................................................................................ 4 Hatchling acquisition .............................................................................................. 4 Orientation tank and data collection ....................................................................... 4 Magnetic waypoints and control of the magnetic field ........................................... 5 Test protocol ........................................................................................................... 7 Data analysis and statistics...................................................................................... 8 Surface currents ...................................................................................................... 8
RESULTS ......................................................................................................................... 10 Waypoint magnetic field components .................................................................. 10 Surface currents .................................................................................................... 10 vi
Hatchling orientation ............................................................................................ 11 Statistical comparisons between the groups ......................................................... 12
DISCUSSION ................................................................................................................... 13 Orientation and migratory routes: a hypothesis .................................................... 14 The ecology of magnetic navigation by hatchling loggerheads............................ 18 Management and conservation implications ......................................................... 21 Conclusions and future directions ......................................................................... 23
LITERATURE CITED ..................................................................................................... 25
vii
LIST OF TABLES Table 1. Magnetic waypoint locations and their associated magnetic field components (in microtesla [μT]). ............................................................................................................. 35 Table 2. Results of Mardia-Watson-Wheeler tests to determine whether there were statistical differences between the 6 waypoint sites where the turtles showed significant orientation. ......................................................................................................... 36
viii
LIST OF FIGURES Figure 1. Diagram of the coil and water-filled pool used to measure hatchling orientation.. ........................................................................................................ 37 Figure 2. Typical sea surface currents in the Gulf of Mexico and in the waters adjacent to the Southeastern coast of Florida during the late summer months when loggerhead hatchlings begin their migration...................................................... 38 Figure 3. Hatchling orientation in the Eastern Gulf of Mexico. A, 40 km south of Pensacola; B, 240 km southeast of Pensacola; C, Sarasota Beach; and D, 65 km offshore of Sarasota Beach ..................................................................... 39 Figure 4. Hatchling orientation at A, 60 km north of the Florida Keys; B, in the Florida Straits; C, 20 km east of Boca Raton; and D, 40 km east of Melbourne Beach, Florida ................................................................................................................ 40 Figure 5. Hypothesized migratory route of the Sarasota Beach hatchlings in the Gulf of Mexico, shown in relation to the direction of the surface currents and the behavior of the turtles when presented with each waypoint .............................. 41
ix
INTRODUCTION Loggerhead turtles (Caretta caretta L) nesting in southern Florida (the South Florida “subpopulation”) represent the largest breeding unit of this species in the western Atlantic. On average, the females produce about 90 % of all of the hatchlings annually departing from the nesting beaches in North Atlantic waters (Murphy & Hopkins 1984; Meylan et al. 1995). This subpopulation consists of a large group of females that nest on the southeastern coast, and a smaller group that nest on the southwestern (Gulf of Mexico facing) coast of the peninsula (Witherington et al. 2009). The two groups cannot be distinguished on the basis of their mitochondrial DNA haplotypes (Bowen et al. 1993) but are separated behaviorally by their fidelity to different rookery sites (Bjorndal et al. 1983; LeBuff 1990; Tucker 2010). Carr (1986) postulated that hatchling loggerheads migrating away from nesting beaches on Florida‟s east coast were transported across the north Atlantic by the Gulf Stream to “nursery areas” in the eastern Atlantic. This hypothesis was initially supported by the discovery of juvenile turtles of a size class not present in coastal surveys done on the western side of the Atlantic basin, but found in abundance in eastern waters near Madeira, the Canary Islands, and the Azores (Carr 1986; Bolten et al. 1993). A mtDNA analysis (Bolten et al. 1998; Bolten 2003a) confirmed that most of the juveniles were progeny of the South Florida subpopulation, though whether any of those turtles came from Gulf of Mexico nesting beaches could not be determined.
1
Hatchling loggerheads are persistent but weak swimmers that, after an initial 24 h frenzy period of offshore migration (Wyneken & Salmon 1992), become relatively inactive. Witherington (2002), working on the Atlantic coast adjacent to Melbourne Beach, Florida, found large numbers of small turtles resting near to or within Sargassum mats on the western edge of the Gulf Stream. The Gulf Stream lies relatively close to the East coast of Florida (3 – 70 km, depending upon latitude; NOAA National Data Buoy Center, 2006), which probably improves the likelihood that hatchlings swimming offshore will locate the Gulf Stream and eventually be carried eastward by this current, across the Atlantic. Once within the Gulf Stream the turtles are capable of using magnetic cues to orient appropriately to remain within the North Atlantic gyre (Lohmann et al. 2001; Lohmann & Lohmann 2003). These responses indicate that even hatchlings with no prior experience swimming in the open ocean can use magnetic information as navigational markers during migration (Lohmann et al. 2001). For hatchlings departing from nesting beaches on the southwestern coast of Florida (hereafter, west hatchlings), migration to a nursery area in the eastern Atlantic (if, in fact, it occurs) may be far more difficult for the following reasons. First, the turtles must somehow locate a current that can transport them out of the Gulf of Mexico and into the Atlantic Ocean. The Loop Current could serve this purpose, but lies much farther offshore (150-200 km; Sturges & Lugo-Fernandez 2005; Gyory et al. 2005) than does the Gulf Stream on the east coast. Negotiating that greater distance was postulated as a factor that might account for why, during the early stages of migration, west hatchlings swim more actively than east hatchlings (Wyneken et al. 2008). Second, the surface currents in the Gulf of Mexico, and especially those between 2
the nesting beach and the Loop Current, are irregular in direction and weak in speed. They are also likely to displace hatchlings departing from southwestern nesting beaches in Florida northward, away from the Loop Current (Collard & Ogren 1990). Third, west hatchlings (like their counterparts from east coast beaches) might use magnetic information to remain within favorable locations within the Gulf of Mexico either in addition to, or instead of, embarking on a longer migration to the eastern Atlantic. The purpose of this study was to explore, for the first time, how west hatchlings respond to magnetic cues during migration. To find out, I presented the turtles with magnetic “waypoints” within the Gulf of Mexico (hereafter, GM), in the Florida Straits, and within the Gulf Stream as it flows by the Atlantic coast of Florida. The orientation responses shown by the hatchlings were then used to (i) determine whether the hatchlings could orient appropriately when presented with magnetic cues present in the Florida Straits and in the Gulf Stream, and to (ii) better understand how hatchlings might exploit the weaker surface currents in the GM during their migration.
3
MATERIALS AND METHODS Hatchling acquisition Hatchlings were obtained between July – September, 2009 from nests deposited on beaches located in Casey Key (27.2°N, 82.5°W), Sarasota County, Florida, USA. After deposition all nests were marked by Mote Marine Laboratory personnel (Sarasota, Florida, U.S.A.). Several days before an anticipated emergence, restraining cages were placed over each nest to detain the hatchlings once they emerged. Cages were made of plastic mesh instead of galvanized steel, because exposure to altered magnetic fields distorted by metal cages affects the ability of the hatchlings to respond normally to magnetic cues (Irwin et al. 2004; Fuxjager et al. 2005). Caged nests were checked each night for the presence of emerged hatchlings. When an emergence took place, I released all but 10 turtles that were instead placed inside a covered Styrofoam cooler. The cooler contained a layer of moist sand (to prevent dehydration). Captured hatchlings were transported ~ 35 km north to the Mote Marine Laboratory where they remained in complete darkness and exposed to outdoor temperatures (23-33º C) until used for experiments that same night. Orientation tank and data collection During experiments each turtle swam inside a circular polyethylene tank (1.45 m in diameter x 53.0 cm tall) filled to a depth of ~ 40 cm with filtered seawater (Fig. 1). Just before its trial, each turtle was placed in a nylon-lycra harness that did not impede its
4
swimming performance (Salmon & Wyneken 1987). The harness was attached by a short tether of monofilament line to a horizontally rotating lever arm centered over the tank just above water level (Fig. 1). A tethered hatchling could swim in any direction and make shallow dives but the tether‟s length prevented it from touching either the side or the bottom of the tank. As the turtle swam, it pulled the lever arm toward its swimming direction. The lever arm in turn was connected to a digital encoder that tracked the arm‟s position and sent that information at 10 s internals to a computer located in an adjacent room, where the data were stored. Magnetic waypoints and control of the magnetic field During each evening, I exposed the turtles from a single clutch to one of the following 5 magnetic field waypoints within the GM: (i) 60 km south of Pensacola, (ii) 240 km to the SE of Pensacola, and just north of an intruded position of the Loop Current into the GM, (iii) 65 km due west of Sarasota Beach, (iv) at Sarasota Beach, and (v) 60 km north of the Key West, Florida. Three additional turtles were exposed to waypoints located (vi) in the Florida Straits about 60 km south of Key West, Florida, (vii) in the Atlantic Ocean 20 km east of Boca Raton, Florida, and (viii) in the Atlantic Ocean 40 km east of Melbourne Beach, Florida. To create each waypoint, I used a two channel regulated DC power supply (B&K Precision, Model 1760A, Yorba Linda, California) to separately control the DC current sent to each of two large (~2 m2) wire coils. One coil was oriented horizontally (controlling the vertical component of the magnetic field) and the other vertically (controlling the horizontal component; Fig. 1). Each coil was a 4-square design (Merritt et al. 1983) that generated a uniform (+ 1 %) magnetic field in the central area where the 5
seawater-filled tank was positioned. Prior to any experiments, I used a Schonstedt singleaxis fluxgate digital magnetometer (Model DM 2220 R) to confirm that the desired horizontal and vertical components for each waypoint were reproduced uniformly in each of eight cardinal directions (N, NE, E, SE, S, etc.) within the circular area where the tethered hatchling swam during its trials. Values varied from one another by less than 0.5% at each location (within the margin of error of my measurements even at any one location) and were checked weekly to assure their stability while experiments were in progress. I determined the desired horizontal and vertical components of the magnetic field at each waypoint in one of two ways: by direct measurement or by extrapolation from a nearby direct measurement based upon changes in the NOAA‟s National Geophysical Data Center (NGDC) model (http://www.ngdc.noaa.gov/geomagmodels/IGRFWMM.jsp). Where I could, I used direct measurements. For example, the Sarasota beach waypoint was obtained by a direct measurement at the beach. The Sarasota Beach waypoint 65 km to the west was based upon the change in the NGDC model horizontal and vertical components over that distance. The Melbourne Beach and Boca Raton waypoints were similarly based upon a measurement at the beach, modified by the change in the NGDC components over a 40 km and 20 km distance eastward, respectively. Waypoints to the North of Florida Keys and in the Florida Straits were based upon measurements I made in Marathon and Bahia Honda Keys (the values were identical), modified by a 60 km displacement to the North and South, respectively. The waypoints 60 km south of Pensacola and 240 km southeast of 6
Pensacola were based upon direct measurements taken at Pensacola Beach, modified by the change in the NGDC components over their respective displacements. The coil and tank were located in an outdoor corridor under one of the laboratory buildings. At this location, they were protected from wind, rain, and solar radiation while exposed to ambient (shaded) temperatures. Test protocol All testing was done at night between 2000 and 0300 h, when most loggerhead hatchlings emerge from their nests (Witherington et al. 1990). I actually completed my experiments each evening by 0200 as after that time hatchlings swim with less vigor and orient less accurately (K.J. Lohmann, pers. comm.). I followed the procedures developed by Lohmann and Lohmann (1994a). During a 10 min pretest period, each turtle was harnessed and released to swim inside the tank while it was exposed to the dim illumination provided by a 7.5 W incandescent bulb, suspended 2-3 cm above the water surface on the west side of the tank (Fig. 1). Normal hatchlings swam toward the light (Lohmann 1991; Lohmann & Lohmann 1994a). The few turtles that failed to orient toward the light were replaced by another turtle. The magnetic field surrounding the tank during the pretest period was identical to the field at Casey Key, where the turtle was captured. The pretest period was followed immediately by a 3 min acclimation period. This period began when the light was extinguished and one of the eight waypoints was presented. In the absence of light, the turtles “consult” the earth‟s field to determine an appropriate orientation direction (Lohmann 1991; Light et al. 1993; Lohmann & Lohmann 1993, 1994b). 7
The test period followed immediately after acclimation. During this period conditions remained identical but the turtle‟s orientation angle (between 0 º - 359 º) was recorded on computer at 10 s intervals for 10 minutes. Each turtle was tested only once. Each night, the eight waypoints were presented to the turtles in a different order. After all of the turtles for the evening had been tested they were taken to a nearby dark beach and released. Data analysis and statistics At the conclusion of each test period, a software program (Arena Turtle Tracker, W. Irwin, University of North Carolina, Chapel Hill) converted the 60 angles stored during the 10 min test period into a single mean angle of orientation. The mean angles of all of the turtles exposed to the same waypoint were pooled to determine a group (second order) mean angle and measure of dispersion (r-vector; Zar 1999). Rayleigh tests were used to determine whether groups showed significant clustering (= orientation; Batschelet 1981; Zar 1999). If they did, I determined the 95% confidence interval for the mean angle. I compared significant distributions to one another using Mardia-Watson-Wheeler tests (Batschelet 1981; Zar 1999). In all statistical tests, the null hypothesis of no difference between groups was rejected when probabilities were < 0.05. The distribution of hatchling mean angles at one of the waypoints (offshore of Melbourne Beach) appeared bimodal. At this site I calculated a mean angle, r-vector and 95 % confidence interval for each distribution. Surface currents The responses shown by the turtles were interpreted with reference to the speed and direction of the surface currents in the vicinity of each waypoint. Records of surface 8
current direction and velocity were downloaded from maps generated by data accumulated over the past 25 years from satellite-tracked surface drifting buoys in the Gulf of Mexico and Western Atlantic. This study represents a portion of the Global Drifter Program carried out by the Cooperative Institute for Marine and Atmospheric Studies (CIMAS) in collaboration with the National Oceanic and Atmospheric Administration (NOAA). Data were collaboratively analyzed by two agencies. Maps for the Caribbean Sea are available at: http://oceancurrents.rsmas.miami.edu/data.html.
9
RESULTS Waypoint magnetic field components The magnetic field components used at each waypoint are shown in Table 1. Surface currents The basic pattern of flow by the Loop Current is well known and has been recently summarized by Gyory et al. (2005). Surface waters from the Caribbean Current (northwestern portion of the North Atlantic gyre) enter the Gulf of Mexico between the Yucatan peninsula and Cuba as the Yucatan Current (Fig. 2). This current varies in the extent of its intrusion into Gulf of Mexico waters. At one extreme, it hardly intrudes at all and instead turns eastward almost immediately to merge with the Florida Current, which then passes between the northeastern coast of Cuba and the Florida Keys. The Florida Current (also known as the western portion of the Gulf Stream) then turns northward and parallels the east coast of the Florida peninsula south of Cape Canaveral before veering to the northeast (Fig. 2). At the other extreme, the Yucatan Current intrudes as much as several hundred kilometers into the Gulf of Mexico as a clockwiseflow before turning to the south and from there, joining the Florida Current (Fig. 2, bottom). Conditions between these extremes occur cyclically but at irregular (6-17 months) periods that show no seasonal correlation (Molinari 1980). The Yucatan, Loop and Florida currents are the strongest surface currents in the Gulf of Mexico. Other currents in the Gulf are not only weaker, but often vary in
10
direction. This situation exists especially when “eddy or Loop Current rings” separate from the intruded Loop Current and travel westward across the Gulf (left portion of map, Fig. 2). A weaker current between the coast and the Loop Current persists to form a northward flowing countercurrent that extends into Panhandle waters. On the Atlantic coast, another weak countercurrent (not shown in Fig. 2) flows south between the Gulf Stream and the east coast of Georgia and Florida. It continues to the south of Cape Canaveral. Hatchling orientation Hatchlings (n = 22) exposed to the magnetic field near Pensacola beach were significantly oriented to the NW (324°, p < 0.02; Fig. 3A). At 240 km to the SE of Pensacola and North of the Loop Current, the turtles (n = 28) showed no significant orientation (Fig. 3B). Hatchlings (n = 37) exposed to the magnetic field at Sarasota Beach were significantly oriented to the NW (321°, p < 0.05; Fig. 3C) but at a location 65 km to the West of Sarasota Beach, the turtles (n = 27) failed to show significant orientation (Fig. 3D). Hatchlings (n = 33) exposed to the magnetic field just north of the Florida Keys were significantly oriented to the NW (327°, p < 0.05; Fig. 4A). Hatchlings (n = 32) exposed to the magnetic field within the Florida Straits were significantly oriented to the ESE (116°, p < 0.05; Fig. 4B). Hatchlings were exposed to two waypoints on the East coast of Florida. Those (n = 21) presented with a magnetic field 20 km to the east of Boca Raton were significantly oriented to the northeast (69°, p < 0.02; Fig. 4C) whereas those (n = 32) exposed to a 11
waypoint 40 km to the east of Melbourne Beach were significantly oriented to the southwest (mean angle of 259° and r-vector of 0.31; p < 0.05). This distribution may also be interpreted as bimodal, with 19 turtles swimming SW (238º, p < 0.01) and 13 swimming NE (33º, p < 0.05; Fig. 4D). Statistical comparisons between the groups There were no significant differences in mean angle of orientation (by MardiaWatson-Wheeler tests; Table 2) among the three groups of turtles that headed NW (Pensacola Beach [324º], Sarasota [321º], or North of the Florida Keys [327º]). There were also no significant differences in mean angle of orientation between the two groups of turtles that headed generally eastward (Florida Straits [116º], Boca Raton [67º]). The Melbourne Beach turtles uniquely oriented WSW (259º) and showed significant differences from the turtles that headed eastward, but not from the three groups that headed to the NW, though differences approached significance (probabilities range between 0.06 and 0.08; Table 2). The orientation of the turtles that oriented east (Florida Straits, Boca Raton) differed statistically from the remaining turtles that were significantly oriented (Table 2)
12
DISCUSSION This study provides evidence that hatchling loggerheads from Florida‟s Gulf Coast possess a magnetic map and are capable of using it for migratory orientation in Gulf waters, for transport via the Florida Straits into the western Atlantic, and for migration within the Florida Current. These capabilities are similar to those demonstrated previously for hatchlings migrating away from Florida‟s east coast and across the Atlantic Ocean basin via the North Atlantic gyre (Lohmann & Lohmann 1994a, 1996; Lohmann et al. 2001). My study was confined to a smaller geographic area (the eastern GM and the Atlantic coast of Florida). Additionally, I presented hatchlings with magnetic waypoints that, in some instances, were separated by as little as 65 km. I did so because west hatchlings must negotiate a more complex series of surface currents within the GM than hatchlings departing from nesting beaches on Florida‟s east coast. To understand how west turtles responded to those currents required a more detailed assay of their orientation behavior. I hoped to use that information to better understand the turtles‟ most likely migratory pathways within the GM, and to determine whether west hatchlings possessed magnetic maps that could also be used to promote their migration within the Atlantic Ocean. The more important findings were the following. First, the hatchlings show different orientation responses even when exposed to magnetic waypoints that are < 200
13
km apart. These responses suggest that the hatchling magnetic map can, at least in some Gulf areas, provide more detailed information than previously thought (e.g., “regional markers” of Lohmann et al. 2001). Second, west hatchlings, when presented with waypoints within the Florida Current and Gulf Stream, orient in directions appropriate for transport out of the GM and northward, within the Atlantic Ocean. These behavioral responses are consistent with the hypothesis that at least some of the turtles may be transported across the Atlantic to nursery sites on the east side of the basin. Third, the orientation responses shown by the turtles to waypoints within the Gulf of Mexico provide clues that suggest how they migrate within that area, and locate currents for transport elsewhere. I discuss these points below. Orientation and migratory routes: a hypothesis Large juvenile turtles and adults are powerful swimmers that may migrate with, across, or against prevailing surface currents (Cheng & Wang 2009). Small turtles, such as loggerheads during their first few months at sea, are weak swimmers that successfully complete long-distance migrations by orienting toward favorable currents (Carr 1986, 1987), by positioning themselves favorably within those currents once located (Lohmann et al. 1997), and by remaining relatively inactive (generally, hidden in weed lines) once they are found. This “smart drifter” strategy (Witherington 2002) not only promotes migratory movement at minimal cost, but also minimizes the dangers associated with drift into dangerous (e.g. shallow, colder) waters. The turtles are able to execute this strategy, even before they enter the ocean, because they can estimate their geographic position within a major current system used 14
for migratory transport: the North Atlantic gyre (Lohmann et al. 2001). They accomplish this feat by independently detecting at least two parameters of the Earth‟s magnetic field (inclination angle, intensity). When hatchlings are presented with magnetic field waypoints present at widely separated locations along the outer margin of the gyre, they orient toward the gyre‟s interior (Lohmann & Lohmann 1998; 2003). This response promotes their retention within the gyre where conditions are presumed to be most favorable for their continued survival. It also favors their transport toward eastern Atlantic nursery areas adjacent to seamount islands (Madeira, the Azores, and the Canary Islands) where food is abundant and where the turtles can grow rapidly (Bolten et al. 1998; Bolten 2003). In this study, I used the responses of west hatchlings to magnetic waypoints as an indicator of their most likely migration pathways, all of which are currently unknown. The following questions were primary. Which direction do the Sarasota hatchlings orient after distancing themselves from the nesting beach? What surface currents in the Gulf of Mexico do they exploit to reach their “goals”? Are the turtles capable of orienting appropriately in the Atlantic Ocean and if so, then how are they transported from the Gulf of Mexico to that ocean? One possibility is that the turtles locate the Loop Current and reach the Atlantic through the Florida Straits, but how could such a migration be accomplished by a Sarasota turtle? Given the limited swimming capabilities of hatchling loggerheads (Wyneken 1997), it seems unlikely that such a small turtle could directly negotiate the 150 - 200 km distance between its nesting beach and the Loop Current (Sturges & Lugo-Fernandez 2005; Gyory et al. 2005). A more plausible hypothesis is that the turtles locate a favorable current; but 15
which, of those available, do they use? At Sarasota Beach (Fig. 3C), the turtles oriented northwest toward both deeper water and the north-flowing countercurrent present about 60 km offshore. This current would actually transport turtles away from the Loop Current, at least temporarily. However, a northward displacement eventually places the turtles in closer proximity to a parallel current with southerly flow, located just to the west (Fig. 5). I hypothesize that this south current is used for transport to the Loop Current and from there, into the Florida Straits and the Atlantic Ocean. If this hypothesis is correct, the turtles apparently take a circuitous route to reach their destination, but one that may be the best available alternative. It may also have some advantages. Among these are that the currents are the most reliably present, have the strongest flow, and are in closest proximity to the nesting beach. The migratory path described above might also be characterized by detours that take advantage of favorable resources when these are available. The juxtaposition of northward and southward flowing currents (Fig. 5) is likely to promote the formation of downwelling fronts where Sargassum mats may form. Neonate and juvenile loggerhead, green (Chelonia mydas), and Kemp‟s ridley (Lepidochelys kempi) turtles are apparently abundant in those weed lines (Witherington & Hirama 2006). The site also provides an opportunity for the turtles to maintain a northward or southward geographic position as conditions dictate. They might, for example, shuttle between opposing currents while feeding within weedlines before they elect to depart from Gulf waters by swimming across current, into the area of southern flow. “Lingering” in the relatively warm and highly productive northeastern Gulf waters (Weisberg et al. 2000; Liu & Weisberg 2007)
16
would also promote rapid growth before the turtles embark on a more lengthy migration to more southern latitudes in the Gulf, or toward the Atlantic Ocean. My results provide less insight into the migratory routes that the turtles might choose elsewhere in the GM. The northwest orientation of turtles near Pensacola is a case in point. I could find no reliable data on the direction and magnitude of the nearshore currents in that area. Similarly, the response of the hatchlings to a waypoint just north of the Florida Keys is also problematic for the same reasons (Fig 4A). One possibility is that movement to the NW distances the hatchlings from the shallow reefs of Florida Bay where they are more likely to encounter both aerial and aquatic predators (Wyneken & Salmon 1992; Stewart & Wyneken 2004; Whelan & Wyneken 2007). Swimming northwest also closes the distance between the hatchlings and currents flowing to the south that eventually feed into the Loop Current (Fig. 5). The orientation responses shown by the hatchlings presented with waypoints in the Florida Straits and offshore at Boca Raton are consistent with the hypothesis that west turtles, like the hatchlings departing from beaches on the southeast coast of Florida, use the Florida Current for entry into the North Atlantic gyre. The turtles exposed to a waypoint 40 km east of Melbourne Beach, however, showed a bimodal distribution. That location is near to the western wall of the Gulf Stream. One possibility is that the hatchlings found themselves divided between two migratory options, one of which was to swim NE on a course into the current while the other was to swim SW on a course into the south-flowing counter current. The latter would eventually place the turtles closer to the Gulf Stream (Fig. 5). Hatchlings were not significantly oriented when exposed to a magnetic field 17
replicating one that exists 240 km to the SE of Pensacola or 65 km west of Sarasota Beach. These responses are also difficult to interpret. It seems unlikely, however, that no significant orientation occurred at those waypoints due to chance since the turtles showing this behavior came from the same clutches, and were tested on the same evenings, as those that showed significant orientation at other waypoints. It also seems unlikely that these locations represented areas outside the normal migratory route of the turtles (Lohmann & Lohmann 1994a, 1998) as one of these waypoints was within 65 km of Sarasota Beach where the turtles were well oriented. An alternative hypothesis is that at both waypoints where orientation failed to occur, current flow was unpredictable and thus there were no immediate benefits to orienting any one direction (Lohmann & Lohmann 1994a, 1998). The ecology of magnetic navigation by hatchling loggerheads Previous experiments have shown Atlantic coast hatchlings to be capable of recognizing geomagnetic field values from a few widely separated locations along their migratory route within the North Atlantic gyre. The turtles use this information to orient in directions that will result in their continued entrainment within the gyre and advancement along their migratory journey (Lohmann et al. 2001). These results demonstrate that hatchlings with no migratory experience, and even before they begin a migration in the Atlantic Ocean, possess at the minimum an ability to respond to critical magnetic areas along their migratory route and use these as navigational markers (Lohmann & Lohmann 1994b, 1998, 2006). My data suggest that a similar guidance system based upon magnetic cues may also guide the migration of west hatchlings within
18
the GM. At the same time, my results suggest that the magnetic maps used as innate guidance systems by hatchlings may be far more detailed than previously thought. The magnetic map hypothesis of position finding is based on detection of at least two magnetic field components that intersect at an angle and vary spatially, and so can be used as gradients for navigation (Kramer 1957; Wallraff 1991; Wiltschko & Wiltschko 1995, 2009). The difference between local bicoordinate values and those of the destination requires that the distance travelled is great enough to involve a detectable gradient change. The usefulness of the magnetic field information should therefore improve with increasing distance and with increasing ability to determine these differences. The distance between waypoint locations used in this study ranged between 65 and 820 km (average: 415 km), resulting in similar geomagnetic parameters among waypoints (Table 1). There was, for example, no difference in the horizontal component between the waypoint at Sarasota Beach (eliciting significant orientation) and the waypoint 65 km to the west of Sarastota Beach (eliciting no significant orientation). Therefore, a difference of 0.2 μT between the vertical components, 0.2 μT between the intensities, and 0.1° between the inclination angles at these two locations were (either alone or in combination) discernable and functionally significant to the hatchlings. Additionally, significant orientation to the northwest was elicited 60 km north of the Florida Keys whereas hatchlings exposed to a waypoint within the Florida Straits (60 km to the south of the Florida Keys) oriented to the southeast. The difference in magnetic field values between these locations included 0.3 μT in the horizontal component, 1.1 μT in the vertical component, 0.7 μT in the intensity, and 1.2° in the 19
inclination angle. These two examples, then, show that hatchlings respond differently to magnetic field characteristics at a fine spatial, and make what may be important discriminations between them. This idea has some parallels in the navigation literature. Animals that use the Earth‟s magnetic field as a source of information to guide them along relatively short distances (under 10 km, in some cases) such as newts (Fischer et al. 2001; Phillips et al. 2002), alligators (Rodda 1984) and lobsters (Boles & Lohmann 2003) may require a magnetic map of higher resolution, depending upon the nature of the environmental features that must be recognized at particular waypoints. In the case of hatchlings in the Gulf of Mexico, currents are remarkably variable both in space and through time, requiring responses that may necessitate greater resolution. In the North Atlantic, the gyre system is both temporally and spatially stable over relatively great distances (hundreds to thousands of kilometers). A low-resolution response based upon magnetic markers over widely separated distances may suffice to guide this portion of the migratory journey. In addition, the operation of a sea turtle‟s magnetic map may differ among areas where there are differences between the alignment of the magnetic bicoordinates that the turtles can detect (intensity and dip angle). These can vary between areas where the bicoordinates are almost parallel to those where the coordinates are almost perpendicular (creating an orthogonal grid) across the Earth‟s surface (Lohmann et al. 1999, 2007, 2008). The magnetic gradients adjacent to the Florida peninsula and in the GM are nearly parallel, which might make navigation more difficult. Adult and experienced juvenile turtles have available a number of options that can be used to reach goals even 20
under those circumstances, such as the use of alternative (surface waves, odor, solar or polarized light) cues, the use of a variety of cues in sequences, and the tracking of gradients, perhaps learned through experience, down continental shorelines (Lohmann & Lohmann 1996; Lohmann et al. 1999, 2007, 2008). My data, surprisingly, suggest that even where magnetic bicoordinates are almost parallel, hatchlings without experience are able to make fine-scale spatial discriminations based only upon magnetic cues between locations less than 200 km apart (Fig. 3C and D; Fig. 4A and B). Management and conservation implications The results of this study have implications for management unit boundaries within the South Florida loggerhead subpopulation. Management units (MU) were defined by Moritz (1994) on the basis of distinct differences in allele frequency at nuclear or mitochondrial DNA loci. On that basis, hatchlings departing from nesting beaches on the southeastern and southwestern coasts of Florida are members of one (South Florida) subpopulation as they show no statistical differences in either their mitochondrial or nuclear DNA frequencies (Encalada et al. 1998; Pearce 2001; Shamblin 2007). However, a lack of genetic divergence may occur either because it does not exist, or because so few genes are involved that they have yet to be identified. A strictly genetic criterion for MU fails to consider the implications of how those units evolve when the underlying mechanism is initiated through behavior, and only later becomes manifested by genetic change (Crandall et al. 2000; Fraser & Bernatchez 2001). In the case of many migratory animals (e.g., birds and salmonid fishes) generally, and loggerheads in particular, subpopulations are initiated by “founders” who broaden the geographic range of rookeries by their choice of new breeding sites (Carson 1971, 1982; 21
Templeton 1980). In turtles, the founders are females and if the choice of site is advantageous, it results in the return of daughters that show fidelity to that site and establish a new nesting population (Carr 1967; Carr et al. 1978). Over succeeding generations, the frequencies of the mtDNA genes present in founder and her offspring evolve to become regionally distinct from other such groups, and a new subpopulation that formed earlier can at last be detected genetically (Bowen et al. 1993; Bowen & Avise 1995; Encalada et al. 1998; 2005; Bowen & Karl 2007). We have tantalizing evidence that this process is currently in its early stages within the South Florida subpopulation and for that reason, is not yet manifested by genetics. Nonetheless, female loggerheads show fidelity to each coast and rarely nest on the opposite coast. The hatchlings that emerge from the nests on each side of the peninsula are morphologically identical but show distinct differences in swimming activity under laboratory conditions during the time periods when they are migrating offshore (Wyneken et al. 2008). The conservative approach is to consider the turtles nesting on each coast as two management units that may be in the process of evolving differences in behaviorally important traits (Crandall et al. 2000; Fraser & Bernatchez 2001). Doing so is advantageous because it promotes management oversight in a species whose numbers are currently in serious decline (Witherington et al. 2009). Not doing so may potentially cause harm by seriously underestimating the importance of biological processes that take place over long time scales. Loggerhead sea turtles depart from natal beaches, swim offshore, and enter an oceanic stage that can last 12-15 years (Bolten & Balazs 1995; Bjorndal et al. 2000, 2001). Studies such as this one, which identifies probable migratory routes within the 22
Gulf of Mexico, are fundamental to the protection of habitats crucial for the recovery of marine turtles. The eastern GM and Western Florida Shelf appear to be of primary importance for the inter-nesting movements, post-nesting migrations, and foraging habitats of adult female loggerheads (Girard et al. 2009). Additionally, neonates and juvenile loggerhead, green, and Kemp‟s ridley sea turtles have been observed and captured within drift-lines in the eastern Gulf of Mexico (Witherington & Hirama 2006). Protection of these habitats could be vital to the survival of the loggerhead‟s South Florida Nesting Subpopulation, and especially the southwestern Florida management unit. Conclusions and future directions The loggerhead sea turtle is threatened throughout its range (IUCN 2008). The South Florida subpopulation of loggerheads is the largest rookery in the Atlantic and one of the two largest aggregations of nesting loggerheads in the world (Murphy & Hopkins 1984; Conley & Hoffman 1987; Dodd 1988; Bowen et al. 1994). Hatchlings from Florida‟s Gulf coast must navigate a complex route to reach possible nursery areas within the Gulf of Mexico, the eastern Atlantic, or perhaps in both areas. My results provide evidence that loggerhead hatchlings from Florida‟s Gulf coast have magnetic maps that can be used in both Gulf and western Atlantic waters, but I cannot determine on the basis of my results whether the turtles migrate from one habitat to the other or when during development such a migration might occur. The next logical step is to track the movements of hatchling and juvenile loggerheads within the Gulf of Mexico so that their responses to surface currents and positional changes can be empirically observed. The technology for doing studies of this nature on small turtles is 23
now available (Mansfield and Wyneken, pers. comm.) and should considerably advance our understanding of how migration is accomplished by small turtles.
24
LITERATURE CITED Batschelet, E. 1981. Circular Statistics in Biology. London: Academic Press. Bjorndal, K. A., A. B. Meylan, and B. J. Turner. 1983. Sea turtle nesting at Melbourne Beach, Florida, I. size, growth and reproductive biology. Conservation 26: 65-77. Bjorndal, K. A., A. B. Bolten, and H. R. Martins. 2000. Somatic growth model of juvenile loggerhead sea turtles Caretta caretta: duration of pelagic stage. Marine Ecology-Progress Series 202: 265-272. Bjorndal, K. A., A. B. Bolten, B. Koitke, B. A. Schroeder, D. J. Shaver, W. G. Teas and W. N. Witzell. 2001. Somatic growth function for immature loggerhead sea turtles, Caretta caretta, in southeastern U.S. waters. Fisheries Bulletin 99 (2): 240-246. Boles, L. C. and K. J. Lohmann. 2003. True navigation and magnetic maps in spiny lobsters. Nature 421:60–63. Bolten, A. B., H. R. Martinas, K. A. Bjorndal, and J. Gordon. 1993. Size distribution of pelagic-stage loggerhead sea turtles (Caretta caretta) in the waters around the Azores and Madeira. Arsquipélago 11A: 49-54. Bolten, A.B. and G.H. Balazs. 1995. Biology of the early pelagic stage – the “lost year”. In Biology and Conservation of Sea Turtles, Revised edition, ed. K. A. Bjorndal, 579-581. Washington DC: Smithsonian Institution Press.
25
Bolten, A. B., K. A. Bjorndal, H. R. Martins, T. Dellinger, M. J. Biscoito, S. E. Encalada, and B. W. Bowen. 1998. Transatlantic developmental migrations of loggerhead sea turtles demonstrated by mtDNA sequence analysis. Ecological Applications 8: 1-7. Bolten, A.B. 2003a. Variation in sea turtle life history patterns: neritic vs. oceanic development stages. In The Biology of Sea Turtles, ed. P. L. Lutz and J. A. Musick, 243-257. Boca Raton: CRC Press. Bolten, A.B. 2003b. Active swimmers-passive drifters: the oceanic juvenile stage of loggerheads in the Atlantic system. In Loggerhead Sea Turtles, ed. A. B. Bolten and B. E. Witherington, 63-78. Washington DC: Smithsonian Books. Bowen, B. W., J. C. Avise, J. I. Richardson, A. B. Meylan, D. Margaritoulis, and S. R. Hopkins-Murphy. 1993. Population structure of loggerhead turtles (Caretta caretta) in the northwestern Atlantic Ocean and Mediterranean Sea. Conservation Biology 7(4): 834-843. Bowen, B. W., N. Kamezaki, C. J. Limpus, G. R. Hughes, A. B. Meylan, and J. C. Avise. 1994. Global phylogeography of the loggerhead turtle (Caretta caretta) as indicated by mitochondrial DNA haplotypes. Evolution 48(6): 1820-1828. Bowen, B. W. and J. C. Avise. 1995. Conservation genetics of marine turtles. In Conservation Genetics: Case Histories From Nature, ed. J. C. Avise and J. L. Hamrick, 190-237. New York: Columbia University Press. Bowen, B.W., A. L. Bass, L. Soares, and R. J. Toonen. 2005. Conservation implications of complex population struction: lessons from the loggerhead turtle (Caretta caretta). Molecular Ecology 14: 2389-2402. 26
Bowen, B. and S. Karl. 2007. Population genetics and phylogeography of sea turtles. Molecular Ecology 16: 4886-4907. Carr, A. F. 1967. So Excellent a Fishe: A Natural History of Sea Turtles. Scribner, New York. Carr, A. F., M. H. Carr, and A. B. Meylan. 1978. The ecology and migration of sea turtles, 7. The West Caribbean green turtle colony. Bulletin of the American Museum of Natural History 162: 1–46. Carr, A. 1986. Rips, FADS, and little loggerheads. BioScience 36:92-100. Carr, A. 1987. Reproduction and migrations of the Ascension Island green turtle Chelonia mydas. Copeia 1: 103-113. Carson, H. L. 1971. Speciation and the founder principle. University of Montana Stadler Genetic Symposia 3: 51-70 Carson, H. L. 1982. Evolution of Drosophila on the newer Hawaiian volcanoes. Heredity 48: 3-25. Cheng, I. and Y. Wang. 2009. Influence of surface currents on post-nesting migration of green sea turtles nesting on Wan-An Island, Penghu Archipelago, Taiwan. Journal of Marine Science and Technology 17(4): 306-311. Collard, S. B. and L. H. Ogren. 1990. Dispersal scenarios for pelagic post-hatchling sea turtles. Bulletin of Marine Science 47 (1): 233-243. Conley, W., and B. Hoffman. 1987. Nesting activity of sea turtles in Florida, 1979-1985. Florida Scientist 50(4): 201-210.
27
Crandall, K. A., O. R. P. Bininda-Emonds, G. M. Mace, and R. K. Wayne. 2000. Considering evolutionary processes in conservation biology. Trends in Ecology and Evolution 15: 290-295. Dodd, C. K. 1988. Synopsis of the biological data on the loggerhead sea turtle Caretta caretta (Linnaeus 1758). U.S. Fish and Wildlife Service Biological Report 88(14): 1-110. Encalada, S. E., K. A. Bjorndal, A. B. Bolten, J. C. Zurita, B. Schroeder, E. Possardt, C. J. Sears, and B. W. Bowen. 1998. Population structure of loggerhead turtle (Caretta caretta) nesting colonies in the Atlantic and Mediterranean as inferred from mitochondrial DNA control region sequences. Marine Biology 130: 567575. Fischer J. H., M. J. Freake, S. C. Borland, and J. B. Phillips. 2001. Evidence for the use of magnetic map information by an amphibian. Animal Behaviour 62:1–10. Fraser, D. J. and L. Bernatchez. 2001. Adaptive evolutionary conservation: towards a unified concept for defining conservation units. Molecular Ecology 10: 27412751. Fuxjager, M. J., L. A. Mangiamele, K. R. B. Davidoff and K. J. Lohmann. 2005. Effects of the magnetic environment of sea turtle nests on magnetic orientation behavior in hatchlings. Integrative and Comparative Biology 45(6): 999. Girard, C., A. D. Tucker and B. Calmettes. 2009. Post-nesting migration of loggerhead sea turtles in the Gulf of Mexico: dispersal in highly dynamic conditions. Marine Biology 156(9): 1827-1839.
28
Gyory, J., A. J. Mariano, and E. H. Ryan. 2005. "The Loop Current." Ocean Surface Currents. http://oceancurrents.rsmas.miami.edu/atlantic/loop-current.html. (Accessed: 2008, March 13) IUCN 2008. 2008 IUCN Red List of Threatened Species. . Irwin, W. P., A. Horner and K. J. Lohmann. 2004. Magnetic field distortions produced by protective cages around sea turtle nests: unintended consequences for orientation and navigation. Biological Conservation 118: 117-120. Kramer, G. 1957. Experiments on bird orientation and their interpretation. Ibis 99: 196227. LeBuff Jr., C. R. 1990. The Loggerhead Turtle in the eastern Gulf of Mexico. Caretta Research Inc. Sanibel, Florida. Light, P., Salmon, M. and Lohmann, K. J. 1993. Geomagnetic orientation of loggerhead sea turtles: evidence for an inclination compass. Journal of Experimental Biology 182: 1-10. Liu, Y., and R. Weisberg. 2007. Ocean currents and sea surface heights estimated across the West Florida Shelf. Journal of Physical Oceanography 37(6): 1697–1713. Lohmann, K. J. 1991. Magnetic orientation by hatchling loggerhead sea turtles (Caretta caretta). Journal of Experimental Biology 155:37-49. Lohmann, K. J. and C. M. F. Lohmann. 1993. A light-independent magnetic compass in the leatherback sea turtle. Biological Bullitin (Woods Hole) 185: 149-151. Lohmann, K. J. and C. M. F. Lohmann. 1994a. Detection of magnetic inclination angle by sea turtles: a possible mechanism for determining latitude. Journal of Experimental Biology 194: 23-32. 29
Lohmann, K. J. and C. M. F. Lohmann. 1994b. Acquisition of magnetic directional preference in hatchling loggerhead sea turtles. Journal of Experimental Biology 190: 1-8. Lohmann, K. J. and C. M. F. Lohmann. 1996. Detection of magnetic field intensity by sea turtles. Nature 380: 59-61. Lohmann, K. J., B. E. Witherington, C. M. F. Lohmann, and M. Salmon. 1997. Orientation, navigation, and natal beach homing in sea turtles. In The Biology of Sea Turtles, ed. P. L. Lutz and J. A. Musick, 107-135. Boca Raton: CRC Press, Inc. Lohmann, K. J. and Lohmann, C. M. F. 1998. Migratory guidance mechanisms in marine turtles. Journal of Avian Biology 29: 585-596. Lohmann, K. J, J. T. Hester, and C. M. F. Lohmann. 1999. Long-distance navigation in sea turtles. Ethology Ecology & Evolution 11: 1-23. Lohmann, K. J., S. D. Cain, S. A. Dodge, and C. M. F. Lohmann. 2001. Regional magnetic fields as navigational markers for sea turtles. Science 294: 364-366. Lohmann, K. J. and C. M. F. Lohmann. 2003. Orientation mechanisms of hatchling loggerheads. In Loggerhead Sea Turtles, ed. A. B. Bolton and B. E. Witherington, 44-62. Washington DC: Smithsonian Books. Lohmann, K. J. and Lohmann, C. M. F. 2006. Sea turtles, lobsters, and oceanic magnetic maps. Marine and Freshwater Behavior and Physiology 39(1): 49-64. Lohmann, K. J., C. M. F. Lohmann, and N. F. Putman. 2007. Magnetic maps in animals: nature‟s GPS. Journal of Experimental Biology 210: 3697-3705.
30
Lohmann, K. J., P. Luschi, and G. C. Hays. 2008. Goal navigation and island-finding in sea turtles. Journal of Experimental Marine Biology and Ecology 356: 83-95. Merritt, R., C. Purcell, and G. Stroink. 1983. Uniform magnetic field produced by three, four and five square coils. Review of Scientific Instruments 54: 879-882. Meylan, A., B. Schroeder, and A. Mosier. 1995. Sea turtle nesting activity in the state of Florida 1979-1992. Florida Marine Research Publications 52:1-51. Molinari, R. L. 1980. Current variability and its relation to sea-surface topography in the Caribbean Sea and the Gulf of Mexico, Marine Geodesy 3: 409-436. Moritz, C. 1994. Defining „evolutionary significant units‟ for conservation. Trends in Ecology and Evolution 9: 373-375. Murphy, T., and S. Hopkins. 1984. Aerial and ground surveys of marine turtle nesting beaches in the southeast region. Final Report to National Marine Fisheries Service. NOAA National Data Buoy Center (2006, October 3) “Florida and Eastern Gulf of Mexico Recent Marine Data”. http://www.ndbc.noaa.gov/maps/Florida.shtml. (Accessed: 2008, March 13) Pearce, A. 2001. Contrasting population structure of the loggerhead turtle (Caretta caretta) using mitochondrial and nuclear DNA markers. Master‟s thesis, University of Florida. Phillips J. B., M. J. Freake, J. H. Fischer, and S. C. Borland. 2002. Behavioural titration of a magnetic map coordinate. Journal of Comparative Physiology 188:157–160. Rodda G. H. 1984. The orientation and navigation of juvenile alligators: evidence of magnetic sensitivity. Journal of Comparative Physiology A 154:649–658. 31
Salmon, M. and Wyneken, J. 1987. Orientation and swimming behavior of hatchling loggerhead turtles Caretta caretta L. during their offshore migration. Journal of Experimental Marine Biology and Ecology 109: 137-153. Shamblin, B. 2007. Population structure of loggerhead sea turtles (Caretta caretta) nesting in the southeastern United States inferred from mitochondrial DNA sequences and microsatellite loci. Master’s Thesis, University of Georgia. Stewart, K. R. and J. Wyneken. 2004. Predation risk to loggerhead hatchlings at a highdensity nesting beach in Southeast Florida. Bulletin of Marine Science 74(2): 325335. Sturges W. and A. Lugo-Fernández. 2005. Circulation in the Gulf of Mexico: Observations and Models. American Geophysical Union, Washington D.C. Templeton, A. R. 1980. The theory of speciation via the founder principle. Genetics 94: 1011-1038. Tucker, A. D. 2010. Nest site fidelity and clutch frequency of loggerhead turtles are better elucidated by satellite telemetry than by nocturnal tagging efforts: Implications for stock estimation. Journal of Experimental Marine Biology and Ecology 383: 48-55. Wallraff, H. G. 1991. Conceptual approaches to avian navigation systems. In Orientation in Birds, ed. P. Berthold, 128-165. Basel: Birkhauser. Weisberg, R. H., B. D. Black, and Z. Li. 2000. An upwelling case study on Florida‟s west coast. Journal of Geophysical Research 105(C5), 11,459–11,469.
32
Whelan, C. L. and J. Wyneken. 2007. Estimating predation levels and site-specific survival of hatchling loggerhead sea turtles (Caretta caretta) from south Florida beaches. Copeia 3: 745-754. Wiltschko, R. and W. Wiltschko. 1995. Magnetic Orientation in Animals. Berlin, Heidelberg, New York: Springer Verlag. Wiltschko, R. and W. Wiltschko. 2009. Avian Navigation. The Auk 126(4): 717-743. Witherington, B. E., K. A. Bjorndal, and C. M. McCabe. 1990. Temporal pattern of nocturnal emergence of loggerhead turtle hatchlings from natural nests. Copeia 4: 1165-1168. Witherington, B. E. 2002. Ecology of neonate loggerhead turtles inhabiting lines of downwelling near a Gulf Stream front. Marine Biology 140: 843-853. Witherington, B. E. and S. Hirama. 2006. Sea turtles of the epi-pelagic Sargassum drift community. Presented at the 26th Annual Symposium of Sea Turtle Biology and Conservation, in Athens, Greece. Witherington, B. E., P. Kubilis, B. Brost, and A. Meylan. 2009. Decreasing annual nest counts in a globally important loggerhead sea turtle population. Ecological Applications 19(1): 30-54. Wyneken, J. and M. Salmon. 1992. Frenzy and postfrenzy swimming activity in loggerhead, green, and leatherback hatchling sea turtles. Copeia 2: 478-484. Wyneken, J. 1997. Sea turtle locomotion: mechanics, behavior, and energetics. In The Biology of Sea Turtles, ed. P. L. Lutz and J. A. Musick, 165-198. Boca Raton: CRC Press, Inc.
33
Wyneken, J., S. V. Madrak, M. Salmon and J. Foote. 2008. Migratory activity by hatchling loggerhead sea turtles (Caretta caretta L.): evidence for divergence between nesting groups. Marine Biology 156 (2): 171-178. Zar, J. H. 1999. Biostatistical Analysis. Prentice Hall, Englewood Cliffs, NJ.
34
Table 1. Magnetic waypoint locations and their associated magnetic field components (in microtesla [μT]). See Figs. 3-4 for their geographic location and Fig. 2 for the flow of the adjacent surface currents. Waypoint
Horizontal Vertical Intensity Inclination (μT) (μT) (μT) Angle (°)
60 km south of Pensacola
24.7
40.6
47.5
58.7
240 km southeast of Pensacola
24.7
40.0
47.0
58.3
65 km west of Sarasota Beach
26.3
37.5
45.8
55.0
Sarasota Beach (Casey Key – collection site)
26.3
37.7
46.0
55.1
60 km north of Florida Keys
24.8
36.6
44.2
55.9
Florida Straits (60 km south of Florida Keys)
25.1
35.5
43.5
54.7
40 km east of Melbourne Beach, Fl
24.7
39.2
46.3
57.8
20 km east of Boca Raton, Fl
25.4
37.0
44.9
55.5
35
Table 2. Results of Mardia-Watson-Wheeler tests to determine whether there were statistical differences among the 6 waypoint sites where the turtles showed significant orientation (see Figs. 3-6). Values below the asterisks are the W scores; values above the asterisks are probabilities, with p < 0.05 in bold. Waypoints 60 km S of Pensacola Sarasota Beach 60 km N of Florida Keys Florida Straits 40 km E of Melbourne 20 km E of Boca Raton
40 km S of Pensacola
Sarasota Beach
60 km N of Florida Keys
Florida Straits
40 km E of Melbourne
20 km E of Boca Raton
*
0.63
0.45
< 0.001
0.08
0.001
0.939
*
0.85
< 0.01
0.08
< 0.01
1.606
0.325
*
< 0.01
0.06
< 0.01
15.017
11.008
11.53
*
< 0.01
0.10
5.068
5.006
5.741
12.864
*
< 0.01
13.329
12.186
12.49
4.563
11.604
*
36
Figure 1. Above, diagram of the coil and water-filled pool used to measure hatchling orientation. The tank was surrounded by horizontally and vertically arranged wire coils which, when provided with a DC current, altered the magnetic field inside the coil and replicated the field at a particular geographic location. Below, the turtle was placed in a nylon-lycra harness (A) attached by a short monofilament tether to a horizontally rotating lever arm (arrow, B). Lever arm rotation was linked to a digital encoder that tracked the turtle‟s swimming direction. These data were then stored on computer. See text for additional details.
37
Figure 2. Typical sea surface currents in the Gulf of Mexico and in the waters adjacent to the Southeastern coast of Florida during the late summer months when loggerhead hatchlings begin their migration. Black arrows show current direction; arrow length is proportional to current velocity. White letters mark the major surface currents that loggerhead hatchlings might use for transport out of the Gulf of Mexico (A. Loop Current; B. Florida Current) and into the North Atlantic via the Gulf Stream (C). Red circles show the location of the 8 waypoints presented to the hatchlings in this study. These were: 1) 60 km S of Pensacola; 2) 240 km SE of Pensacola; 3) 65 km W of Sarasota Beach; 4) Sarasota Beach (adjacent to Casey Key); 5) 60 km N of the Florida Keys; 6) within the Florida Straits; 7) 20 km E of Boca Raton (within the Gulf Stream); 8) 40 km E of Melbourne Beach (western edge of the Gulf Stream). 38
The hatchlings are significantly oriented at Sarasota Beach but not at the offshore waypoint.
confidence intervals). At 240 km SE of Pensacola the turtles (n = 28 hatchlings tested) failed to show significant orientation (n.s).
Pensacola the turtles (n = 22 hatchlings tested) were significantly oriented to the NW (mean angle of 324°; dashed lines are 95 %
dots) tested at that waypoint. The map at each site shows the location of the waypoint (filled red dot). For example, at 60 km South of
Sarasota Beach; and D, 65 km offshore of Sarasota Beach. The circle diagram at each site shows the orientation of the hatchlings (blue
Figure 3. Hatchling orientation in the Eastern Gulf of Mexico. A, 60 km south of Pensacola; B, 240 km southeast of Pensacola; C,
39
and 13 swimming NE (33º).
(116˚) at B, and to the ENE (69˚) at C. Hatchling orientation at D suggests bimodal distribution, with 19 turtles swimming SW (238º)
40 km east of Melbourne Beach. Format, as in Fig. 3. The hatchlings are significantly oriented to the NE (327˚) at A, to the ESE
Figure 4. Hatchling orientation at A, 60 km north of the Florida Keys; B, in the Florida Straits; C, 20 km east of Boca Raton; and D,
40
Not oriented
Oriented
Hypothetical route
0° 270°
90°
180°
180°
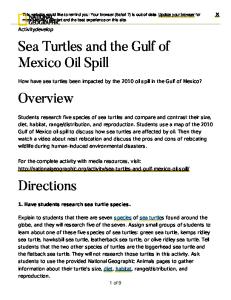
Figure 5. Hypothesized migratory route (open black arrows) of the Sarasota Beach hatchlings in the Gulf of Mexico, shown in relation to the direction of the surface currents recorded over the last 25 years (CIMAS drift buoy data) and the behavior of the turtles when presented with each waypoint (“oriented” or “not oriented”; white circles). Direction of current flow (+ 45º) is indicated by the color wheel in which north (0°) is blue, south (180°) is red, west (270°) is yellow and east (90°) is cyan. Dashed lines show the general position of the Loop Current. See text for additional details.
41